Strong ground motion signal selection consistent ith local seismic hazard levels Applications in 3 cities in Colombia
11
0
0
Texto completo
(2) Strong ground motion signal selection consistent with Local seismic hazard levels. Applications in 3 cities in Colombia M.A. Salgado ITEC CAPRA-DRM Consortium, Bogotá, Colombia.. D. Zuloaga ITEC CAPRA-DRM Consortium, Bogotá, Colombia.. G. Bernal CIMNE, Universidad Politécnica de Cataluña, Barcelona, España. L.E. Yamín Universidad de Los Andes, Bogotá, Colombia. O.D. Cardona Universidad Nacional de Colombia, Sede Manizales, Manizales, Colombia. SUMMARY: Adequate selection of time-histories for earthquake engineering applications is needed in order to obtain recordings consistent with local seismic hazard conditions. Identifying the different sources contributing for an specific zone of interest using spectral attenuation relationships and calculating the uniform hazard spectrum (UHS) for each of them it is possible to define Magnitude (M) – Distance (R) pairs to use real accelerographs available on numerous global databases at stations located in rock or stiff soil and on free-ground conditions. Results for three cities are obtained from the national seismic hazard study conducted in 2010 in terms of UHS for 475 years return period using spectral attenuation relationships and using a multi-parameter methodology MR range pairs for the following cities: Bogotá, Cali and Manizales. Keywords: Earthquake scenarios, probabilistic seismic hazard assessment, acceleration time-histories. 1. INTRODUCTION Seismic hazard can be assessed and presented in different ways; apart from the probabilistic seismic hazard analysis (PSHA) described by metrics such as the intensity exceedance rate, which is the state of the art metric, it can also be represented using acceleration time-history recordings where various characteristics such as the ground shaking frequency content and amplitude can be considered. For this approach to the hazard representation, it is necessary to select in an appropriate manner the acceleration time-histories to be employed in the different applications which include seismic design, local dynamic response, analysis of critical infrastructure and complex buildings where higher modes can be excited. Due to the lack of information, it is common practice to use real strong ground motion recordings and scale them to the local hazard level for a specific return period. However, this approach does not necessarily reflect some parameters such as the duration and frequency content of the feasible scenarios within the analysis zone. This paper presents the results of acceleration time-history selection using the methodology proposed by McGuire (McGuire, 1995), where M-R range pairs are obtained from the uniform hazard spectrum for a selected return period from a previously conducted PSHA with CRISIS 2007 (Ordaz et al, 2007). In many seismic design aspects the input comes from the representation of the earthquake loads through a response spectrum (usually in terms of acceleration), but recently with the displacement based design trend, there has been a change in the input representation, requiring in many cases timehistory recordings..
(3) The aim of the paper is to define the set of scenarios compatible with the local hazard levels taking into account information related to the recurrence information of the seismic source and the distance to the analysis area. The strong ground motion selection is presented for three cities in Colombia. Following the selection process, a set of available accelerographs separated for different source characteristics in terms of magnitude, hypocentral distance and frequency content is presented. Comparisons between the elastic design spectrum defined in the national building code NSR-10 (AIS, 2010a), the elastic design spectrum specified on the local seismic microzonations (for Bogotá), and the seismic signals found to be representative for the cities are presented.. 2. GENERAL METHODOLOGY FOR THE SELECTION OF COMPATIBLE HAZARD STRONG GROUND MOTION RECORDS There are several approaches for obtaining time-history recordings and using them in the several applications mentioned above. Some of these consist on the selection of real strong ground motion recordings and scaling them to reflect local hazard levels according to the seismic source that is being associated, and others consist on the generation of artificial strong ground motion records that are either compatible with a specific design response spectrum or with a model of the earthquake source. The application in this paper has to do with the first approach, meaning that real recordings will be used in the selection process. For the first case it is necessary to specify an M-R pair, and based on these parameters search in the strong ground motion databases for compatible recordings. The use of real accelerographs has the advantage that they represent real conditions and characteristics of ground motion. When the hazard results come from a probabilistic seismic hazard assessment (PSHA), as it is in this case, the results come from the integration of all possible scenarios; hence, the selection of the appropriate scenarios to estimate earthquake loads in structures or strong ground motion recordings for local site studies is not straightforward. To solve this, different approaches have been proposed and the one selected for this paper is the one known as the hybrid procedure. This procedure dictates that the probabilistic seismic hazard assessment be used for the characterization of strong ground motion exceedance rates, and then, by using a deterministic approach, more detailed characteristics of the hazard such as the time-history recordings can be obtained as an output (NRC, 1988). Several studies have tried to solve the difficulties in the selection of earthquake scenarios after a PSHA has been conducted (McGuire, 1977), (McGuire, Shedlock, 1981), (Ishikawa and Kameda, 1988), (Ishikawa and Kameda, 1991), (Chapman, 1995), (McGuire, 1995); for this application, the latter approach has been selected, in which probabilistic hazard assessment results are used taking into account several seismic sources and different spectral ordinates. By using several seismic sources two alternatives unfold: a first where only one source dominates the hazard at the analysis point, and a second where various sources have an important participation in the final results. For the first case, a single and unique M-R pair is defined, whereas for the second case a separate M-R pair should be defined for each source, creating the case of having different earthquake scenarios. Because of this, the corresponding participation of all the seismic sources in the analysis for the selected return period and spectral ordinates must be calculated, in order to define which of the two cases applies for each of the cities. For this purpose, a return period of 475 years has been selected for all the cases, along with the following spectral ordinates: 0.00, 0.05, 0.10, 0.15, 0.30, 0.50, 1.00, 1.50, 2.00, 3.00 and 4.00 seconds. On the other hand, the selection of the attenuation relationships was done using the results of the National Seismic Hazard Assessment (AIS, 2010b), (Campbell, 1997), (García, 2005). With these parameters the uniform hazard spectrum is constructed for each city and each source, and by taking out the expected acceleration values for the different ordinates and using the attenuation relationships, the values are inverted in order plot them in the M-R space. The range of magnitudes and distances that contain the feasible scenarios are then determined form this plot. Because different frequencies.
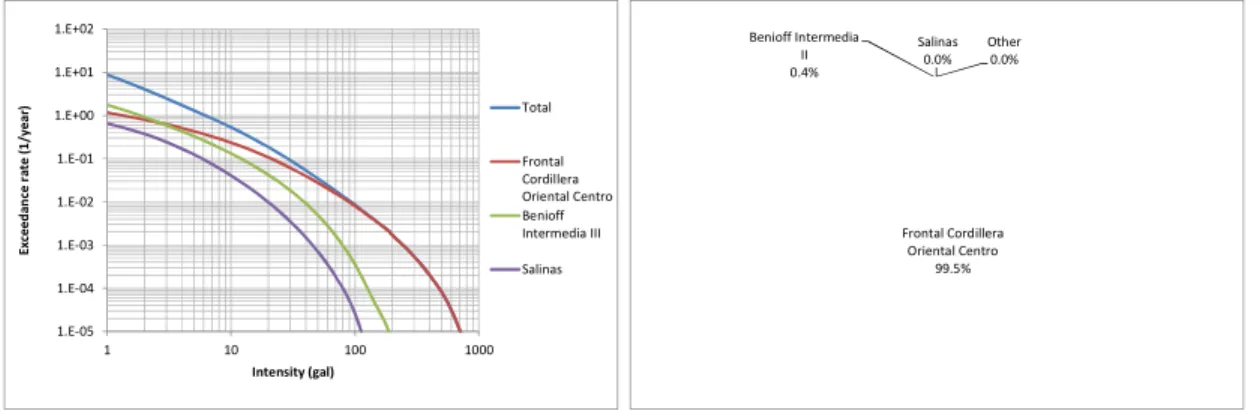
(4) attenuate in a different way, and because parameters such as energy, acceleration response spectra and effective duration vary for different scenarios, the need to obtain a unique set or M-R pairs is the next step. When plotting the different M-R functions for each spectral ordinate, the curves will intersect, in some cases in a single point and in others in a broader area; this represents the specific scenario or range of scenarios for which there exists compatibility in hazard level for the analysis area for the above mentioned relevant parameters. Finally, by searching in global strong ground motion databases (COSMOS, PEER NGA Database, PEER Strong Motion Database), real accelerographs from stations located in rock or stiff soil and having the magnitude and distance that match the defined M-R pair must be selected. This may be a painstaking process given that the chances of finding acceleration time-histories with the exact M-R pair are low; subsequently, it is recommended that a delta be used to widen the search range. The recommended delta values (Bommer, 2010) are 0.2 units in magnitude and 5km in distance, with the additional criterion of trying to find acceleration levels similar to the ones obtained in the hazard assessment. Furthermore, because recordings with similar M-R pairs vary greatly in terms of other parameters, a set of at least three signals (preferably recorded at different stations) must be gathered for each source. Finally, depending on the amplitude values found for each strong ground motion recording, a scaling process takes place. However, a recommended range of 0.5-2.0 (Bommer et al, 2010) has been defined in order to keep the recordings within the realistic range and not lose the approach of using real accelerographs. It is important to notice that the amplification takes place only in the amplitude parameter. The previous process works very well for cases where a single seismic source dominates the hazard for the analysis zone (as it is the case for Bogotá), but for cases where more than one seismic source has a significant participation in the integrated hazard, the results are not so clearly defined. When using the integrated results containing the participation of all the seismic sources at the same time, it was found that the M-R pairs do not correspond to feasible scenarios, either because they were representing extreme magnitudes or distances that do not represent possible earthquake scenarios. Thus, in this case the UHS is calculated using the contribution of separate sources and determining feasible M-R pairs. The definition of the M-R pairs with the explained methodology can be also used to generate acceleration time-history recordings based on a model of earthquake source, but this methodology was not applied in the selection process. 2.1 Results for Bogotá The first step consists in the PSHA and obtaining the results in terms of the intensity exceedance curve for peak ground acceleration, identifying the sources contributing to the hazard for the selected return period. Figure 1 presents this in a graph and pie-chart which illustrate the participation of the seismic sources for this selected return period and spectral ordinate. 1.E+02. Benioff Intermedia II 0.4%. Exceedance rate (1/year). 1.E+01. Salinas 0.0%. Other 0.0%. Total. 1.E+00 1.E-01. Frontal Cordillera Oriental Centro Benioff Intermedia III. 1.E-02 1.E-03. Salinas. Frontal Cordillera Oriental Centro 99.5%. 1.E-04 1.E-05 1. 10. 100. 1000. Intensity (gal). Figure 1. Intensity exceedance curve and participation for PGA and 475 years in Bogotá.
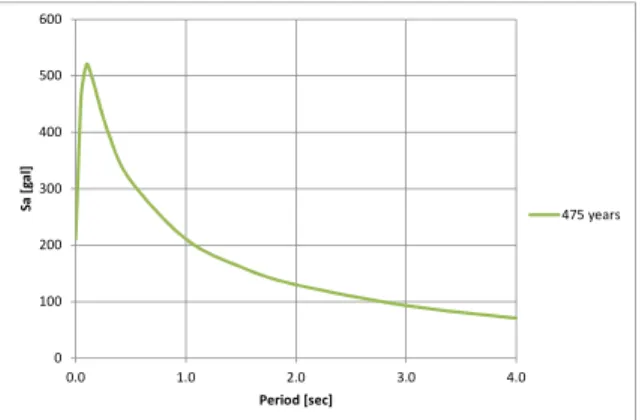
(5) From these results it is clear that for the case of Bogota a single source is dominant over the total hazard for the selected parameters: this source is known as Frontal Cordillera Oriental. Given the large participation of the identified seismic source in the total hazard, it is assumed that the UHS is the same for the integrated hazard as for the independent source. With this taken into account, the UHS for 475 years is calculated for the above mentioned spectral ordinates, as is presented in Figure 2, where the PGA for 475 years is 210.6 cm/s2. 600. 500. Sa [gal]. 400. 300 475 years 200. 100. 0 0.0. 1.0. 2.0. 3.0. 4.0. Period [sec]. Figure 2. Uniform hazard spectrum for 475 years in Bogotá for Frontal Cordillera Oriental. Applying the methodology for the eleven spectral ordinates the results for Bogotá are presented in Figure 3. The intersection and corresponding M-R pair found is 7.1(Mw) – 28(Km). 8.5 8 0.00. Magnitude [Mw]. 7.5. 0.05. 7. 0.1 0.15. 6.5. 0.3 6. 0.5 1. 5.5. 1.5 5 2 4.5. 3 4. 4 0. 10. 20. 30. 40. 50. 60. 70. 80. 90. 100. Distance [Km]. Figure 3. M-R pairs obtained for the Frontal Cordillera Oriental source in Bogotá. After browsing in several databases, the selected acceleration time-histories selected for Bogotá are the one presented in Table 1, including the factors used to scale the signals to the hazard levels expected for the sources. The comparison in terms of the acceleration response spectra between the time-histories, the UHS and the elastic design spectra defined in the National Building Code and the local microzonation of stiff soil is presented in Figure 4..
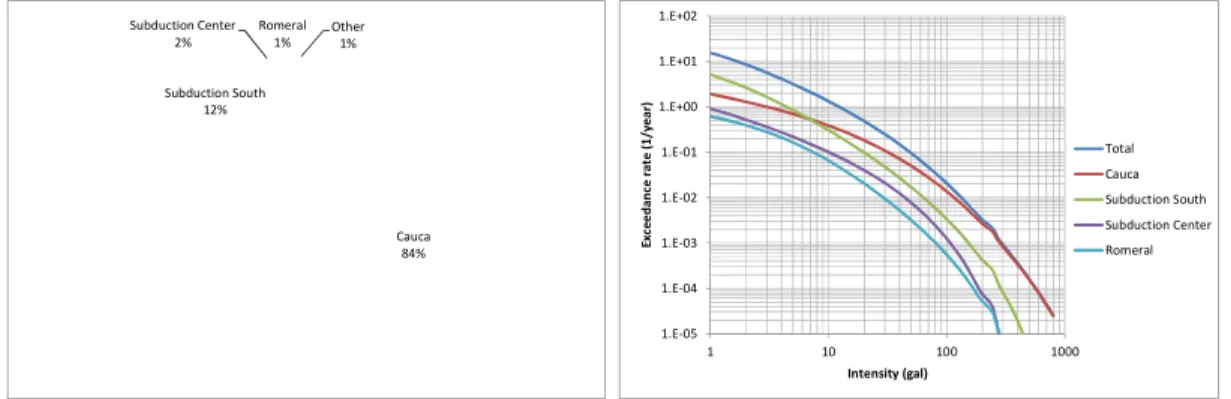
(6) Table 1. Selected acceleration time-histories for Frontal Cordillera Oriental source R PGA Scale Factor Event Station Date Mw Cape CDMG 89324 Rio Dell 24/04/1999 7.01 24.55 0.42 0.51 Mendocino Overpass-FF Dusce, LAMONT 1059 Lamont 12/11/1999 7.14 28.01 0.13 1.65 Turkey 1059 Hector Mine SCSN 99999 Hector 16/10/1999 7.13 30.38 0.31 0.70 CDMG 57563 San JoseLoma Prieta 0.76 18/10/1989 6.93 26.66 0.28 Santa Teresa Hills CDMG 58065 Saratoga18/10/1989 6.93 32.35 0.38 Loma Prieta 0.56 Aloha Ave CDMG 58235 SaratogaLoma Prieta 18/10/1989 6.93 32.2 0.31 0.69 W Valley Coll. Loma Prieta UCSC 15 UCSC 18/10/1989 6.93 24.05 0.34 0.63 1.00. 0.90 CAPEMEND_RIO270 CAPEMEND_RIO360 0.80 DUZCE_375E DUZCE_375N 0.70. HECTOR_HEC000 HECTOR_HEC090 LOMAP_SJTE225. 0.60. Sa (g). LOMAP_SJTE315 LOMAP_STG000. 0.50. LOMAP_STG090 LOMAP_UC2000 0.40 LOMAP_UC2090 LOMAP_WVC000 0.30. LOMAP_WVC270 Frontal UHS 475 NSR-10. 0.20. Microzonation 0.10. 0.00 0.0. 0.5. 1.0. 1.5. 2.0. 2.5. 3.0. 3.5. 4.0. T (seg). Figure 4. Acceleration response spectra comparison for Frontal Cordillera Oriental source. 2.2 Results for Cali Following the same procedure, the results of the PSHA were obtained in terms of the intensity exceedance curve for PGA, and the sources contributing majorly to the hazard were identified. Figure 5 presents this in a graph and pie-chart which illustrate the participation of the seismic sources for this selected return period and spectral ordinate. Subduction Center 2%. Romeral 1%. 1.E+02. Other 1%. Cauca 84%. Exceedance rate (1/year). 1.E+01. Subduction South 12%. 1.E+00 Total. 1.E-01. Cauca 1.E-02. Subduction South Subduction Center. 1.E-03. Romeral. 1.E-04 1.E-05 1. 10. 100. 1000. Intensity (gal). Figure 5. Intensity exceedance curve and participation for PGA and 475 years in Cali. From these results it is clear that for the case of Cali one source has a participation of more than 80% in the total hazard: the Cauca source. However, another seismic source, Subduction South, has a large.
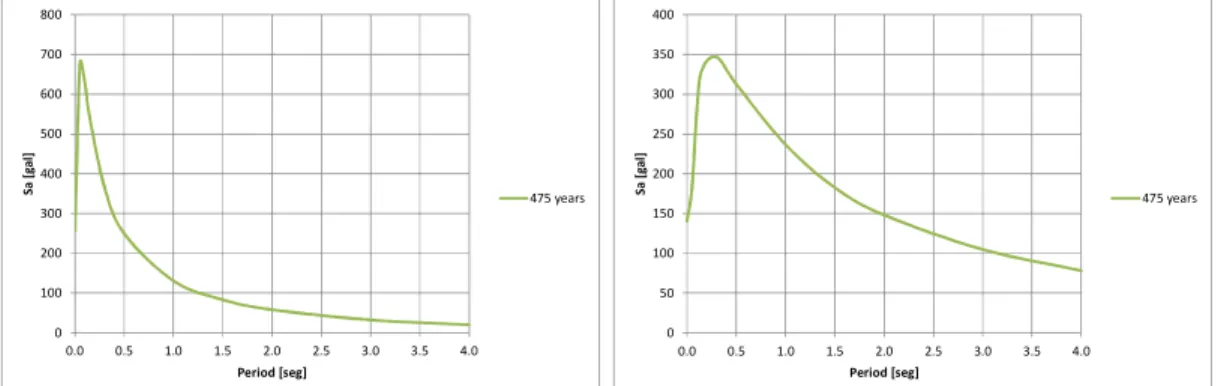
(7) 800. 400. 700. 350. 600. 300. 500. 250. 400 475 years. Sa [gal]. Sa [gal]. potential of producing earthquakes that could greatly affect the city, and so it was also considered in the analysis for the acceleration time-histories selection. The UHS was calculated for each seismic source, giving the following results in terms of PGA for 475 years: 256.6 cm/s2 for Cauca and 140.6 cm/s2 for Subduction South as shown in Figure 6.. 200 475 years. 300. 150. 200. 100. 100. 50. 0. 0 0.0. 0.5. 1.0. 1.5. 2.0. 2.5. 3.0. 3.5. 4.0. 0.0. 0.5. 1.0. 1.5. Period [seg]. 2.0. 2.5. 3.0. 3.5. 4.0. Period [seg]. Figure 6. Uniform hazard spectrum for 475 years for Cali (left: Cauca; right: Subduction South). After applying the methodology for the eleven spectral ordinates, the M-R plots for the separated seismic sources were drawn and the obtained M-R pairs are 5.75(Mw) – 11 (Km) for Cauca and 8.35(Mw) – 120(Km) for Subduction South. Figure 7 shows these results. 8.5. 8.5. 8. 8 0.00. 0.00 7.5. 0.05. 7. 0.1 0.15. 6.5. 0.3 6. 0.5 1. 5.5. Magnitude [Mw]. Magnitude [Mw]. 7.5. 0.05. 7. 0.1 0.15. 6.5. 0.3 6. 0.5 1. 5.5. 1.5 5. 1.5 5. 2 4.5. 3 4. 4 0. 10. 20. 30. 40. 50. 60. 70. 80. 90. 100. 2 4.5. 3 4. 4 0. 50. 100. Distance [Km]. 150. 200. Distance [Km]. Figure 7. M-R pairs obtained for Cauca (left) and Subduction South (right) in Cali. After searching in several databases the selected acceleration time-histories selected for Cali are the ones presented in Table 2 for Cauca and Table 3 for Subduction South. These were scaled to the hazard levels expected for those sources. The comparison in terms of the acceleration response spectra between the time-histories, the UHS and the elastic design spectra defined in the National Building Code is presented in Figure 8. Table 2. Selected acceleration time-histories for Cauca source Event Station Date Mw Mammoth 54301 Mammoth Lakes 25/05/1980 5.7 Lakes H.S Mammoth 54214 Long Valley dam 25/05/1980 5.7 Lakes (Upr L Abut) Mammoth 54214 Long Valley dam 25/05/1980 5.7 Lakes (L Abut) 5169 Westmorland Fire 26/04/1981 5.8 Westmorland Sta 5062 Salton Sea Wildlife 26/04/1981 5.8 Westmorland Ref.. R. PGA. Scale Factor. 14.2 0.44. 0.59. 14.4 0.25. 1.05. 14.4 0.23. 1.14. 13.3. 0.2. 1.31. 10.1. 0.5. 0.52.
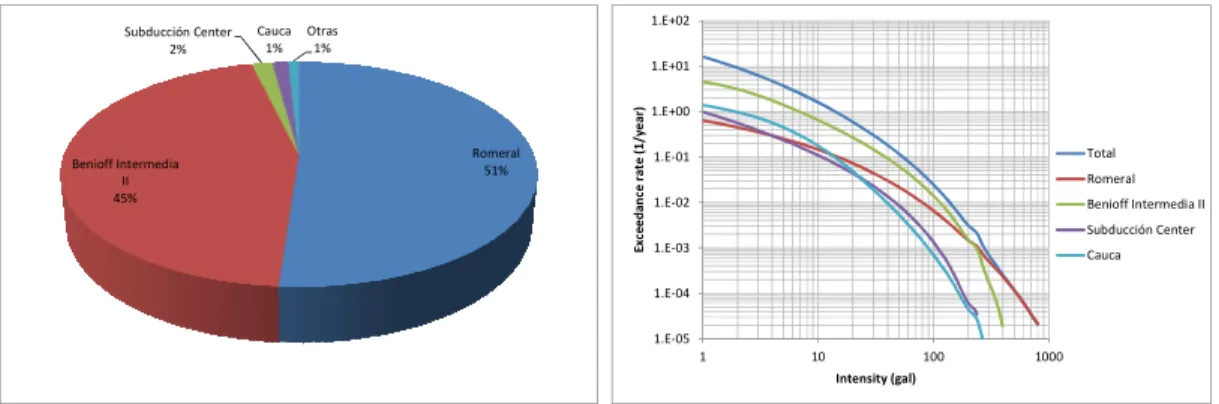
(8) Table 3. Selected acceleration time-histories for Subduction South source Event Station Date Mw R PGA Scale Factor Tokachioki TKCH07 25/09/2003 8 113.9 0.37 0.39 Tokachi0.36 oki TKCH07 25/09/2003 8 113.9 0.40 0.70. 1.20. MAMMOTH_B_LUL_000. 0.60. 1.00 MAMMOTH_B_LUL_090. NSR-10. MAMMOTH_B_LVL_000 0.50. MAMMOTH_B_LVL_090 0.80. MAMMOTH_J_MLS-000. TOKACHI_TKCH07_surf_0. MAMMOTH_J_MLS-270 0.40. WESTMORL_WLF_315. 0.60. Sa (g). Sa (g). WESTMORL_WLF_225. TOKACHI_TKCH07_surf_90. WESTMORL_WSM_090 0.30 WESTMORL_WSM_180 Cauca UHS 475. Subduction south UHS 475. 0.40 NSR-10 0.20. 0.20 0.10. 0.00. 0.00 0.0. 0.5. 1.0. 1.5. 2.0. 2.5. 3.0. 3.5. 0.0. 4.0. 0.5. 1.0. 1.5. T (seg). 2.0. 2.5. 3.0. 3.5. 4.0. T (seg). Figure 8. Acceleration response spectra comparison for Cauca source (left) and Subduction South (right). 2.3 Results for Manizales Following the same procedure, the results of the PSHA were obtained in terms of the intensity exceedance curve for PGA, and the sources contributing majorly to the hazard were identified. Figure 9 presents this in a graph and pie-chart which illustrate the participation of the seismic sources for this selected return period and spectral ordinate. Subducción Center 2%. Cauca 1%. 1.E+02. Otras 1%. Benioff Intermedia II 45%. Romeral 51%. Exceedance rate (1/year). 1.E+01 1.E+00 Total. 1.E-01. Romeral 1.E-02. Benioff Intermedia II Subducción Center. 1.E-03. Cauca. 1.E-04 1.E-05 1. 10. 100. 1000. Intensity (gal). Figure 9. Intensity exceedance curve and participation for PGA and 475 years in Manizales. From these results it can be concluded that in the case of Manizales two sources, Benioff Intermediate II and Romeral, control the seismic hazard and they contribute almost equally. The UHS was calculated for each seismic source from which the following results were obtained in terms of PGA for 475 years: 224.7 cm/s2 for Benioff Internediate II and 194.9 cm/s2 for Romeral as shown in Figure 10..
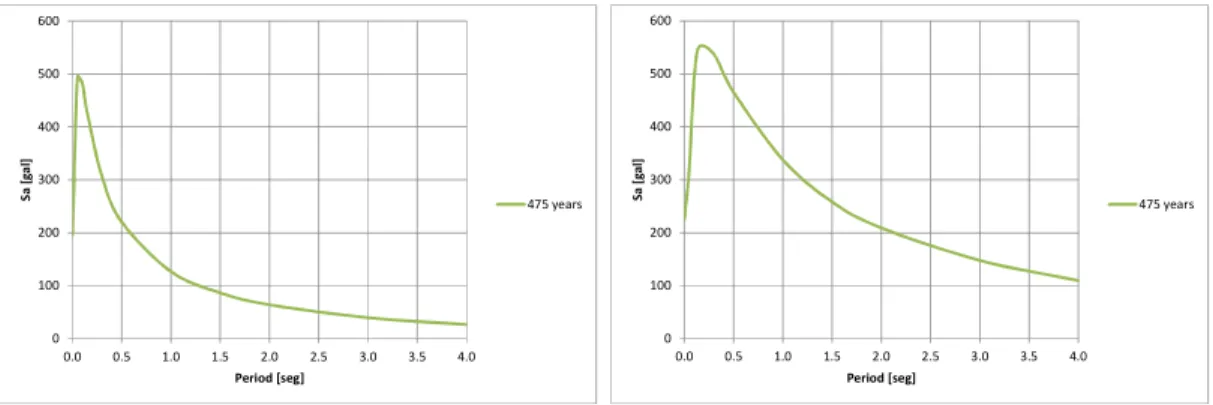
(9) 600. 500. 500. 400. 400. 300 475 years. Sa [gal]. Sa [gal]. 600. 300 475 years. 200. 200. 100. 100. 0. 0 0.0. 0.5. 1.0. 1.5. 2.0. 2.5. 3.0. 3.5. 0.0. 4.0. 0.5. 1.0. Period [seg]. 1.5. 2.0. 2.5. 3.0. 3.5. 4.0. Period [seg]. Figure 10. Uniform hazard spectrum for 475 years for Cali (left: Benioff Intermediate II; right: Romeral). Applying the methodology for the eleven spectral ordinates, the results for Manizales in terms of the separated seismic sources are presented in Figure 11. From this, the M-R pair found is 7.6-46 for Benioff Intermediate II and 6-16 for Romeral. 8.5. 8.5. 8. 8. 0.00. 0.00 7.5. 0.05. 7. 0.1 0.15. 6.5. 0.3 6. 0.5 1. 5.5. Magnitude [Mw]. Magnitude [Mw]. 7.5. 0.05. 7. 0.1 0.15. 6.5. 0.3 6. 0.5 1. 5.5. 1.5 5. 1.5 5. 2 4.5. 3 4. 4 0. 20. 40. 60. Distance [Km]. 80. 100. 2 4.5. 3 4. 4 0. 20. 40. 60. 80. 100. Distance [Km]. Figure 11. M-R pairs obtained for Benioff Intermediate II (left) and Romeral (right) in Manizales. After searching in various databases, the selected acceleration time-histories selected for Manizales are the ones presented in Table 4 for Benioff Intermediate II and Table 5 for Romeral. These were scaled to the hazard levels expected for those sources, and the comparison in terms of the acceleration response spectra between the time-histories, the UHS and the elastic design spectra defined in the National Building Code is presented in Figure 12. Table 4. Selected acceleration time-histories for Benioff Intermediate II source Event Station Date Mw R PGA Scale Factor Kocaeli, ERD 99999 1.64 17/08/1999 7.51 42.92 0.14 Turkey Iznik Chi-Chi, CWB 9999917 1.27 20/09/1999 7.62 38.67 0.18 Taiwan ALS Chi-Chi, CWB 99999 1.53 20/09/1999 7.62 44.69 0.15 Taiwan CHY002 Chi-Chi, CWB 99999 0.65 20/09/1999 7.62 41.26 0.35 Taiwan CHY006 Chi-Chi, CWB 99999 20/09/1999 7.62 42.81 0.14 1.64 Taiwan TCU061 Chi-Chi, CWB 99999 20/09/1999 7.62 42.54 0.12 1.91 Taiwan TCU057.
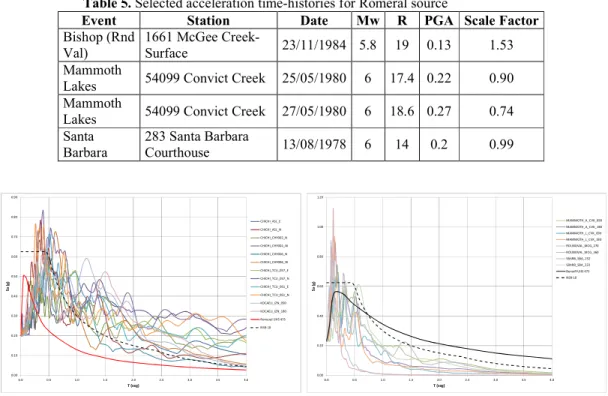
(10) Table 5. Selected acceleration time-histories for Romeral source Event Station Date Mw R PGA Scale Factor Bishop (Rnd 1661 McGee Creek23/11/1984 5.8 19 0.13 1.53 Val) Surface Mammoth 54099 Convict Creek 25/05/1980 6 17.4 0.22 0.90 Lakes Mammoth 54099 Convict Creek 27/05/1980 6 18.6 0.27 0.74 Lakes Santa 283 Santa Barbara 13/08/1978 6 14 0.2 0.99 Barbara Courthouse. 0.90. 1.20. 0.80 MAMMOTH_A_CVK_090. CHICHI_ASL_E 1.00. CHICHI_ASL_N. MAMMOTH_A_CVK_180 MAMMOTH_L_CVK_090. 0.70. CHICHI_CHY002_N. MAMMOTH_L_CVK_180. CHICHI_CHY002_W. ROUNDVAL_MCG_270 ROUNDVAL_MCG_360. CHICHI_CHY006_N. 0.60. 0.80. SBARB_SBA_132. CHICHI_CHY006_W. SBARB_SBA_222. CHICHI_TCU_057_E 0.50. Benioff UHS 475 NSR-10. CHICHI_TCU_061_E. Sa (g). Sa (g). CHICHI_TCU_057_N 0.60. CHICHI_TCU_061_N. 0.40. KOCAELI_IZN_090 KOCAELI_IZN_180 0.30. 0.40 Romeral UHS 475 NSR-10. 0.20 0.20 0.10. 0.00. 0.00 0.0. 0.5. 1.0. 1.5. 2.0. 2.5. 3.0. 3.5. T (seg). 4.0. 0.0. 0.5. 1.0. 1.5. 2.0. 2.5. 3.0. 3.5. 4.0. T (seg). Figure 12. Acceleration response spectra comparison for Benioff Intermediate II (left) and Romeral (right). 3. Conclusions and Recommendations After comparing the results with the UHS and the elastic acceleration design spectra for these three cities and all the considered seismic sources, it can be concluded that this approach provides enough information for the selection of appropriate acceleration time-histories consistent with the local hazard. The selected signals for the three cities accurately represent feasible earthquake scenarios in terms of amplitude and frequency content. It is possible to characterize the seismic hazard in terms of acceleration time-histories, but it is also clear that depending on the number of seismic sources contributing to the hazard in the analysis area, several M-R pairs can be found. For the case of the Subduction South source in Cali, several real recordings matched the M-R pairs for that source but needed to be scaled with values outside the defined range; thus, they do not necessarily represent real conditions. Because of this, only two recordings were found to match the M-R pair and they correspond to the same event, which is still not enough to represent the hazard level. However, the overall results from the comparison between the UHS, the elastic design spectra and the acceleration spectra of the scaled time-histories, show that the selected recordings are good representations of feasible scenarios in terms of amplitude and frequency content. Consequently, it is recommended that the acceleration time-histories presented in the Tables above be used for the different earthquake engineering applications in any of these three analyzed cities. REFERENCES Bommer J, Scott S, Sarma S (2010) Hazard-consistent earthquake scenarios. Soil Dynamics and Earthquake Engineering 19:219-31 Campbell K (1997) Empirical Near-Source attenuation relationships for horizontal and vertical components of peak ground acceleration, peak ground velocity and pseudo-absolute acceleration response spectra. Seismological Research Letters, 68:1 154-79.
(11) Chapman MC (1995) A probabilistic approach to ground-motion selection for engineering design. Bulletin of the Seismological Society of America 85:937-42 Colombian Earthquake Seismic Engineering Association (AIS) (2010a). National Building Code. Colombian Earthquake Seismic Engineering Association (AIS) (2010b). General Seismic Hazard Asssessment for Colombia. COSMOS Virtual Data Center. http://db.cosmos-eq.org/scripts/adv_search.plx Garcia et al (2005) Inslab earthquakes of Central Mexico: Peak ground-motion parameters and response spectra. Bulletin of the Seismological Society of America. 95:6 2272-82. Ishiwaya Y, Kameda H (1988) Hazard-consistent magnitude and distance for extended seismic risk analysis. Proceedings Ninth World Conference on Seismic Zonation. Tokyo-Kyoto. Vol. 2, p. 89-94 Ishiwaya Y, Kameda H (1991) Probability-based determination of specific scenario earthquakes. Proceedings Fourth International Conference on Seismic Zonation. Oakland. Vol. 2, p. 3-10 McGuire RK. (1977) Seismic design spectra and mapping procedures using hazard analysis based directly on oscillator response. Earthquake Engineering and Structural Dynamics 5:211-34. McGuire RK. (1995) Probabilistic seismic hazard analysis and design earthquakes: closing the loop. Bulletin of the Seismological Society of America 85:1275-84 McGuire RK, Shedlock KM. (1981) Statistical uncertainties in seismic hazard evaluations in the United States. Bulletin of the Seismological Society of America 71:1287-308 National Research Council (NRC) (1988) Probabilistic seismic hazard analysis. Report of the panel on seismic hazard analysis. National Academy Press. Ordaz M, Aguilar A, Arboleda J (2007) CRISIS, Program for computing seismic hazard. Engineering Insitute, Universidad Nacional Autónoma de México. PEER Ground Motion Database. http://peer.berkeley.edu/peer_ground_motion_database PEER NGA Database. http://peer.berkeley.edu/nga/search.html.
(12)
Figure
+4
Documento similar
In this description iot included differen- ces in activity rates associated to different levels of s t icnption according to education achievements of the labour population
To limit the impact of transport on animal welfare, in an effort to reduce the exposure to hazards and related welfare consequences, it is recommended to consider that: motion
This study is the first step toward establishing the role of certain Mediterranean hedgerows and ground covers in the natural enemies populations associated to organic citrus
The Dwellers in the Garden of Allah 109... The Dwellers in the Garden of Allah
Moreover, strong coupling can also have an influence on the electronic ground state of molecules, in two different ways: by reaching electronic ultra-strong cou- pling,
Previous articles have focused multiples valuation research on the selection of a peer group, establishing that firms in the same industry are expected to have similar
(1) specification of the econometric model of the stochastic frontier, (2) selection of the inputs and outputs to use in the analysis, and (3) a determination about how
A. Shortcircuits and Faults to ground. The most common cause of voltage sags are shortcircuits and faults to ground. These cases lead to the more severe voltage falls and to most
