R E S E A R C H
Open Access
Assessment of the efficiency in trapping North
American mink (
Neovison vison
) for population
control in Patagonia
Gonzalo Medina-Vogel
1*, Macarena Barros
1, Rene Monsalve
1and Daniel J Pons
2Abstract
Background:Introduced species can have a major negative impact on biodiversity; an example is the American mink, which was introduced in the 1930s in Patagonia. While there is a consensus that reversing alien mustelids continental scale invasions remains unfeasible, there is little consensus, given a maximum cost or investment, on the feasibility and efficiency of region-wide control or eradication. Thus, our goal was to provide information about efficiency for mink control in Patagonia.
Methods:Between January 2009 and February 2013 this study was conducted in ten study sites (4 km to 15 km long) between 39°S to 45°S latitude. Minks were trapped using cage traps operated by two trappers. We estimated the population density at each study site assuming they were close populations, exhibit intrasexual territoriality and the home range of females were smaller than those of males. We obtained a theoretical population and a modeled population from our trapping results. Sixty five minks were trapped over 2190 trap nights (0.03 mink/trap night). Mink captures were higher in the first six days and in the first trapping campaigns. A two person team was able to control a maximum distance of approximately 6 km of river shore by foot and 15 km of sea and lake shores by boat. There was an over linear increase of operational costs as time passed. Our modeled population was 91% of the theoretical population.
Conclusions:We believe that to trap and remove a minimum of 70% of the mink population in a region under ideal circumstances, traps should be deployed every 200 m and after the sixth day should be moved to another new transect. We suggest an annual repetition of this strategy as the more efficient for controlling mink
populations in terms of trapping success and reduced costs. The number of traps will depend on the number of trappers participating and also on habitat characteristics.
Keywords:American mink; Trapping efficiency; Control; Population modeling
Background
It has been recognized that introduced species can have a major negative impact on biodiversity; apart from the loss of habitat, the introduction of exotic species is con-sidered to be the second widest global threat to biodiver-sity and an important element in the health of wildlife (Macdonald and Thom 2001; Medina-Vogel 2010). In-troduced vertebrate predators are increasingly common and often unwelcomed, as they can have a significant negative effect on native species (Mack et al. 2000). This
is the case of the North American mink (Neovison vison): it was transported to many countries, far outside its native range of North America in the 1920s (Medina 1997; Previtali et al. 1998; Ferreras and Macdonald 1999; Macdonald et al. 2002; Macdonald and Harrington 2003) and is now established as an invasive species in South America, Europe, Russia, and Asia (Dunstone 1993). The species popularity as a furbearer meant that it was transported to many countries to fur farms. It reached Chile in the 1930s, and through accidental escapes and deliberate releases, it became established in the wild by the 1960s (Medina 1997; Pagnoni et al. 1986; Previtlli et al. 1998; Jaksic et al. 2002; Iriarte et al. 2005; Fasola et al. 2009; Fasola et al. 2011), and now, it is * Correspondence:[email protected]
1
Facultad de Ecología y Recursos Naturales, Universidad Andrés Bello, República 252, Santiago 8320000, Chile
Full list of author information is available at the end of the article
widespread in a large part of the south of Chile and Argentina (Medina 1997; Iriarte et al. 2005; Faseola et al. 2009; Fasola et al. 2011). Since then, the species’ ‘feral’ status has been considered as a problem to the preserva-tion of native wildlife in Chile (Iriarte et al. 2005). In fact, mink is implicated in a myriad of conservation is-sues for birds and small mammals in Argentina and Chile and occurs in both freshwater and marine habitats (Medina 1997; Fasola et al. 2009; Medina-Vogel et al. 2013). The spread of invasive North American mink in Patagonia with its devastating impact on native biodiver-sity has produced a growing realization of the need of an active management to minimize such impacts (Rozzi and Sherriffs 2003; Davis et al. 2012). Eradication of ver-tebrate aliens in mainland has been successful in a few instances when control actions were taken early (e,g., Coypu in Britain) (Gosling and Baker 1989). Despite an improving success rate and greater boldness with era-dications of invasive vertebrates from islands, most mainland areas remain badly affected. While there is a consensus that reversing continental scale invasions re-mains unfeasible, there is little consensus on the feasibil-ity and efficiency of region-wide control (Bryce et al. 2011). In fact, eradicating carnivores, especially muste-lids, remains particularly challenging, both in continental and insular territories, because of often low and hetero-geneous trappability, difficulties in detecting low num-bers, and high mobility (Craik 2008; Harrington et al. 2008; King et al. 2009). Nevertheless, where possible, eradication should be at least considered (Rainbolt and Coblentz 1997; Moore et al. 2003; Zabala et al. 2010). However, experience has shown that the success of such effort ranges from satisfactory to disappointing (Mack et al. 2000). Therefore, before undertaking such a cam-paign, a preliminary assessment of the likelihood of suc-cess and careful planning are vitally important. More precisely, methods relevant to define objectives and as-sessment results are badly needed in control, contain-ment, and eradication campaigns. Indeed, economic and outcome assessment of management alternatives can help in the proper planning of control/eradication cam-paigns and in the efficient use of scarce resources (Zabala et al. 2010). In addition, the capability to esti-mate total budget can move politicians and managers to make a commitment for ambitious management pro-grams, or even eradication. Frameworks to estimate the costs of control/eradication operations allow campaigns to be developed based on a management goal and not on an arbitrary budget (Zabala et al. 2010). Moreover, managers usually have lack of information on how to set management goals and design/control eradication cam-paigns. Both control campaigns (which reduces the pres-ence of invaders) and containment (which limits further spread) require indefinite investment of time, tools, and
costs in terms of animal welfare, human effort, and funding to keep an invader at bay (Zavaleta et al. 2001; Moore et al. 2003; Parkes and Panetta 2009). In addition, trap models and sets, baits and lures, trappers’experience, weather, and habitat and biological variables affect trap ef-ficiency (Proulx 2012). In particular, mustelids are evasive and mostly nocturnal, hence their numbers are difficult to estimate; also, worldwide experience suggests that it is al-most impossible to trap every mink (Zuberogoitia et al. 2010). As a consequence, research on effectiveness of mink control or eradication campaign in Patagonia and on efficiency rates of different approaches is needed. There-fore, the goal of this study was to provide information about trapping efficiency and costs as a point of departure for mink eradication and control in Patagonia based on real field data and population models.
Methods Study area
Between January 2009 and February 2013, this study was conducted in southern Chile between 39° S to 45° S lati-tude. Ten study sites from 4 to 15 km long were selected based on independence: separated either by a geographical barrier or by more than 8 km following seashore (Figure 1, Table 1). Cisnes River and Magdalena Fiord were visited two and three consecutive years, respectively. All sites are in a region characterized by a temperate-humid-cool cli-mate with 2,000 to 3,000 mm of rain a year and an average humidity around 90%. Rivers, lakes, and marine coastal vegetation is characterized by a forest type known as Val-divian rainforest and Norpatagonicus ValVal-divian rainforest, with abundant vegetation dominated by trees species such as Drimys winteri, Podocarpus salignus, Nothofagus dom-beyi,Nothofagus nitida,Nothofagus betuloides,
Pilgeroden-dron uviferum, Luma apiculata, Amomyrtus luma and
Laureliopsis philippiana.The average annual temperature is below 10°C (Veblen and Schlegel 1982; Toledo and Zapater 1989). River geomorphology was classified accord-ing to Montogomery and Buffaccord-ington (1998) and seashore geomorphology according to Medina-Vogel et al. (2013).
Trapping
Alien North American minks were trapped using 8 to 30 traps operated by two trappers. Depending on the study site characteristics and the existence of mink field signs such as scats and footprints, traps were set more or less regularly spaced (400 to 500 m). Thus, during each trap checking, we also surveyed the covered section for any mink field signs, either from minks attracted by the bait, or from those walking along the riverbank. The lineal sections covered by traps/day following the shore con-tour were between 4 and 15 km (Table 1). Animals were caught in cage traps with double entrance (81 cm long, 21 cm high, and 23.5 cm wide), baited with can fish
(Davis et al. 2012). Traps were deployed along main river stretches as well as along lakes shores and seashores. All traps were checked twice a day. Depending on the study site, due to logistical constrains, it took between 3 and 9 days to deploy all traps, and each trapping campaign was between 4 to 23 days long and ended after 4 consecutive days without any mink trapped and no field signs found, or when some traps were stolen. Previous studies showed the strong preference of minks on marking under dense vegetation, steep river banks, behind rocks and under roots, in narrow passages, and in major intensity in shallow seashores (Medina 1997; Medina-Vogel et al. 2013). Hence, cage traps were set close or inside these features and nor-mally a couple of meters away from the water. In case that no signs were found, traps were placed close to these fea-tures and no further than 500 m from contiguous ones. Trapped minks were euthanized with Tiopental® (Biosano S.A, Santiago, Chile). All animal trapping and handling were performed according with ethical protocols of the Committee of Ethic of the Universidad Andrés Bello and the National Commission for Science and Technology.
Capture rates and population estimates
North American mink once established in a territory maintain linear home ranges between 1 and 16 km of river
length (Dunstone 1993; Yamaguchi et al. 2003; Zabala et al. 2007a), although commonly home ranges are smaller than 3 km long (Melero et al. 2008). Female home ranges are smaller than those of males. Indeed, Melero et al. (2008) recorded average linear home range 1.19 ± 0.73 km (±SD) of ten males and 0.54 ± 0.14 km (±SD) for five fe-males in a river habitat of Catalonia, Spain. Birks and Linn (1982) found a mean home range of 4.5 km for males and 2.85 km for females in the UK; Gerell (1970) found 2.13 km for males and 1.85 km for females in Sweden; Zabala et al. (2007b) register a mean home range length of 7.1 km for males and 4.9 km for females also in Spain; and Yamaguchi et al. (2003) recorded a mean of 6.8 km for males and 2.7 km for females in the UK. In its original environment, home ranges are bigger showing a mean of 11.08 km for males and 5.63 km for females (Stevens et al. 1997). In marine habitat, Niemimaa (1995) recorded an adult male home range of 5.35 km long and using an area of 22 ha and that of a female of 4.2 km long and 17 ha. A previous radio-tracking study between 2010 and 2012 in two of our study sites (Magdalena Fiord and Cisnes River) recorded for a female mink living in the marine study site a home range of 1,769 m long while a male a home range of 2,069 m long (Magdalena Fiord). Home ranges of five male mink living in Cisnes River recorded an average of
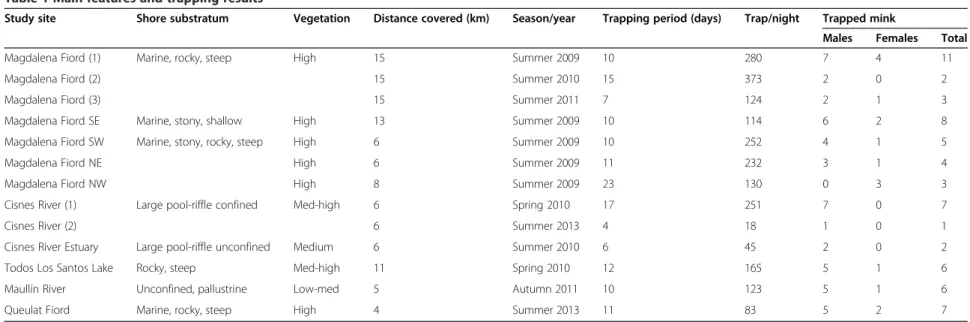
Table 1 Main features and trapping results
Study site Shore substratum Vegetation Distance covered (km) Season/year Trapping period (days) Trap/night Trapped mink
Males Females Total
Magdalena Fiord (1) Marine, rocky, steep High 15 Summer 2009 10 280 7 4 11
Magdalena Fiord (2) 15 Summer 2010 15 373 2 0 2
Magdalena Fiord (3) 15 Summer 2011 7 124 2 1 3
Magdalena Fiord SE Marine, stony, shallow High 13 Summer 2009 10 114 6 2 8
Magdalena Fiord SW Marine, stony, rocky, steep High 6 Summer 2009 10 252 4 1 5
Magdalena Fiord NE High 6 Summer 2009 11 232 3 1 4
Magdalena Fiord NW High 8 Summer 2009 23 130 0 3 3
Cisnes River (1) Large pool-riffle confined Med-high 6 Spring 2010 17 251 7 0 7
Cisnes River (2) 6 Summer 2013 4 18 1 0 1
Cisnes River Estuary Large pool-riffle unconfined Medium 6 Summer 2010 6 45 2 0 2
Todos Los Santos Lake Rocky, steep Med-high 11 Spring 2010 12 165 5 1 6
Maullín River Unconfined, pallustrine Low-med 5 Autumn 2011 10 123 5 1 6
Queulat Fiord Marine, rocky, steep High 4 Summer 2013 11 83 5 2 7
Main results of ten study sites along the river, lake, and Aysén districts of South Chile, and trapping results. 1, 2, 3, correlative number of the consecutive visits.
Medina-Voge
l
et
al.
Revista
Chilena
de
Historia
Natural
(2015) 88:9
Page
4
of
2,213 m long, ranging between 1,422 and 3,834 m (Medina-Vogel non-published data). Due to previous facts and considering extra reference material (Buskirk and Lindstedt 1989; Gehrt and Fritzell 1996; Yamaguchi et al. 2003; Zabala et al. 2010; Zuberogoitia et al. 2010), we esti-mated an initial population density at each study site in an optimistic scenario assuming: a) a closed population over a longitudinal stretch (meters) of river or seashore, and not on an area (square meters) during each short period of trapping time (4 to 23 days); b) minks in all study sites showed intrasexual territoriality; and c) the home range of females is smaller than those of males. Hence, we have a population density (named theoretical population) at the beginning of each trapping campaign at each marine study site given by [1 × 2 km (males) + 1.5 × 2 km (females)]; at each freshwater habitat study site by [1 × 3 km (males) + 1.5 × 3 km (females)], this gives 1.25 mink/km at marine habitat and 0.83 mink/km at rivers and lakes habitats (Table 2). Smal (1991) recorded 1.4 individuals km−1with a peak density of 2.3 individuals km−1 in river and lake shore in Ireland; Harrington and Macdonald (2008) found that mink share their home ranges with 0.3 to 1.17 other minks (of both sexes) in lowlands in the United Kingdom.
Efficiency rates and estimation of the proportion of population removed
According to Williams et al. (2002, section 14.4), effi-ciency rates of a trapping strategy or technique during periodtare given by the ratio:
Y tð Þ ¼ n tð Þ=f tð Þ;
wheren(t) is the number of individuals (minks) captured during period t and f(t) are the units of effort during such a period. Reasonable measures of effort are the number of traps/night and the associated economic costs in a period of time. Given a location and trapping technique to obtain estimates of efficiency and of the initial number of minks in the trapping location, we as-sume that the capture of animals is a Poisson sampling process (see Williams et al. 2002, section 14.4); there-fore, the probability of capturing a given animal during periodtis given by:
p tð Þ ¼ 1−exp½−kf tð Þ;
where k is the capture rate of minks per unit of effort. Observe that for a givenkbigger than zero, whenf(t) in-creases, the probabilityp(t) also increases. The numberk was estimated for each location making use of the number n(t) of minks captured in day numbert, and the units of effortf(t) expended during the day numbert, that we mea-sured by the number of traps used during each day. Here, ttakes values in {1, 2,…,T}, whereT is the total number of days during which the trapping took place. If N(t)
denotes the number of minks in the location at the begin-ning of periodt, we have thatN(t+ 1) =N(t)-n(t), provided that no births occur in such a period. On the other hand, ifX(t)denotes the total number of minks captured before periodt, namely, if X(t) =n(1) +n(2) +…+n(t-1), so that X(t+ 1) =X(t) +n(t), then N(t) =N(1)-X(t), where N(1) is the number of minks in the location at the beginning of the trapping, a number that will be extrapolated by the models. We denote by F(t) =f(1) +f(2) +…+f(t-1) the total number of units of effort expended before period t, so thatF(t+ 1) =F(t) +f(t). With this notation, we deduce three models to estimate k and population size N(1) at each site.
Model 1: Following the approach of Leslie and Davis (1939) (see Williams et al. 2002), if N(t) =N(1)-X(t) ani-mals are left at the beginning of period t, the expected number of captures during period t, namely, E[n(t)], is given by the relationE[n(t)] =N(t)p(t); therefore,E[n(t)] = [N(1)−X(t)]p(t). If kf(t) is small, we use the classical ap-proximation p(t) = 1-exp[-kf(t)]≈kf(t) then divide both sides of the expression byf(t) to get the linear relation:
E Y t½ ð Þ ¼ −kXð Þ þt kN 1ð ÞbetweenX tð ÞandY tð Þ
Model 2: According to the approach of DeLury (1947) (see Williams et al. 2002), the probability of capturing a given animal during periodtis given by the product [1-p(1)]… [1-p(t-1)]p(t), where [1−p(1)]…[1−p(t−1)] = exp{−k[f(1) +…+f (t−1)]} = exp[−kF(t)] is the probability that the given animal has not been captured in the periods before t. From this perspective, the expected number of captures during period tis given by the relationE[n(t)] =N(1)exp[−kF(t)]p(t). As in model 1, approximatep(t) by kf(t), then divide both sides of the expression byf(t) to get the exponential type relation:
E Y t½ ð Þ ¼ kN 1ð Þexp½−kFð Þt betweenF tð ÞandY tð Þ
Model 3: We equate the expression for E[n(t)] ob-tained in model 1 with that obob-tained in model 2 without the need of using the approximation for p(t), to get the identity:
Nð Þ1 −X tð Þ
½ p tð Þ ¼ Nð Þ1 exp½−kFð Þt p tð Þ:
Simplifying p(t) and rearranging terms, we get the Weibull type relation:
X tð Þ ¼ Nð Þ1 f1‐exp½‐kFð Þt gbetweenF tð ÞandX tð Þ:
Statistical differences between study sites
was described as traps/night in a single day and total effort as the sum of all trap/night during each campaign. Visit was defined as one campaign in a single year. So differ-ences between data from second and third visits were done only within each study site that was visited for more than one consecutive year. Data was registered as frequen-cies and differences assessed by GLM, Bartlett Chi-square tests, and Pearson correlation matrix by SYSTAT (Systat Software, Inc., Point Richmond, CA, USA). Study sites were considered independent between each other due to geographical barriers and distance.
Results Trapping
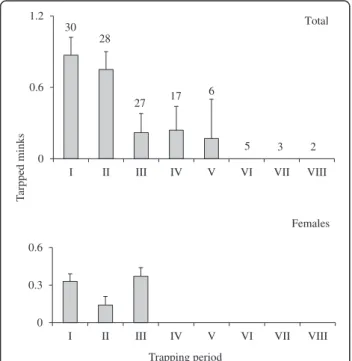
We set a total of 2,190 trap/night, and 65 minks (16 fe-males, 49 males) were trapped (Table 1). Although all study sites recorded a similar behavior in the pattern of mink trapped as day pass (F9-110 = 1.3; P= 0.23) (Figure 2), there was a significant (F2-29 = 4.5;P= 0.02) difference in the pattern and total mink trapped be-tween the first, second, and third campaign (visit) in
the same study site (Figure 3). And there was no differ-ence in the pattern of mink trapped as day passed be-tween marine and freshwater study sites (χ2= 2.1; df = 4;P= 0.7). However, there was a tendency to trap more females in marine habitats than in freshwater habitats (Bartlett chi-square statistic = 3.7; df = 1; P= 0.06); in fact, 63% of them were trapped in marine study sites (Table 1). This tendency was not observed in males (Bartlett chi-square statistic =0.5; df = 1; P= 0.48). There was a significant (F23-96 = 3.6; P< 0.01) differ-ence between effort (trap/night) and trapped minks. However, this difference was not associated with effort (Pearson correlation matrix: 0.17; Bartlett chi-square statistic = 3.2;df= 1;P= 0.07) and negatively correlated with the total effort (days/trap/nigh) (Pearson correl-ation matrix: −0.24; Bartlett chi-square statistic = 6.9; df = 1; P< 0.01). In fact, it was related to the periods (3 days each) where there was a significant (χ2= 17.4; df = 4; P< 0.01) difference between periods, as signifi-cant more minks were trapped in the first two periods (6 days) in relation with the rest (Table 1, Figure 2). As
Table 2 Estimated population according to theory, trapped mink, and effort needed to remove a percent of the total population
Theoretical population
Theoretical female population
Proportion of trapped mink related to theoretical population
Population size Number of trap/night to remove a percent of the estimated mink population
Male Female Total N(1) Proportion ofN(1) from theoretical population
K × 1,000
70 80 90
Magdalena Fiord (1)
18.8 11.3 0.93 0.35 0.58 13.7 0.72 9.4 128.0 171.2 244.8
Magdalena Fiord (2)
18.8 11.3 0.27 0.00 0.11 1.2 0.06 41.0 29.4 39.3 56.2
Magdalena Fiord3
18.8 11.3 —— —— —— —— —— —— —— —— ——
Magdalena Fiord SE
16.3 9.8 0.92 0.20 0.49 13.0 0.80 10.9 110.5 147.7 211.3
Magdalena Fiord SW
7.5 4.5 1.33 0.22 0.67 6.4 0.85 11.0 109.5 146.3 209.3
Magdalena Fiord NE
7.5 4.5 1.00 0.22 0.53 6.6 0.88 6.3 190 254 363.2
Magdalena Fiord NW
10.0 6.0 0.00 0.50 0.30 4.1 0.41 27.1 44.4 53.4 85
Cisnes River (1) 5.0 3.0 0.00 3.50 1.40 7.5 1.50 17.7 68 91 130.1
Cisnes River (2) 5.0 3.0 —— —— —— —— —— —— —— —— ——
Cisnes River Estuary
5.0 3.0 0.00 1.00 0.40 2.7 0.54 33.8 35.6 47.6 68.1
Todos Los Santos Lake
9.1 5.5 1.39 0.18 0.66 6 0.66 54.6 22.5 29.5 42.2
Maullín River 4.2 2.5 2.94 0.40 1.43 6 1.42 24.0 50.2 67.0 114.0
Queulat Fiord 5.0 3.0 2.50 0.67 1.4 6.5 1.30 93.2 12.9 17.3 24.7
Average 1.10 0.72 0.79
1, 2, correlative number of the consecutive visits.
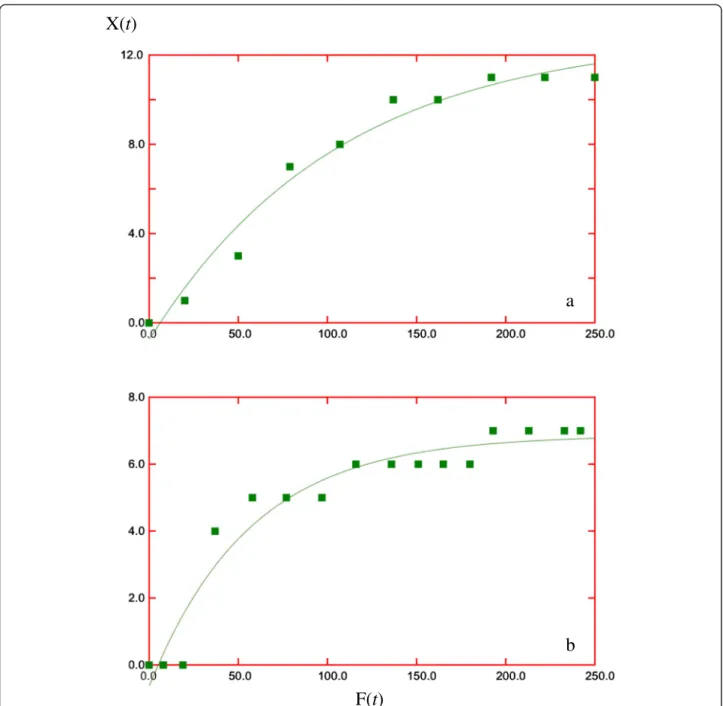
explained below, these patterns are predicted by model 3 in each campaign (see Figures 4 and 5).
Cost evaluation
With a two-person team, we were able to control a maximum distance of approximately 6 km of river shore by foot and a maximum of 15 km of sea and lake shores by boat, twice a day (morning and evening). There was an overlinear increase of operational costs as time passed (Figure 6). These were the added costs of food, baits, housing, or camping rental, petrol, Tiopental® (Biosano S.A, Santiago, Chile) and miscel-laneous. Cost of traps, transport from the university to the campsite, and the salaries of trappers were not considered in the analysis. After the 24th day, the cost of camping went over a million Chilean pesos (ap-proximately US$2,000) (Figure 6). After the 10th day, we had to restock the camps with food and petrol so the cost of transport to the closed town is added (Figure 6).
Efficiency and estimation of the proportion of population removed
If we formally differentiate model 3 related to the discrete time parametert, we recover model 2. However, models 1 and 2 use an approximation forp(t) that might fail if the trapping during periodtis successful. Such an approximation is not used in model 3 due to the
mentioned facts that we will only use model 3, namely, the relation:
X tð Þ ¼ Nð Þ1 f1−exp½−kFð Þt gbetweenF tð ÞandX tð Þ:
Model 3 says that the increments in captures are not linear with respect to increments in traps/night, but have a decreasing performance suggesting that the initial trapping days are the more efficient ones (Figures 4 and 5). We note that this is in agreement with the statistical analysis (Figure 2).
Observe that if F(t) goes to infinity, the model illustrates thatX(t) goes toN(1) provided thatkis bigger than zero, namely, all the minks will be trapped. By economical and practical restrictions, such a scenario is not realistic (see also Zuberogoitia et al. 2010). So assuming that we are in-terested in catching a given fraction of the total popula-tion, say at least the mper cent of the minks in the area and we want to know how many traps should be used. Model 3 illustrates (assuming thatkis known) that the smallest numberF(m) of traps to achieve such a task is obtained from the identity m/100 = {1-exp[-kF(m)]}, from where we get thatF(m) should be at least−ln(1−m/ 100)/k= ln[100/(100−m)]/k. Hence, the bigger k is the smallest of the total number of traps F(m) needed to achieve the task (Table 2).
The sensitivity of F(m) related to the changes in the percentage m of desired trapping can be grasped if we differentiate the relation F(m) = ln{100/(100−m)}/k with respect to m. We obtain the formula dF(m)/dm = 1/{k (100−m)}: this formula illustrates in particular that asm approaches 100, the number of additional traps needed to improve the culling is unfeasible, hence we must re-strict to an ambitious but realistic objective (see also Zuberogoitia et al. 2010). In Table 2, we compute F(m) when m= 70%, 80%, and 90% of the mink populations using the values for k obtained at the suitable sites and years (Table 2) using the Data Analysis Application (iPad) (Figures 4 and 5).
0
Figure 2Pattern of total minks and female minks trapped as day pass.Each trapping period is three days long; numbers above standard error bars indicate sample size (number of analyzed days). No minks were trapped after 15 days of campaign.
0
The other parameter obtained using model 3 and the mentioned application isN(1): the mink population size present at each study site at the beginning of the trap-ping. According to our optimistic theoretical population, there are 1.25 mink/km in marine habitat and 0.83 mink/km in rivers and lakes habitats. Thereafter, to compare our results/data with the estimated theoretical population of minks (Table 2), we calculate the quotient betweenN(1) and such estimate, namely, the proportion
of N(1) in the theoretical population at each site
(Table 2).
Discussion
Non-detection of a wild species can occur for two rea-sons: either the species is truly absent or they are present but not detected (Pollock et al. 2012). In our study, this occurred at the gender rank as we trapped fewer females than males: indeed, in three study sites, we did not trap any female. Significantly more minks per trap night were captured in the first 6 days, and appar-ently, our first campaigns impacted mink populations; as in both study sites where we run consecutive campaigns (separated by geographic barriers), the second and third
F(t)
X(t)
a
b
Figure 4Best values forkandN(1) during first visit.At Magdalena Fiord(a)and Cisnes River(b)according to model 3 using Data Analysis Application for iPad.
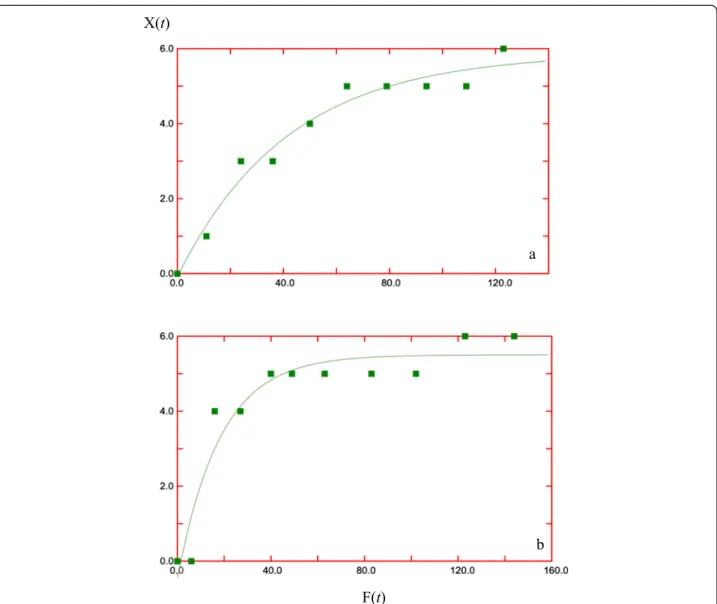
visits resulted in significantly less minks than the first one. We recorded no differences between marine and freshwater habitat. It is worth to mention that Medina-Vogel et al. (2013) recorded a bigger diversity of preys in mink’s diet in marine than in freshwater habitat. More-over, in England, higher densities of mink populations have been recorded in marine habitat and we expected something similar (Table 2). Our results can be justified as minks in our study region (either in marine or fresh-water habitat) predate heavily on terrestrial preys (ro-dents) (Medina 1997; Medina-Vogel et al. 2013). The mink population density in our study sites might in part be the result of the availability of their preferred prey (rodents) and not to the higher diversity of marine preys in comparison to Patagonian freshwater habitats (Smal 1991). In addition, in all study sites with the exception F(t)
X(t)
a
b
Figure 5Best values forkandN(1).At Maullín River(a)and Todos Los Santos Lake(b)according to model 3 using Data Analysis Application for iPad.
0 500 1000 1500 2000 2500
US$
Period
CR
MF
I II III IV V VI VII VIII Average
of two (Cisnes River and Maullin River) Southern river otter (Lontra provocax) has been observed (Medina 1996; Medina 1997; Medina-Vogel et al. 2013). This observation is important: it has been suggested that Southern river otter affects North American mink (Medina-Vogel et al. 2013). In concordance with that, higher values of N(1) were estimated at Cisnes and Maullin rivers where otters have not been observed.
Buskirk and Lindstedt (1989) associated significantly higher trapping and removal of male minks than females due to body and home range size. For example, if traps are located dispersedly over a large area relative to home range size, smaller home ranges may have less trap-pings (a trap-density effect) or maybe no traptrap-pings at all (an exclusion effect) (Buskirk and Lindstedt 1989; Gehrt and Fritzell 1996). If there were differences in the home range size between sexes and in the time needed for a mink to pass close to a trap, then the sex with smaller home range should be caught less often (Gehrt and Fritzell 1996; Zabala et al. 2007a). It has been reported that female minks have smaller home ranges than males (Gerell 1970; Birks and Linn 1982; Stevens et al. 1997; Yamaguchi et al. 2003; Zuberogoitia et al. 2006; Melero et al. 2008). Considering our radio-tracking data of previous studies in two of the study sites (Magdalena Fiord and Cisnes River), where males home ranges were bigger than that of a female, we con-clude that our trap spatial distribution every 400 to 500 m was biased toward males (Gehrt and Fritzell 1996).
Seasonal effects on capture results are not surprising and may reflect differences in habitat, weather, and avail-ability of food or social behavior (Gehrt and Fritzell 1996). In our study sites, seasons, habitat, shore charac-teristics, and vegetation density were similar (Table 1); therefore, we do not think that we suffered any effect from those characteristics. Melero et al. (2008) recom-mended to reduce the distance between traps to 200 m to maximize the number of minks trapped, but they did not mention whether to increase or to reduce the cam-paign duration. These authors, using cage traps slightly smaller than ours and with 588 trap/night, captured 58 minks in 3 years in the same study site (0.1 mink/trap/ night). Instead, Zuberogoitia et al. (2006) by deploying traps every 500 m recorded 0.01 to 0.02 minks/trap/ night. We recorded an average of 0.04 mink/trap/night (0.02 to 0.08).
In our study, mink/trap/night decreased markedly after the second period (6 days) and also trapping success de-creased markedly in the same site after the first campaign (Figures 2 and 3 and Table 1). Zuberogoitia et al. (2010) found that expanding the trapping effort more minks were caught, decreasing the records of mink in the wild after several captures. Also, Bonesi et al. (2007) estimated that it was necessary to trap three continuous months in the
same river basin in order to achieve an effective reduction of mink density. In contrast, our trapping campaigns lasted only 10 to 17 days, and the consecutive campaigns in the same sites (Magdalena Fiord and Cisnes River) trapped significantly less minks.
There are few articles in international journals dealing with research on eradication techniques and also a knowledge gap on how to optimize the efficiency and sustainability of control attempts of invasive species in mainland areas (Donlan et al. 2003; Bryce et al. 2011). From one point of view, the benefits of carrying out eradications on islands derive from the facts that the im-migration of mink from the mainland and hence re-establishment of populations is prevented or restricted (Nordström and Korpimäki 2004). On the other hand, on mainland, river, and stream sites, control or eradica-tion campaigns require a greater effort, and a long-term commitment, mainly because immigration from nearby areas can occur continuously (Siderovich and Polozov 2002). In the absence of barriers to immigration such as in mainland Australia, sustained trapping or iterated baiting campaigns aimed at suppressing (rather than eradicating) invasive red fox and feral cats are under-taken as part of native marsupial conservation efforts (Saunders et al. 2010). In addition to our cases, it was more difficult to move along river shores by foot than at seashores by boat because of vegetation and physical fea-tures. Furthermore, as in our region, in other regions where mustelids and other animals of similar size are sym-patric with mink, live-trapping is more appropriate be-cause it allows the selective removal of mink (Bonesi et al. 2007), making the campaigns longer and more expensive. Hence, whenever management interventions fall short of eradication, they must be sustained in perpetuity with potentially ongoing expenditure owing to recolonization from uncontrolled areas (Bryce et al. 2011). As in other countries, in our case, the budget for invasive species con-trol is scarce: thus, judging the efficiency of the trapping and removal campaigns in different habitats, it is absolutely essential to ensure that scarce funds are efficiently used in order to achieve objectives (Zuberogoitia et al. 2010).
Conclusions
In our study, trapping success was significantly reduced after the sixth day, while the cost of campaigns continues to increase; moreover, the cost to trap one extra mink con-tinued increasing after the sixth day. Furthermore, as de-duced in the section ‘Efficiency and estimation of the proportion of the population removed,’model 3 illustrates that adding more traps to improve the culling is not al-ways convenient: in other words, the more trap you use does not mean that you spend less (Figures 4, 5, and 6). Hence, control campaigns must be restricted to an am-bitious but realistic objective. Taking as examples are
Magdalena Fiord, Todos Los Santos Lake, Cisnes River, and Maullín River. We assumed that we trapped below the theoretical population (0.58, 0.66) in Magdalena Fiord and Todos Los Santos Lake, and above such a population 1.40, 1.43 in Cisnes and Maullín Rivers (Table 2). In all of the abovementioned study sites, we would need less total effort (the sum of all trap/night during all days) to capture between 70% and 90% of the mink estimated population in terms of days, and if traps are deployed every 200 m for each of these study sites in 6 days, the total effort will be 150 (Maullín River), 180 (Cisnes River), 330 (Todos Los Santos Lake), and 450 (Magdalena Fiord), which means far above 90% of the estimation by model 3 (Table 2). Thus, we believe that between the 6th and the 12th day of campaign, the traps should be moved to another new transect no closer than 1 km from the previous one, and so on: we suggest an annual repetition of this strategy as the most efficient to trap and remove minks in terms of trapping success and reduce costs to con-trol mink populations.
We think that model 3 provides a useful tool to analyze the data in trapping campaigns. Indeed, the shape of the curve in the graphF(t) versusX(t) (Figures 4 and 5) is in agreement with all the qualitative conclu-sions from previous works; moreover, the relevant pa-rameters obtained from the data, namely, k and N(1), when used in the expressions derived from model 3, give quantitative estimates of the efforts needed to achieve a desired goal.
Our study did not pretend to assess mink population density neither to develop a methodology for that; our goal was to develop a baseline to cooperate with the dis-cussion and research about efficiency to control or eradi-cate mink from Patagonia, started by Davis et al. (2012), with real field data from a wide study area. Nevertheless, our estimated population size [N(1)] was not to different from the theoretical population: indeed,N(1) recorded an average of 91% of the theoretical population (see Zabala et al. 2010; Zuberogoitia et al. 2010).
Competing interests
The authors declare that they have no competing interests.
Authors’contributions
GMV conceived the study and participated in its design and coordination, participated in the acquisition of data, was involved in the statistical and mathematical analysis, and wrote the main part of the manuscript. MB carried out the acquisition of data and participated in the drafting of the manuscript. RM carried out the acquisition of data. DJP performed the mathematical analysis and wrote some parts of the manuscript. All the authors read and approved the final manuscript.
Acknowledgements
This research was funded by FONDECYT (National Found for Science and Technology) project 1100130. Further data analysis was conducted with resources from project DI 313-13/R of the Universidad Andrés Bello. We are very grateful to Rodolfo Tardones and Sergio Navarrete for field assistance and Drs. John Organ and Stephen DeStefano for comments and English edit-ing to the manuscript.
Author details
1
Facultad de Ecología y Recursos Naturales, Universidad Andrés Bello, República 252, Santiago 8320000, Chile.2Facultad de Ciencias Exactas,
Departamento de Matemáticas, Universidad Andres Bello, República 252, Santiago 8320000, Chile.
Received: 23 January 2015 Accepted: 27 March 2015
References
Bonesi L, Dunstone N, O´Conell M (2000) Winter selection of habitat within intertidal foraging areas by mink (Mustela vison). J Zool 250:419–424 Birks JDS, Linn IJ (1982) Studies of home range of feral mink,Mustela vison.
Sym Zool Soc Lond 49:231–257
Bonesi L, Rushton SP, Macdonald DW (2007) Trapping for mink control and water vole survival: identifying key criteria using spatially explicit individual based model. Biol Conserv 136:636–650
Bryce R, Matthew KO, Llinos D, Gray H, Urquhart J, Lambin X (2011) Turning back the tide of American mink invasion at an unprecedented scale through community participation and adaptive management. Biol Conserv 144:575–583 Buskirk SW, Lindstedt SL (1989) Sex biases in trapped sample of mustelids.
J Mammal 70:88–97
Craik C (2008) Sex ratio in catches of North American mink–how to catch the females. J Nat Conserv 16:56–60
Davis EF, Anderson CB, Valenzuela AEJ, Cabello JL, Soto N (2012) American mink (Neovison vison) trapping in the cape Horn Biosphere Reserve: enhancing current trap systems to control an invasive predator. Ann Zool Fenn 49:18–22 Donlan CJ, Tershy BR, Campbell K, Cruz F (2003) Research for requiems: the need
for more collaborative action in eradication of invasive species. Conserv Biol 17:1850–1851
Dunstone N (1993) The mink. Poyser, London, UK
Fasola L, Chehébar C, Macdonald DW, Porro G, Cassini MH (2009) Do alien North American mink compete for resources with native South American otter in Argentinean Patagonia? J Zoo 277:187–195
Fasola L, Muzio J, Chéhebar C, Cassini M, Macdonald D (2011) Range expansion and prey use of American mink in Argentinean Patagonia: dilemmas for conservation. Eur J Wild Res 57:283–294
Ferreras P, Macdonald D (1999) The impact of American minkMustela visonon water birds in the upper Thames. J App Ecol 36:701–7087
Gehrt SD, Fritzell RK (1996) Sex-biased response of raccoons (Proycon lotor) to live traps. Am Midl Nat 135:23–32
Gerell R (1970) Home range and movements of the minkMustela visonSchreber in southern Sweden. Oikos 21:160–173
Gosling LM, Baker SJ (1989) The eradication of muskrats and coypus from Britain. Biol J Linn Soc 38:39–51
Harrington LA, Macdonald DW (2008) Spatial and temporal relationships between invasive American mink and native European Polecats in Southern United Kingdom. J Mammal 89:991–1000
Harrington LA, Harrington AL, Macdonald DW (2008) Estimating the relative abundance of American minkMustela visonon lowland rivers: evaluation and comparison of two techniques. Eur J Wild Res 54:79–87
Iriarte JA, Lobos GA, Jaksic FM (2005) Invasive vertebrate species in Chile and their control and monitoring by governmental agencies. Rev Chil Hist Nat 78:143–154
Jaksic FM, Iriarte JA, Jimenez JE, Martinez DR (2002) Invaders without frontiers: cross-border invasions of exotic mammals. Biol Invasions 4:157–173 King CM, McDonald RM, Martin RD, Dennis T (2009) Why is eradication of
invasive mustelids so difficult? Biol Conserv 142:806–816
Macdonald DW, Thom MD (2001) Alien carnivores: unwelcome experiments in ecological theory. In: Funk SM, Macdonald DW, Wayne RK (eds) Gittleman JL. Cambridge University Press, Cambridge, UK, Carnivore Conservation Macdonald D, Siderovich VE, Anismova E, Siderovich NV, Johnson P (2002) The
impact of American minkMustela visonand European minkMustela lutreola on water volesAvicola terrestrisin Belarus. Ecography 25:295–302 Macdonald D, Harrington L (2003) The American mink: the triumph and tragedy
of adaptation out of context. New Zeal J Zool 30:421–441
Mack RN, Simberloff D, Lonsdale WM, Evans H, Clout M, Bazzaz FA (2000) Biotic invasions: causes, epidemiology, global consequences, and control. Ecol Appl 10:689–710
Medina G (1997) A comparison of the diet and distribution of Southern river otter (Lutra provocax) and mink (Mustela vison) in southern Chile. J Zool 242:291–297
Medina-Vogel G (2010) Ecología de Enfermedades Infecciosas Emergentes y Conservación de Especies Silvestres. Arch Med Vet 42:11–24
Medina-Vogel G, Barros M, Organ J, Bonesi L (2013) Evidence of competition between the Southern river otter and the alien invasive North American mink in marine habitats of southern Chile. J Zool 290:27–34
Melero Y, Palazón S, Revilla E, Martelo J, Gosálbez J (2008) Space use and habitat preferences of the invasive American mink (Mustela vison) in a Mediterranean area. Eur J Wild Res 54:609–617
Montogomery DR, and Buffington JM (1998) Channel processes, classification and response. In: Naiman RJ, Bilby RE (eds) River ecology and management lessons from the Pacific Coastal Ecoregion. Springer, New York, USA Moore NP, Roy SS, Helyar A (2003) Mink (Mustela vison) eradication to protect
ground-nesting birds in the Western Isles, Scotland, United Kingdom. New Zeal J Zool 30:443–452
Nordstróm M, Korpimäki E (2004) Effects of isolation and feral mink removal on birds communities on small islands in the Baltic Sea. J Anim Ecol 73:424–433 Pagnoni G, Garrido J, Marin M (1986) Impacto económico y ambiental el visón
Mustela vison(Schreber. 1877) en el norte de la Patagonia. CENPAT-CONICET. Dirección de Fauna de la Provincia de Chubut. Informe Técnico
Parkes J, Panetta D (2009) Eradication of invasive species: progress and emerging issues in the 21st century. In: Clout MN, Williams PA (eds) Invasive species management. A handbook of principles and techniques. Oxford University Press, Oxford, UK
Pollock KH, Nichols JD, Karanth KU (2012) Estimating demographic parameters. In: Boitani L, Powell RA (eds) Carnivore ecology and conservation. A Handbook of Techniques. Oxford University Press. New York, USA
Previtali A, Cassini MH, Macdonald D (1998) Habitat use and diet of the American mink (Mustela vison) in Argentinean Patagonia. J Zool 246:482–486 Proulx G, Cattet MRL, Powell RA (2012) Human and efficient capture and
handling methods for carnivores. In: Boitani L, Powell RA (eds) Carnivore ecology and conservation. A handbook of techniques. Oxford University Press, New York, USA
Rainbolt RE, Coblentz BE (1997) A different perspective on eradication of vertebrate pests. Wildlife Soc B 25:189–191
Rozzi R, Sherriffs M (2003) El visón (Mustela vison, Schreber, Carnivora, Mustelidae) un nuevo mamífero exótico para la Isla Navarino. Ana Inst Pat 31:97–104 Saunders GR, Gentle MN, Dickman CR (2010) The impact and management of
foxesVulpes vulpesin Australia. Mammal Rev 40:181–274
Siderovich NV, Polozov A (2002) Partial eradication of the American minkMustela
visonas a way to maintain the declining population of the European mink
Mustela lutreolain a continental area. A case study in the Lovat River head, NE Belarus. Small Carnivore Conserv 26:12–14
Smal CM (1991) Population studies on feral American minkMustela visonin Ireland. J Zool 224:233–249
Stevens RT, Ashwood TL, Sleeman JM (1997) Fall-early winter home ranges, movements, and den use of male mink,Mustela visonin eastern Tennessee. Can Field Nat 111:312–314
Toledo OX, Zapater AE (1989) Geografía General y Regional de Chile. Editorial Universitaria, Santiago de Chile
Veblen TT, Schlegel F (1982) Reseña ecológica de los bosques del sur de Chile. Bosques (Valdivia) 4:73–115
Williams BK, Nichols JD, Conroy MJ (2002) Analysis and management of animal populations, Academic Press, San Diego, California
Yamaguchi N, Rushton S, Macdonald DW (2003) Habitat preferences for feral American mink in the Upper Thames. J Mammal 84:1356–1373
Zabala J, Zuberogotia I, Martínez-Climent JA (2007a) Spacing pattern, intrasexual competition and niche segregation in American mink. Annal Zool Fenn 44:249–258
Zabala J, Zuberogotia I, Martínez-Climent JA (2007b) Winter hábitat preferences of feral American minkMustela visonin Biscay, Northern Iberian Peninsula. Acta Theriol 52:27–36
Zabala J, Zuberogoitia I, González-Oreja JA (2010) Estimating costs and outcomes of invasive American mink (Neovison vison) management in continental areas: a framework for evidence based control and eradication. Biol Inva 12:2999–3012
Zavaleta ES, Hobbs RJ, Mooney HA (2001) Viewing invasive species removal in a whole-ecosystem context. Trends Ecol Evol 16:454–459
Zuberogoitia I, Zabala J, Martínez JA (2006) Evaluation of sign survey and trappability of American mink. Consequences for management. Folia Zool 55(3):257–263
Zuberogoitia I, González-Oreja JA, Zabala J, Rodríguez-Refojos C (2010) Assessing the control/eradication of an invasive species, the American mink, base on field data; how much would cost? Biodiver Conserv 19:1455–1469
Submit your manuscript to a
journal and benefi t from:
7Convenient online submission
7Rigorous peer review
7Immediate publication on acceptance
7Open access: articles freely available online
7High visibility within the fi eld
7Retaining the copyright to your article
Submit your next manuscript at 7 springeropen.com