TítuloEndocannabinoid CB1 receptors modulate visual output from the thalamus
11
0
0
Texto completo
(2) and Nicoll 2001; Diana et al. 2002). CB1 activation can also increase release of glutamate (Ferraro et al. 2001) or ACh (Acquas et al. 2000) in a dose-dependent manner in cerebral cortex and hippocampus. In the visual system, there are well-documented psychotropic effects of Δ9 -tetrahydrocannabinol (THC) which includes a reduction in Vernier and Snellen tests of acuity, and alterations of photosensitivity and color discrimination (Kiplinger et al. 1971; Dawson et al. 1977; Russo et al. 2004). To date, there have been no reported studies on the effects of endocannabinoids on visual processing at the level of the thalamus. The dorsal lateral geniculate nucleus (dLGN) of the rat, as in cat and primate, is a dynamic relay station for visual information traveling from retina to cortex (Reese 1988; Sherman and Guillery 2002). Surprisingly, the primary visual cortex is the major modulatory input to the dLGN in the form of glutamatergic feedback connections from layer VI of the cortex. The dLGN also receives modulatory cholinergic inputs from the parabrachial region of the midbrain and GABAergic modulation from local and thalamic reticular nucleus interneurons (Sherman and Guillery 2002). Thus, the main neurotransmitters implicated in visual processing in dLGN are glutamate, GABA, and ACh that act over metabotropic and/or ionotropic receptors, all of which have previously been associated with endocannabinoid activity in other brain regions (Kim et al. 2002; Maejima et al. 2001; Haller et al. 2007). In the present study, we have recorded the activity of dLGN neurons extracellularly during spontaneous and visually driven conditions, in conjunction with manipulation of CB1 receptors.. Materials and methods Animals and preparation All experiments were carried out in Lister hooded adult rats of either sex weighing between 250 and 350 g. All procedures complied with the ethical use of animals specified in the European Communities Council Directive of November 24, 1986 (86/609/EEC) and Animals (Scientific Procedures) Act 1986, UK Home Office. We adopted previously published methods (Grieve 2005), briefly outlined below, to perform the experiments. Animals were anaesthetized intraperitoneally with a mixture of ketamine+xylazine (50 mg kg−1 +10 mg kg−1 ) for induction and isoflurane in 50%O2:50%N 2 O for surgery and maintenance (1.0– 2.0% surgery, 0.25–1.0% maintenance). To avoid eye movements, animals were paralyzed with gallamine triethiodide (20 mg kg1 ) through the lateral tail vein and artificially respired. ECG, rectal temperature, and end-tidal CO 2 were measured and maintained continuously within normal physiological limits to ensure an appropriate level of anesthesia. Lidocaine gel was applied to pressure points and zero power contact lenses were placed in the eyes to protect the corneas. After each experiment, animals were killed with an anesthetic overdose without recovery from anesthesia. Animals were placed in a customized stereotaxic apparatus such that the head was secured in a horizontal orientation and the entire right visual hemifield was unobstructed. To access the left dLGN, the skull was exposed, a craniotomy was drilled ∼4.5 mm posterior to bregma and 3.5 mm lateral to the midline (Paxinos and Watson 1997), and the dura mater was retracted with a curved needle. Visual stimulation and recording We used tungsten microelectrodes (FHC Inc.), multibarreled glass micropipettes [for iontophoresis; Harvard Apparatus, pulled on a Narishige PE-2electrode puller (Narishige, Japan), broken back under a light microscope to a tip diameter of 3–5 μm] or single-barreled glass micropipettes (for pressure ejection; tip diameter 10 μm) glued under a light microscope to a tungsten microelectrode with dental cement. To locate the dLGN, these were advanced into the brain using a hydraulic microdrive (Narishige) while stimulating the appropriate eye with hand-held stimuli. After reaching the dLGN, cells were first driven qualitatively to localize the receptive field position. Quantitative visual stimuli, consisted on flashing spots and sinusoidal moving gratings, were displayed monocularly and under computer control (Visage; CRS Ltd., UK) on a computer monitor centered in the receptive field and placed either 14 or 28 cm from the eye. Cell type (ON or OFF), receptive field size, and preferred spatial and temporal frequency were determined for each cell. It is important to note that each experimental protocol included both visually driven activity and equal periods of spontaneous activity, randomly interleaved. The extracellular neural signal was continuously monitored on a 310 Tektronix Oscilloscope (Tektronix Holland N.V., The Netherlands) and audio monitor (FHC Inc.), amplified with a high-input impedance amplifier (AM System), voltage window discriminated, and fed into a computer via a digitizer.
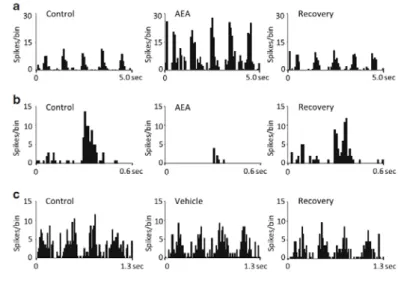
(3) interface (CED 1401 interface and Spike2 software; Cambridge Electronic Design, UK). Online analysis was carried out using custom-written Spike2 routines, and off-line with Spike2, MS Excel, and SPSS (SPSS Inc., Chicago, IL, USA). Drugs Anandamide (AEA, N-(2-hydroxyethyl)-5Z,8Z,11Z,14Z-eicosatetraenamide), 2-AG ((5Z,8Z,11Z,14Z)5,8,11,14- eicosatetraenoic acid, 2-hydroxy-1-(hydroxymethyl) ethyl ester), AM251 (N-(piperidin-1-yl)5-(4-iodophenyl)-1-(2,4dichlorophenyl)-4-methyl-1H-pyrazole-3-carboxamide), and O2545 hydrochloride ((6aR,10aR)-6a,7,10,10a-tetrahydro-3-[5-(1H-imidazol-1-yl)-1, 1-dimethylpentyl]-6,6,9trimethyl-6H-dibenzo[b,d]pyran-1-ol hydrochloride) were obtained from Tocris, UK. AEA, 2-AG, and AM251 were dissolved in 1:1:18 cremophor/ethanol/saline. AEA, 2-AG, and AM251 (each with 0.5 mg/kg) were applied intravenously (Laviolette and Grace 2006; Lin and Lee 2002). AEA (and vehicle alone) was also applied by pressure (2.0 mg/ml, Picospritzer II, Science Products GmbH, 5–10 psi). O2545 hydrochloride was applied iontophoretically (25 mM, pH 3.0 using a Medical Systems Neurophore) using multi-barreled pipettes also filled with 3 M NaCl for recording. Drug application currents were selected on the basis of initial qualitative studies and were applied in a range which did not saturate responses. When not in use, drug barrels were subjected to a retention current of 20 nA of appropriate polarity. Statistics Endocannabinoid-induced changes were measured at the time of maximal change in the firing rate after drug administration and were normalized to the control baseline. Only effects that were statistically significant versus control were considered for the analysis (p<0.05 one-way ANOVA or Friedman’s tests followed by Dunnett’s t test or Wilcoxon’s signed rank test when appropriate). Control values were calculated as the mean firing rate of at least two consecutive assessments before drug administration. Population data were analyzed using one-way ANOVA, Friedman’s test, Student’s t test, Mann– Whitney’s test, or Wilcoxon’s signed rank test when appropriate. When necessary, post hoc comparisons were made. Signal-to-noise ratio In physiology experiments, salience of the stimulus with respect to the background firing (noise) has been considered as a measurement of the signal-tonoise ratio, calculated by dividing the visually evoked response value by the mean spontaneous firing rate for an equivalent time period. Fano factor (FF) We measured trial-by-trial variability by the FF, which is defined as the variance of the spike count divided by the mean. For each cell, we first obtained the response to the different repeated cycles of a grating stimulus and the spike count was the number of spikes elicited by each stimulus cycle. We obtained a value for each cycle of the visual stimulus from which we calculated variance and mean. Samples included similar time Windows in control and drug conditions, in both cases including the whole visual stimulus duration. Fig. 1 PSTHs depicting the opposite effects of CB1 activation by IV administration on the visual responses of two different dLGN cells: a decrease induced by 2-AG and b increase induced by AEA (0.5 mg/kg, p<0.05 vs. control, Wilcoxon’s signed rank test in each case). Visual stimulus was a full field drifting grating with optimal characteristics for each cell: a spatial frequency was 0.01 c/deg and temporal frequency 2 c/s, bin size 50 ms and in b spatial 0.01 c/deg, temporal frequency 1 c/s, and bin size 40 ms. Ten trials in each case. c Averaged effect for AEA and 2-AG on visual response.
(4) Results We successfully recorded the activity of 66 cells in the dLGN of 27 rats while manipulating CB1 receptor activation. Seven cells had inconsistent properties and were considered too variable to include in this study. The remaining sample included 44/59 (75%) ON center cells and 15/59 (25%) OFF center. Moreover, 37/59 (63%) showed a transient response versus 22/59 (37%) of the cells with clear sustained responses. The visual responses of all 59 cells were significantly altered by compounds manipulating CB1 receptors and no cells were unaffected. CB1 receptors modulate visual responses We applied the cannabinoid agonists AEA and 2-AG (n=19 and eight cells, respectively) by intravenous administration, resulting in either significant excitation or inhibition of the visual responses. To illustrate these actions, Fig. 1a shows the response of one dLGN cell to a drifting grating of optimal temporal and spatial frequencies in control (left), 0.5 min after 2-AG injection (center) and recovery (right) after 10 min. During CB1 receptor activation, a significant reduction of 58% is clear (p<0.05 vs. control, Wilcoxon’s signed rank test). Illustrating the opposite effect, Fig. 1b shows a second dLGN cell following AEA injection. In this case, an increase in firing occurred following AEA administration (p<0.05 vs. control, Wilcoxon’s signed rank test). These examples typify the two responses. Figure 1c shows the average effects for AEA (left) and 2-AG (right). In both cases, the most common effect was a decrease in the firing rate; this was observed in 84% of the cells during AEA application (16/19 cells) and in 87% of the cells during 2-AG (7/8 cells). Effects were maximal at 1.2±0.52 min after the injection for AEA and 0.9±0.80 min for 2-AG. Recovery time was on average 3.6±0.55 min for AEA and 5.5±1.64 min for 2AG. Vehicle alone was injected in four cases with no significant effects on neuronal responses (data not shown). Fig. 2 a Responses of an example dLGN neuron to a grating of spatial frequency 0.03 c/deg and temporal 1 c/s in control conditions (left PSTH), during the administration of AEA (center) and during the coadministration of AEA and AM251 (right, 0.5 mg/kg IV, respectively). Bin size 50 ms and ten trials. b Averaged effect of AM251 on AEA actions in cells whose responses were inhibited (n=7) and on cells with responses increased (n=3). c Reversion of 2AG by simultaneous application of AM251. d Effect of AM251 alone on the response of 12 cells. Data expressed as mean±SEM. *p<0.05 vs. control. Friedman’s test followed by Wilcoxon’s signed rank test.
(5) In order to test the selectivity of the observed effect, we injected AEA or 2-AG alone and simultaneously with the selective CB1 receptor antagonist AM251 (n=12 cells). Figure 2a shows the response of a dLGN cell to visual stimulation (left) and how the reduction normally evoked by AEA injection (center) is prevented by AM251 (right), confirming a CB1-mediated action. Summaries of the effect of AM251 on AEA and 2-AG actions are shown in Fig. 2b, c. Interestingly, the administration of the antagonist alone (Fig. 2d) did not significantly affect neuronal response in the cells tested (n=12). Local application of AEA was tested by pressure ejection to ten cells. This significantly reduced visual responses in 8/10 (80%) of cells and increased visual responses in 2/10 (20%). These shifts in response magnitude were qualitatively and quantitatively similar to those seen using IV administration. The vehicle used for AEA solution was applied alone and shown to be without effect (n=2). These effects are illustrated in Fig. 3. Fig. 3 PSTHs depicting the effects of CB1 activation by local pressure ejection of AEA on the visual responses of two different dLGN cells (a, b) and the lack of effect of pressure ejection of the vehicle (c). In (a), the visual stimulus was a full field drifting grating with optimal characteristics; spatial frequency was 0.03 c/deg and temporal frequency 1 c/s, with 70-ms bins. In (b), the visual stimulus was a flashed spot of light (0.3 s duration, switched on 0.2 s after the start of the PSTH), bin size 10 ms. In (c), the visual stimulus was a full field drifting grating with optimal characteristics; spatial frequency was 0.03 c/deg and temporal frequency 3 c/s, with 20-ms bins. Ten trials in each case. We iontophoretically applied the water-soluble synthetic high affinity cannabinoid agonist O2545hydrochloride to 22 cells. This resulted in either enhanced (11/22) or decreased (11/22) visual responses during application. Enhanced responses were on average 63% greater than predrug control levels (p<0.05, Wilcoxon signed rank test), and decreased responses were on average reduced by 33% compared to the controls (p<0.05, Wilcoxon signed rank test). Effects were demonstrable within 1.0±0.3 min of the start of application. This is illustrated in Fig. 4a, b which show the visual response of two dLGN cells to an optimal flashed spot in control conditions, during application of O2545 and recovery after drug application, the upper records showing a 81% increase and the lower a 56% decrease in visual response magnitude. Fig. 4 PSTHs showing the visual responses of two dLGN neurons (a, b) to an optimal flashing spot in control situation (left) during the iontophoretic application of O2545 (center) and after a recovery period (right). The upper example shows a clear response increase and the lower a response decrease. In both cases, bin size was 30 ms and p <0.05, Wilcoxon’s signed rank test. As the effects of the agonists were similar whether given locally or systemically, we have combined the data for an overall analysis. The bar histogram in Fig. 5a compares the average magnitudes of the increases or decreases during systemic and local application for the different groups..
(6) Fig. 5 a The histogram shows the percentage change of the effect with respect to the control values (100%) for IV or local administration of the CB1 agonists (AEA, 2-AG, and O2545, overall n=59). Data are expressed as mean±SEM. b The summary histogram shows the change in visual response resulting from activation of CB1 receptors, as a percentage of the control value, for the whole population of 59 cells. It is clear that there are two distinct populations of cells, separated around zero, i.e., the visual responses of all cells were significantly affected, but were either enhanced (17) or inhibited (42). Cluster analysis (see text) reinforces this conclusion, including all but the extreme right four cells (i.e., 93% of the population) into two clusters. The distribution of the effects on visual responses during agonist application is shown for all cells tested in Fig. 5b. This figure most clearly illustrates the existence of two subpopulations with a null between inhibitory (n=42) and excitatory effects (n=17). This conclusion is further supported by cluster analysis which indicates that two main clusters contain 93.5% of the sample, the first (72%) centered at −41% and the second (21%) centered at +56%. Only the four most extreme positive values were not covered by these clusters. However, although we could clearly identify two populations based upon the polarity of the effect of the drug (increased vs. decreased visual responses), we could find no systematic relationship between this and cell type (on vs. off or sustained vs. transient, see “Discussion”). Relationship between CB1 activation and different visualresponses Given the very clear separation of two response classes shown above, we attempted to dissect out the contribution of CB1 activation to different elements of the visual response, transient vs. sustained; the results were not statistically significant (data not shown). Secondly, we compared responses to static vs. moving visual stimuli (flashed spots vs. drifting gratings). Figure 6 shows the responses of a single dLGN cell to a drifting grating (Fig. 6a) and to a flashing spot (Fig. 6b). In each case, the stimulus was selected (size, spatial frequency, etc.) to produce a maximal response. In this example, there is a clear reduction in the visual responses during CB1 activation for both stimuli (p<0.05 vs. control, Wilcoxon’s signed rank test). The reduction was 52% for the grating and 51% for the spot. For the population, on average (shown in Fig. 6c), the reduction was 40±3.8% for gratings and 38±3.9% for spots, and the increase was 67±11.2% for gratings and 84±26.8% for spots. Again, these differences were not statistically significant (p>0.05, Student’s t test). Relationship between visual responses and spontaneousactivity Above we reported only significant effects seen on visually driven activity, when cells were activated by appropriate visual stimuli. However, in our overall cell population (n=59), the effects of manipulation of CB1 receptor-driven activity were qualitatively similar when measured on visually elicited or spontaneous activity. That is to say, if visual responses were significantly decreased, the spontaneous activity was also significantly decreased, and vice versa. However, the changes in spontaneous activity were significantly greater than effects seen on driven activity, as measured as a percentage of the control levels (Fig. 7a). Cluster analysis (Fig. 7b) revealed similar clustering (inhibited, 42 cells, 72% of the population, centered on −59% and excited, 17 cells centered on +109%) to that obtained using evoked responses (see Fig. 5). These differential effects on spontaneous and visual evoked responses produced a quantitative change in the ratio between signal amplitude and the level of background activity (“signal-tonoise ratio”)—significantly decreased in the case of cells excited by CB1 activation (Fig. 8a, left) and.
(7) Fig. 6 a Response of a dLGN neuron (ON center) to a grating of optimal characteristics, spatial frequency 0.01 c/deg, temporal frequency 1 c/s in control situation (left), and during iontophoretic application of O2545 (right). b Response of the same neuron as in (a) to a 20° diameter spot, also in the control situation (left) and during iontophoretic application of O2545 (right). p<0.05 vs. control, Wilcoxon’s signed rank test. c Effect of the CB1 agonists tested (AEA, 2-AG, and O2545) during the presentation of spots or gratings of optimal characteristics. Data expressed as mean±SEM. increased in cells inhibited (Fig. 8b, left). Results of the Fano analysis (which measures “noise” within the visual response) are shown in the right sides of Fig. 8a, b and show significant increases in “within stimulus noise” for cells which showing decreased signal-to-noise during drug action, and the reverse on cells which showed signal-to-noise increases. However, we were most interested to find that spontaneous activity is correlated with the effect of CB1 activation such that the spontaneous activity of cells inhibited by CB1 activation was significantly higher (9±1.2 spikes/s, n=42) than cells excited by CB1 activation (4.27±1.07 spikes/s, n=17; p<0.05, Mann–Whitney test) (Fig. 8c). This finding “binds together” many of the observations reported above. Fig. 7 a Bar histogram showing the different effects of CB1 activation on the visual responses versus spontaneous activity. Data are expressed as the mean±SEM (significantly different, p<0.05, one-way ANOVA followed by Bonferroni’s test). b The summary histogram shows the change in spontaneous activity resulting from activation of CB1 receptors, as a percentage of the control value, for the whole population of 59 cells. Again, the presence of two populations is clear.
(8) Discussion It is clear that cannabis use can be associated with some visual abnormalities (Kiplinger et al. 1971; Dawson et al. 1977; Russo et al. 2004). Less clear, however, is the mechanism by which the exogenous cannabinoids might affect visual function at a cellular level, specifically considering the early visual pathways. Our data clearly show that exogenous applications of drugs known to activate the endocannabinoid receptor CB1 have significant effects on the visual responsiveness of cells in the rodent dLGN. The data show a clear division in our population with a significant majority of cells showing decreased visual responses, increased signal-to-noise and decreased response variability, and the second lesser population showing the opposite. Our approach has been to use several different compounds, known to act as agonists at the CB1 receptor, given by several different routes, which together show significant effects on all the dLGN cells tested and confirm that these effects are generated locally within the dLGN and, by the use of the antagonist, are specific to CB1. Although the dorsal thalamus, including the dLGN, shows a low density of CB1 receptors (Herkenham et al. 1991; Pettit et al. 1998; Moldrich and Wenger 2000), Felder et al. (1996) showed high levels of anandamide (AEA) in the thalamus. This result is supported by high levels of fatty acid amide hydrolase, the degradative enzyme for AEA, in the thalamus (Thomas et al. 1997; Egertová et al. 1998). Furthermore, it has been shown that the thalamus, despite the moderate expression of CB1 receptors, has a high receptor/G-protein amplification ratio (Breivogel et al. 1997). The actual effects we have shown are clearly divided into excitation and inhibition (17/59 and 42/59 cells, respectively), with our sample showing significant changes in both spontaneous and visually elicited activity. In all cases, these changes were of the same polarity for both spontaneous and visually driven spiking. Such a clear division of effects begs the question of what other factor or factors might covary with the CB1-mediated effects. For example, cells in the rat dLGN can be subdivided along several lines—physiologically, for example, into Y-like and W-like populations (Hale et al. 1979; Reese 1988), sustained and transient, or even anatomically/chemically into excitatory (relay) or inhibitory cell types. Inhibitory interneurons are local GABAergic cells and are ∼20% of dLGN cells (Gabbott et al. 1986) which can be further differentiated into at least two populations by co-localization of nitric oxide synthase (Gabbott and Bacon 1994). While it would be interesting if CB1-mediated effects were different on relay versus inhibitory cells, our data do not answer this question. We can say that the full range of visual response types was found in both groups. Further, we did not find any cells in which CB1 induced inhibition changed to excitation during our recording periods and also that both response types were seen in the same animals and within the same penetrations, thereby supporting the view that these are truly separate cell groups. We also attempted to engage different circuit elements within the visual pathway. Thus, we compared responses to two different visual stimulus paradigms while modulating CB1 activity. Flashing visual stimulation clearly activates retinal input to the thalamus—but while clearly also activating retinal input, drifting, oriented grating stimuli are considered to be more powerful activators of corticofugal input to the dLGN (Cudeiro and Sillito 2006). Thus, we attempted to activate selectively the sub-families of glutamate receptors associated with retinogeniculate and corticogeniculate afferents (Godwin et al 1996). However, as clearly illustrated in Fig. 6, we could find no significant differences between spot and grating responses both including excitation and inhibition, and being equally affected. However, our data do support some interesting positive results: our populations of cell excited and cells inhibited by CB1 activation are separable if we consider two related elements. At a very simple level, cells which were inhibited by CB1 activation had significantly higher spontaneous firing levels than cells excited. This immediately suggests some form of gain control, but is even more interesting when we compared the magnitude of the drug-induced changes in spontaneous activity with the magnitude of change in visual responses, on a cell-by-cell basis. A very clear shift in the signal-to-noise ratio shows that when CB1 activation decreased the spontaneous activity, the signal-to-noise ratio was significantly increased. That is to say, the visual message given from thalamus to cortex is “cleaned” or “boosted”. Furthermore, the decrease in the FF in these cells (a decrease in variability during the visual response) would support this idea. Our population of cells excited by CB1 activation showed opposite characteristics. However, we are at this point unable to say what, if any, other factor (s) might put our cell populations into the high versus low spontaneous firing categories. What is known is that spontaneous activity is directly related to the state of the animal, being significantly higher when the animal is awake (Castro-Alamancos 2004). A decrease in spontaneous activity within the thalamus may have a direct impact on cortical state, favoring cortical deactivation or synchrony (Hirata and Castro-Alamancos 2010). Moreover, change in spontaneous activity at the level of the thalamus is able to switch the cortical state (Hirata and Castro-Alamancos 2010). Thus, our data support a view that the CB1 receptors, rather than favoring a particular “state”, may serve to maintain “balance” in an almost homeostatic way, preventing.
(9) overexcitation or suppression while maintaining information throughput at some defined, perhaps optimal, level. Fig. 8 a Decrease of the signal-tonoise ratio (left) and increase of the Fano factor (right) were statistically significant for those neurons that experienced a CB1-mediated increase in their responses (*p<0.05 vs. control, Friedman’s test followed byWilcoxon’s signed rank test). b On the other hand, those neurons which decreased their responses due to the activation of the CB1 receptor showed a statistically significant increase in their signal-to-noise ratio (left) and a decrease (right) in value of the Fano factor. c Average spontaneous activity for those cells that showed increased firing and those showing decreased in presence of CB (*p<0.05 vs. control, Friedman’s test followed by Wilcoxon’s signed rank test). With this in mind, we note that thalamic cells are involved in multiple neural systems. As noted above, they receive “driving” glutamatergic inputs from the retina, but also modulatory inputs from the visual cortex and, significantly, cholinergic, noradrenergic, and serotonergic inputs (among others) fromthe brain stem(Steriade et al. 1988, 1997). These rich modulatory inputs modify neuronal responses at different levels: brainstem inputs are considered to regulate thalamic output globally, changing from sleep to wake (Steriade et al. 1997) and inattentive to attentive (Sherman and Koch 1986), with the cortico-thalamic input appearing to exert a more subtle and specific modulation, for example increasing tight synchrony between cells (Sillito and Jones 2002; Andolina et al. 2007) or modifying the response to specific parts of the stimulus (Rivadulla et al. 2002; Sillito et al. 1993; Cudeiro and Sillito 1996; de Labra et al. 2007). In such a complex scenario, endocannabinoids have multiple routes to regulate neuronal function. For example, it is known that AEA and 2-AG can inhibit the release of glutamate or GABA (Schlicker and Kathmann 2001; Piomelli 2003; Wilson and Nicoll 2001; Diana et al. 2002), i.e., inducing inhibition or excitation, as we see in our data. However, another possibility is an action on cholinergic synapses. CB1 receptor activation can increase or decrease ACh release in the hippocampus (Acquas et al. 2000; Tzavara et al. 2003) with Tzavara et al. (2003) showing that the effect is dose dependent, higher doses having an inhibitory effect. Interestingly, application of the CB1 antagonist AM251 alone, in a dose sufficient to block exogenous agonist activity, did not affect neuronal responses, indicating that endogenous CB release may not be active in local neuronal responses in our anaesthetized preparation, although the CB system may well be an integral part of the “global” modulatory systems arising from the brainstem. In our experimental preparation, the activity of these systems is likely to be significantly depressed (Steriade et al. 1997), which would be compatible with a low level of CB1 receptor-mediated activity. On balance, we think that the most plausible explanation for our data may be that in normal physiological function, the endocannabinoid system (through CB1 receptor activation) acts to a greater or lesser degree simultaneously on all three synaptic types, perhaps with each of them having different effects on interneurons or relay cells, with the final result determined by which of the systems is the most relevant at a given time. This would serve to maintain thalamic activity in a middle, moderate range, boosting and clarifying low amplitude signals and avoiding saturation at higher levels. Exogenously applied cannabinoids, as in the “recreational” drug use of cannabis, could clearly disturb this role, giving.
(10) rise to subtle shifts in thalamocortical inputs to the cortex, in turn affecting higher functions, manifesting in the visual behavioral responses reported in the literature (Kiplinger et al. 1971; Dawson et al. 1977; Russo et al. 2004). While more work is necessary to clarify the mechanisms, clearly CB1 receptors are involved in a complex modulation of synaptic communication within the thalamus, previously undescribed, with fundamental consequences for the transfer of sensory information to the cortex. Acknowledgments The work was supported by MICINN (BFU2009-08169) and Xunta de Galicia (Consellería de Educación-2007/000140-0), Spain. M. Dasilva is a predoctoral fellow supported by the FPU program.. References Acquas E, Pisanu A, Marrocu P, Di Chiara G (2000) Cannabinoid CB (1) receptor agonists increase rat cortical and hippocampal acetylcholine release in vivo. Eur J Pharmacol 401:179–185 Andolina IM, Jones HE, Wang W, Sillito AM (2007) Corticothalamic feedback enhances stimulus response precision in the visual system. Proc Natl Acad Sci USA 104:1685–1690 Breivogel CS, Sim LJ, Childers SR (1997) Regional differences in cannabinoid receptor/G-protein coupling in rat brain. J Pharmacol Exp Ther 282:1632–1642 Castro-Alamancos MA (2004) Dynamics of sensory thalamocortical synaptic networks during information processing states. Prog Neurobiol 74:213–247 Cudeiro J, Sillito AM (1996) Spatial frequency tuning of orientationdiscontinuity-sensitive corticofugal feedback to the cat lateral geniculate nucleus. J Physiol 490:481–492 Cudeiro J, Sillito AM (2006) Looking back: corticothalamic feedback and early visual processing. Trends Neurosci 29:298–306 Dawson WW, Jiménez-Antillon CF, Perez JM, Zeskind JA (1977) Marijuana and vision—after ten years’ use in Costa Rica. Invest Ophthalmol Vis Sci 16:689–699 de Labra C, Rivadulla C, Grieve K, Mariño J, Espinosa N, Cudeiro J (2007) Changes in visual responses in the feline dLGN: selective thalamic suppression induced by transcranial magnetic stimulation of V1. Cereb Cortex 17:1376–1385 Devane WA, Hanus L, Breuer A, Pertwee RG, Stevenson LA, Griffin G, Gibson D, Mandelbaum A, Etinger A, Mechoulam R (1992) Isolation and structure of a brain constituent that binds to the cannabinoid receptor. Science 258:1946–1949 Di Marzo V, Fontana A, Cadas H, Schinelli S, Cimino G, Schwartz JC, Piomelli D (1994) Formation and inactivation of endogenous cannabinoid anandamide in central neurons. Nature 372:686–691 Diana MA, Levenes C, Mackie K, Marty A (2002) Short-term retrograde inhibition of GABAergic synaptic currents in rat Purkinje cells is mediated by endogenous cannabinoids. J Neurosci 22:200–208 Egertová M, Giang DK, Cravatt BF, Elphick MR (1998) A new perspective on cannabinoid signalling: complementary localization of fatty acid amide hydrolase and the CB1 receptor in rat brain. Proc Biol ScI 265:2081–2085 Felder CC, Nielsen A, Briley EM, Palkovits M, Priller J, Axelrod J, Nguyen DN, Richardson JM, Riggin RM, Koppel GA, Paul SM, Becker GW (1996) Isolation and measurement of the endogenous cannabinoid receptor agonist, anandamide, in brain and peripheral tissues of human and rat. FEBS Lett 393:231–235 Ferraro L, Tomasini MC, Gessa GL, Bebe BW, Tanganelli S, Antonelli T (2001) The cannabinoid receptor agonist WIN 55,212-2 regulates glutamate transmission in rat cerebral cortex: an in vivo and in vitro study. Cereb Cortex 11:728–733 Freund TF, Katona I, Piomelli D (2003) Role of endogenous cannabinoids in synaptic signaling. Physiol Rev 83:1017–1066 Gabbott PL, Bacon SJ (1994) Two types of interneuron in the dorsal lateral geniculate nucleus of the rat: a combined NADPH diaphorase histochemical and GABA immunocytochemical study. J Comp Neurol 350:281–301 Gabbott PL, Somogyi J, Stewart MG, Hámori J (1986) A quantitative investigation of the neuronal composition of the rat dorsal lateral geniculate nucleus using GABA-immunocytochemistry. Neuroscience 19:101–111 Godwin DW, Van Horn SC, Eriir A, Sesma M, Romano C, Sherman SM (1996) Ultrastructural localization suggests that retinal and cortical inputs access different metabotropic glutamate receptors in the lateral geniculate nucleus. J Neurosci 16:8181–8192 Grieve KL (2005) Binocular visual responses in cells of the rat dLGN. J Physiol 566:119–124 Hale PT, Sefton AJ, Dreher B (1979) A correlation of receptive field properties with conduction velocity of cells in the rat’s retinogeniculo-cortical pathway. Exp Brain Res 35:425–442 Haller J, Mátyás F, Soproni K, Varga B, Barsy B, Németh B, Mikics E, Freund TF, Hájos N (2007) Correlated species differences in the effects of cannabinoid ligands on anxiety and on GABAergic and glutamatergic synaptic transmission. Eur J Neurosci 25:2445–2456.
(11) Herkenham M, Lynn AB, Johnson MR, Melvin LS, de Costa BR, Rice KC (1991) Characterization and localization of cannabinoid receptors in rat brain: a quantitative in vitro autoradiographic study. J Neurosci 11:563–583 Hirata A, Castro-Alamancos MA (2010) Neocortex network activation and deactivation states controlled by the thalamus. J Neurophysiol 103:1147–1157 Kim J, Isokawa M, Ledent C, Alger BE (2002) Activation of muscarinic acetylcholine receptors enhances the release of endogenous cannabinoids in the hippocampus. J Neurosci 22:10182–10191 Kiplinger GF, Manno JE, Rodda BE, Forney RB (1971) Dose–response analysis of the effects of tetrahydrocannabinol in man. Clin Pharmacol Ther 12:650–657 Laviolette SR, Grace AA (2006) Cannabinoids potentiate emotional learning plasticity in neurons of the medial prefrontal cortex through basolateral amygdale inputs. J Neurosci 26:6458–6468 Lin YS, Lee L-Y (2002) Stimulation of pulmonary vagal C fibers by anandamide in anaesthetized rats: a role of vanilloid type 1 receptors. J Physiol 539:47–955 Maejima T, Hashimoto K, Yoshida T, Aiba A, Kano M (2001) Presynaptic inhibition caused by retrograde signal from metabotropic glutamate to cannabinoid receptors. Neuron 31:463–475 Matsuda LA, Lolait SJ, Brownstein MJ, Young AC, Bonner TI (1990) Structure of a cannabinoid receptor and functional expression of the cloned cDNA. Nature 346:561–564 Mechoulam R, Ben-Shabat S, Hanus L, Ligumsky M, Kaminski NE, Schatz AR, Gopher A, Almog S, Martin BR, Compton DR et al (1995) Identification of an endogenous 2-monoglyceride, present in canine gut, that binds to cannabinoid receptors. Biochem Pharmacol 50:83–90 Moldrich G, Wenger T (2000) Localization of the CB1 cannabinoid receptor in the rat brain. An immunohistochemical study. Peptides 21:1735–1742 Munro S, Thomas KL, Abu-Shaar M (1993) Molecular characterization of a peripheral receptor for cannabinoids. Nature 365:61–65 Paxinos G, Watson C (1997) The rat brain in stereotaxic coordinates. Academic, New York Pettit DA, Harrison MP, Olson JM, Spencer RF, Cabral GA (1998). Immunohistochemical localization of the neural cannabinoid receptor in rat brain. J Neurosci Res 51:391–402 Piomelli D (2003) The molecular logic of endocannabinoid signalling. Nat Rev Neurosci 4:873–884 Reese BE (1988) ‘Hidden lamination’ in the dorsal lateral geniculate nucleus: the functional organization of this thalamic region in the rat. Brain Res 472:119–137 Rivadulla C, Martínez LM, Varela C, Cudeiro J (2002) Completing the corticofugal loop: a visual role for the corticogeniculate type 1 metabotropic glutamate receptor. J Neurosci 22:2956–2962 Russo EB, Merzouki A, Mesa JM, Frey KA, Bach PJ (2004) Cannabis improves night vision: a case study of dark adaptometry and scotopic sensitivity in kif smokers of the Rif mountains of northern Morocco. J Ethnopharmacol 93:99–104 Schlicker E, Kathmann M (2001) Modulation of transmitter reléase via presynaptic cannabinoid receptors. Trends Pharmacol Sci 22:565–572 Sherman SM, Guillery RW (2002) The role of the thalamus in the flow of information to the cortex. Phil Trans R Soc Lond B Biol Sci 357(1428):1695–1708 Sherman SM, Koch C (1986) The control of retinogeniculate transmission in the mammalian lateral geniculate nucleus. Exp Brain Res 63:1–20 Sillito AM, Jones HE (2002) Corticothalamic interactions in the transfer of visual information. Phil Trans R Soc Lond B Biol Sci 357:1739–1752 Sillito AM, Cudeiro J, Murphy PC (1993) Orientation sensitive elements in the corticofugal influence on centre– surround interactions in the dorsal lateral geniculate nucleus. Exp Brain Res 93:6–16 Stella N, Schweitzer P, Piomelli D (1997) A second endogenous cannabinoid that modulates long-term potentiation. Nature 388:773–778 Steriade M, Paré D, Parent A, Smith Y (1988) Projections of cholinergic and non-cholinergic neurons of the brainstem core to relay and associational thalamic nuclei in the cat and macaque monkey. Neuroscience 25:47–67 Steriade M, Jones EG, McCormick DA (1997) Thalamus. Vol. I. Organization and function, vol I. Elsevier, Amsterdam Sugiura T, Kondo S, Sukagawa A, Nakane S, Shinoda A, Itoh K, Yamashita A, Waku K (1995) 2Arachidonoylglycerol: a posible endogenous cannabinoid receptor ligand in brain. Biochem Biophys Res Commun 215:89–97 Sugiura T, Kondo S, Sukagawa A, Tonegawa T, Nakane S, Yamashita A, Ishima Y, Waku K (1996) Transacylasemediated and phosphodiesterase-mediated synthesis of Narachidonoylethanolamine, an endogenous cannabinoidreceptor ligand, in rat brain microsomes. Comparison with synthesis from free arachidonic acid and ethanolamine. Eur J Biochem 240:53–62 Thomas EA, Cravatt BF, Danielson PE, Gilula NB, Sutcliffe JG (1997) Fatty acid amide hydrolase, the degradative enzyme for anandamide and oleamide, has selective distribution in neurons within the rat central nervous system. J Neurosci Res 50:1047–1052 Tzavara ET, Wade M, Nomikos GG (2003) Biphasic effects of cannabinoids on acetylcholine release in the hippocampus: site and mechanism of action. J Neurosci 23:9374–9384 Wilson RI, Nicoll RA (2001) Endogenous cannabinoids mediate retrograde signalling at hippocampal synapses. Nature 410:588–592.
(12)
Figure


+3


Documento similar
The signal-to-noise ratio (SNR) is calculated as the difference between the noise level of the system and the level of power that reaches our photodiode. We will make a
Table of Contents ... From Mental Disorders to Brain Disorders ... Neuroimaging of the Brain... Evoked and Spontaneous Brain Activity ... Foundations of Resting-State fMRI
Man would not act according to certain values because they are good, but because of other reasons (because they please him, make him happy, etc.). Technically, these moral
In the previous sections we have shown how astronomical alignments and solar hierophanies – with a common interest in the solstices − were substantiated in the
We found a higher amplitude of regional spontaneous activity in bilinguals compared to 236. monolinguals in the thalamus bilaterally (Fig 2; Table
In practical terms, this means that when it comes the time to estimate the flow ratio, instead of observing the values of Figure 1, network managers aware of protocol shares in
The angular cuts (including the energy cut of 236 ± 30 MeV) and the resulting signal and background efficiencies, the expected number of signal and background events, the
The purpose of this study was to determine the influence of visual behaviour (visual fixation location, number and duration) on decision making in volleyball blocking.. The
