Synthesis and Mechanical Characterization of Aluminum Based Composites Prepared by Powder Metallurgy
6
0
0
Texto completo
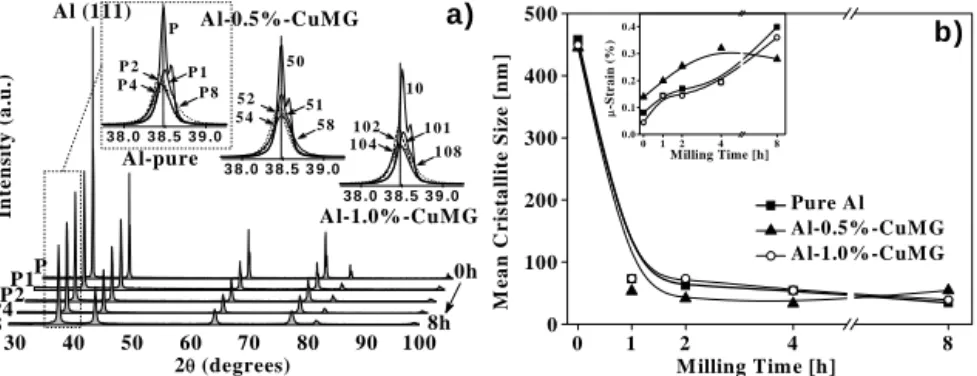
(2) increase of the mechanical response. Additionally, solid-state processing minimizes reactions between matrix and reinforcement, which can enhance the bonding between reinforcement particles and matrix [10]. EXPERIMENTAL PROCEDURE The initial powders (raw materials) have the following characteristics, Al from Alfa Aesar (99.5% purity and -325 mesh), Cu (99% purity and -325 mesh) and graphite (99.9% purity and 20+84 mesh). The reinforcement material i.e., metallized graphite (MG) is prepared by milling a mix of graphite-copper with 15 at.% of Cu, using a SPEX 8000M device in Ar atmosphere during 4h. The Al based composite synthesis is performed by mixing Al powder with MG particles in concentration of 0.0, 0.5 and 1.0 wt.% as shown in Table I. Then, the as-mixed powders are milled in a ZOZ CM01 Simoloyer mill for 4 milling intervals (1, 2, 4 and 8h) under Ar atmosphere. Milling device and media are made of stainless steel. Methanol is used as a process control agent to avoid excessive aluminum agglomeration. Pure Al samples (without Cu-MG addition), milled and un-milled are used as reference material for comparison proposes. Table I. Composites nomenclature. Milling Intensity [h] Sample 0 1 2 4 8 Pure Al. P. P1. P2. P4. P8. Al + 0.5 wt.% Cu-MG. 50. 51. 52. 54. 58. Al + 1.0 wt.% Cu-MG. 100. 101. 102. 104. 108. In order to measure the crystallite size and lattice strain of particles, milled samples are characterized with a Siemens D5000 diffractometer. Also, a portion of composite samples are prepared using standard metallographic techniques to accomplish microstructural observations with a SEM model JEOL-JSM 7401F. Samples are uniaxially cold pressed at 950 MPa and sintered for 3h at 823 K. Density measurements are performed according to Archimedes’ method. Hardness tests are executed in sintered samples with a Wilson Rockwell hardness tester (average of five measurements is considered) in Rockwell F scale and converted to Brinell. Compression tests are carried out in an Instron universal tester at constant displacement rate of 0.0333 mm/sec, yield stress is measured at the elastic limit and maximum stress is measured at an arbitrary condition of 20% strain. DISCUSSION X-Ray Diffraction (XRD) characterization. Figure 1a shows some XRD patterns as a function of milling time together with magnified views of the principal Al (111) diffraction peak. Table 1 shows the nomenclature in use. It is evident that the diffraction peaks are broadening as the milling time is increased. This is induced by the stress and grain size refinement of the powder particles [11]. After 2h of processing, the peaks of all samples present a small shift to lower 2θ values, denoting an increment in the lattice parameter. However, with further milling time, the peaks return to their original position. These phenomena can be explained by the increase in the vacancy density and their subsequent relaxation, which has been reported elsewhere [12]..
(3) 50. P1 P8. 52 54. 3 8 .0 3 8 .5 3 9 .0. Al-pure. 10 51 58. 1 02 10 4. 1 01 1 08. 3 8 .0 3 8 .5 3 9 .0 3 8 .0 3 8 .5 3 9 .0. Al-1.0% -CuMG. P P1 P2 P4 P8 30 40. 0h 50. 60 70 80 2 θ (degrees). 90. 8h 100. 500. b). 0.4. μ-Strain (%). Intensity (a.u.). P2 P4. a). Al-0.5%-CuM G. P. M ean Cristallite Size [nm]. Al (111). 400. 0.3 0.2 0.1 0.0. 300. 0. 1. 2. 4. 8. Milling Time [h]. 200. Pure Al Al-0.5%-CuMG Al-1.0%-CuMG. 100 0 0. 1. 2 4 M illing Time [h]. 8. Figure 1. (a) XRD patterns and (b) Crystallite size and μ−strain of composites. Figure 1b shows that Al-0.5%Cu-MG samples present an important variation in grain size and strain, compared with un-doped and milled samples; meanwhile Al-1.0%Cu-MG composites have a similar behavior compared with pure Al. These effects are a consequence of severe plastic deformation [13]. Morphological analysis. Since powders size distribution decreases with milling, Cu-MG particles are fractured and embedded onto the matrix surface (Figure 2). With intense milling, the surface fractures again and a new surface is exposed and covered by free particles. This process is repeated many times during processing and then the fragmented particles are captured by welding particles and confined to welding lines, gradually developing a lamellar structure. A repeated fracture-convolution process results in a uniform distribution of the Cu-MG and good bonding between layers that, contribute to increase the compression strength [14]. Figure 2. SEM images and EDS analysis on CuMG particle (bright spot) embedded between Al matrix layers. The particles are dispersed in the matrix and present a high concentration of C and Cu (EDS analysis). Even though the high solubility of Cu in Al, particles remain insoluble and these present nanometric size and are grouped in a cluster form..
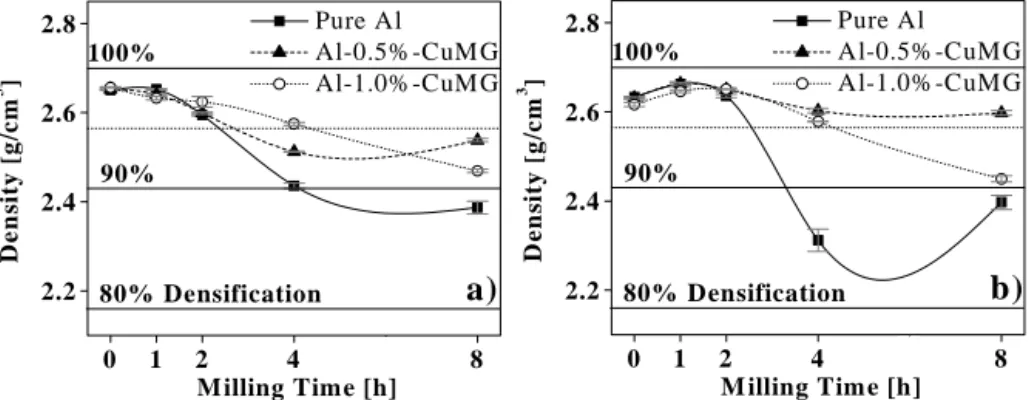
(4) Table II. Results of compression tests [KgF/mm2] and hardness measurements in the sintered composites.. Densification. Figures 3a-b show some density determinations in composites. For comparison purposes between samples, the Sample Brinell H. σy σmax measured density is divided by the theoretical density for each sample 7.12 ± 0.05 17.71 ± 0.04 ----P composition in order to get the densification percent shown in these 10.17 ± 0.07 24.31 ± 0.22 ----P1 figures. It is evident that, low 14.91 ± 0.16 31.05 ± 0.33 Under 55 HB P2 milling times (1h) produce samples with higher densities (Figure 3). 13.46 ± 0.18 27.18 ± 0.21 P4 ----This is characteristic of spherical 9.60 ± 0.44 30.71 ± 0.15 P8 ----morphologies where powders have a good mobility and they pack 6.84 ± 0.05 18.24 ± 0.04 50 ----randomly and densely [15,13]. On 13.01 ± 0.31 29.72 ± 0.20 Under 55 HB 51 the contrary, un-doped samples after 4h of milling show a marked 17.50 ± 0.18 35.71 ± 0.14 55 ± 1 52 decrease in their densification. 20.62 ± 0.01 41.34 ± 0.24 66 ± 1 54 Milled flattened particles yield a low densification due to high friction and 20.66 ± 0.05 33.87 ± 0.13 63 ± 1 58 bridge formation. In this way, laminar morphology of the longer6.58 ± 0.28 18.31 ± 0.20 ----100 time milled powders induces poorer 14.72 ± 0.25 27.02 ± 0.63 ----101 packing and consequently low density values [7]. Another cause of 17.14 ± 0.23 36.17 ± 0.14 59 ± 1 102 this effect can be attributed to the 14.90 ± 0.17 32.95 ± 0.22 Under 55 HB 104 hardening effect of the milling, which increases the powders 10.29 ± 0.92 35.20 ± 0.13 Under 55 HB 108 hardness and consequently limits their plastic deformation response [16]. These phenomena are important in samples with longer milling times (2 to 8h), where milling has an adverse effect on density. Meanwhile, Al-1.0%CuMG samples maintain their density and Al-0.5%Cu-MG have an increment of densification. Densification depends on milling intensity and reinforcement concentration, reaching an optimal with low additive concentration and 1-2 h of milling. Mechanical properties of sintered composites. Figure 4a shows the average of three stressstrain curves from pure Al samples milled at five time intervals. It is clear, that milled samples present a better mechanical performance as compared with un-milled Al, due to work hardening [17] and grain size reduction [13]. Table II shows measurements of mechanical properties for all samples, it is evident that milling induces an important increase on the yield (σy) and maximum strength (σmax). In contrast to experimental values found in the present study, Son et al. [14] establish that addition of graphite decreases the compressive strength of the composites, due possibly to a low contact area between matrix powders. Fogagnolo et al. [18] mention that reinforcement clusters, cracks in the reinforcement surface or poor bounding between matrix and reinforcements can also deteriorate the composite strength. High concentration composites (1.0%-CuMG) present a modest performance probably due to the presence of free enforced.
(5) particles which segregate forming agglomerates and lower the final properties [19] or by a matrix saturation effect [14]. Figure 4b shows a comparison of σy and σmax in synthesized composites. The increment in both properties is noticeable, Cu-MG concentration and milling intensity have an important effect on the mechanical performance of the composites. It indicates a synergic effect of metal graphite addition and milling intensity. The optimum point is obtained with 4h of milling and a low concentration (0.5%-CuMG) of reinforcement particles, like Esawi et al. [20] found. Besides, Table II shows that compacted-sintered composites present an irregular trend, some samples exhibit an increase of hardness, while others present strong cracking and property loss. In this manner the P2 sample displays a hardness peak of all the pure Al series, but this is lower than the corresponding values for composites with MG additions. There is normally an optimum milling time for each composition according to Table II, further milling or a change in MG concentration produces normally lower values of hardness. The best response is obtained with a low MG addition (0.5%) and 4h of milling intensity. Microstructure differences and packing efficiency for sintering between milled powders explain the variation in the final hardness of the sintered sample.. 2.6 90% 2.4. 0. 1. 100%. a). 2.2 80% Densification 2 4 6 Milling Time [h]. Pure Al Al-0.5%-CuMG Al-1.0%-CuMG. 2.8 3. 3. Density [ g/cm ]. 100%. Density [ g/cm ]. Pure Al Al-0.5%-CuMG Al-1.0%-CuMG. 2.8. 2.6 90% 2.4. b). 2.2 80% Densification 0. 8. 1. 2 4 6 M illing Time [h]. 8. Figure 3. Density and densification percent curves of samples (a) before and (b) after sintering.. 50. P2. σ [kg F /mm 2]. σ [Kg F/mm 2]. 40 30. a). P8. P1. 20 P4. 10. b) σmax. 40. Pure Al Al-0.5%-CuMG Al-1.0%-CuMG. 30 20. σy. P 10. 0 0.0. 0.1. 0.2 0.3 0.4 ε [mm/mm]. 0.5. 0. 1. 2 4 6 M illing Time [h]. 8. Figure 4. (a) Stress-Strain curves of un-doped Al samples. (b) Yield and maximum strength values found in sintered composites as a function of milling intensity and additive content..
(6) CONCLUSIONS Reinforcement particles are sub-micrometric and are homogeneously distributed leading to an important effect on the mechanical performance of the prepared composites. Additive concentration has an important effect on mechanical properties of composites and it has a synergic effect with milling intensity. Low concentration Al-CuMG composite with 4h of milling is the best option as a strengthening condition. Pre-milling process together with PM can increase the mechanical properties of Al-based composites prepared by this solid state route. ACKNOWLEDGMENTS This research is supported by CONACYT (Y46618). USA-Air force Office of Scientific Research, Latin America Initiative, Dr. Joan Fuller, contract # FA 9550/0 6/1/0524. Thanks to D. L. Gutierrez, A. H. Gutierrez, and E. T. Molle for technical assistance. REFERENCES 1. J.M. Torralba, C.E. da Costa, F. Velasco. J. Mat. Proc. Tech. 133, 203–206 (2003). 2. S.W. Ip, R. Sridhar, J.M. Toguri, T.F. Stephenson, A.E.M. Warner. Mat. Sci. & Eng. A244, 31–38 (1998). 3. H. Mayer, M. Papakyriacou. Carbon 44, 1801–1807 (2006). 4. V. Amigo, J. L. Ortiz and M. D. Salvador. Scripta Mater. 42, 383–388 (2000). 5. F. Akhlaghi, S.A. Pelaseyyed. Mat. Sci. & Eng. A385, 258–266 (2004). 6. C. Zubizarreta, S. Giménez, J.M. Martín, I. Iturriza. J. Alloys & Comp. 467, 191–201 (2009). 7. J.B. Fogagnolo, F. Velasco, M. H. Robert, J.M. Torralba. Mat. Sci. & Eng. A342, 131-143 (2003) 8. M. Adamiaka, J.B. Fogagnolo, E.M. Ruiz-Navas, L.A. Dobrzañski, J.M. Torralba. J. Mat. Proc. Tech. 155–156, 2002–2006 (2004). 9. D. Casellas, A. Beltran, J.M. Prado, A. Larson, A. Romero. Wear 257, 730–739 (2004). 10. Hailong Wang, Rui Zhang, Xing Hu, Chang-An Wang, Yong Huang. J. Mat Pross. Tech. 197, 43–48 (2008). 10. Naiqin Zhao, Philip Nash, Xianjin Yang. J. Mat. Pros. Tech. 170, 586–592 (2005). 11. D. Oleszak, V.K. Portnoy and H. Matyja, J. Met. & Nanocrys. Mats. 2-6, 345-350 (1999). 12. Z. Razavi Hesabi, A. Simchi, S.M. Seyed Reihani. Mat. Sci. and Eng. A 428,159–168. (2006) 13. H.T. Son, T.S. Kim, C. Suryanarayana,, B.S. Chun. Mat. Sci. & Eng. A348, 163-169 (2003). 14. B.P. Neville, A. Rabiei. Mat. & Design 29, 388–396 (2008). 15. Z. Razavi Hesabi, H.R. Hafizpour, A. Simchi. Mat. Sci. & Eng. A454–455, 89–98 (2007). 16. H. Abdoli, E. Salahi, H. Farnoush, K. Pourazrang. J. Alloys & Comp. 461, 166–172 (2008). 17. J.B. Fogagnolo, M.H. Robert, J.M. Torralba. Mat. Sci. & Eng. A426, 85–94 (2006). 18. E.M. Ruiz-Navas, J.B. Fogagnolo, F. Velasco, J.M. Ruiz-Prieto, L. Froyen. Composites A37, 2114–2120 (2006). 19. Amal M.K. Esawi, Mostafa A. El Borady. Comp. Sci. & Tech. 68, 486–492 (2008)..
(7)
Figure
![Table II. Results of compression tests [Kg F /mm 2 ] and hardness measurements in the sintered composites](https://thumb-us.123doks.com/thumbv2/123dok_es/7443845.396044/4.667.101.522.165.587/table-results-compression-tests-hardness-measurements-sintered-composites.webp)
Documento similar