“SYNTHESIS AND CHARACTERIZATION OF PANI / GRAPHENE COMPOSITES
99
0
0
Texto completo
(2) “There are only two mistakes one can make along the road to truth; not going. all the way, and not starting.”. Buddha. ii.
(3) ABSTRACT The PAni/Graphene composites by two different methods are studied. In the first method, graphene oxide is used as the dopant of polyaniline taking the advantage of GO makes itself as a dopant to polyaniline (PAni) due to its carboxylic acids on its surface. According to that idea graphene oxide (GO) is reduced by leucoemeraldine state of PAni, instead of using another reducing agent both to remove oxygene functionality on the graphite oxide and oxide the PAni in leucoemeraldine state to the conducting emeraldine state. PAni/reduced graphene (PAni/RGO) with different mass ratio is prepared. For comparison, PAni/GO composites also is prepared by in situ polymerization of polyaniline. The composites have been characterized by Fourier Transform Infrared Spectrum (FTIR spectroscopy), UV-visible (UV-VIS) spectroscopy and cyclic voltammetry (CV). FTIR spectroscopy of the PAni/RGO materials showed the typical peaks of the PAni which can be concluded the presence of PAni in the composites. The characteristic peaks of the GO were not observed. It was the direct evidence of the removal of the oxygene functional groups. UV-VIS spectroscopy indicated the same results as FTIR. According to the results, the leucoemeraldine state of PAni oxided to emeraldine state while GO reduced. CV studies showed that the materials are electrochemically active. The electrochemical performances were affected by the mass ratio PAni : RGO. The electrochemical performances of the PAni / RGO 100 exhibits closer electrochemical performance to PAni. According to the four-probe technique the electrical conductivity of the materials. ii.
(4) were 0. 845, 0. 44, 0. 279, 0. 06, 0. 05, 0. 02 S cm-1 for PAni, PAni / GO, PAni / RGO 100, PAni / RGO 200, PAni / RGO 300, and PAni / RGO 500 respectively. As a second method, the sulfonation of graphene by two different strategies is studied. Hybrids of PAni and sulfonated graphene (SGrf) are prepared by the polymerization of aniline in the presence of the SGrf . The materials have been characterized by RAMAN spectroscopy, FTIR spectroscopy,. thermogravimetric analyse (TGA) , CV and. Transmission Electron Microscopy (TEM). Raman spectroscopy results used to calculate D / G intensities of sulfonated graphenes. The results for reduced and sulfonated graphene sheets by sulfonic acid (GSA) and reduced and sulfonated graphene sheets by 6-amino-4-hydroxy-2naphthalenesulfonic acid (GNSA) and GO samples were 0.96, 0.92 and 0.87 respectively which indicates the formation of smaller graphitic domains than those in GO and graphene-oxide reduction. FTIR spectroscopy of the PAni/ SGrf s showed that clear bands at 1095 and 1037 cm-1, which are assigned to the symmetric and anti-symmetric stretching of sulfonic groups respectively which points to successful sulfonation of the graphenes. UV-VIS spectroscopy was used to calculate water solubility of the sulfonated graphenes. According to the results, the solubilities of the GSA and GNSA samples were 0. 104 and 0. 138 mg mL -1 respectively. TGA indicated that less volatile functionalities are present on GSA and GNSA surfaces comparing to GO as a result of the successful reduction. This pointed to sulfonation method was the efficient way to obtain more thermostable compositions. iii.
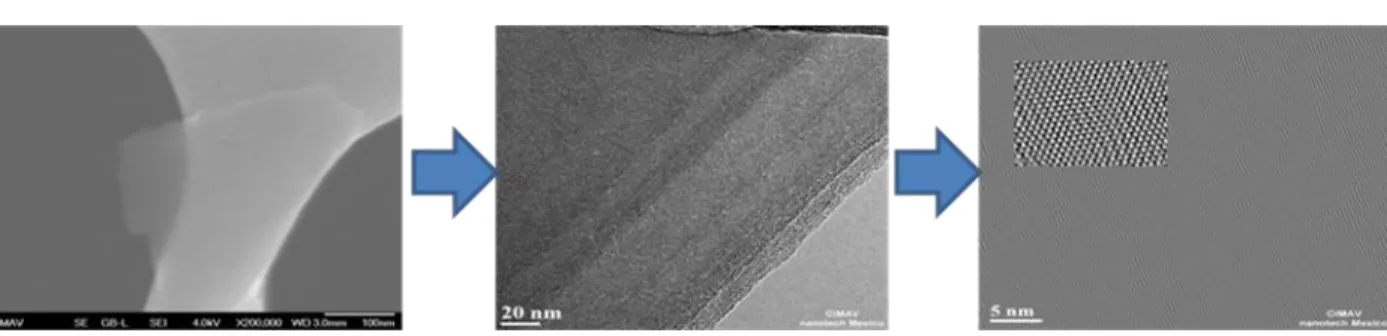
(5) TEM results showed typical-wrinkled morphology of the reduced-sulfonated graphene sheets.. Morphologies. of. the. PAni/. SGrf. showed. the. particles. of. PAni. intercalated/covered on the surfaces of the graphene sheets. According to the EDS results the ratio of sulfur element was % 5. 78 in the GNSA sample. It is a good indicator of the sulfonation efficiency. The CV results showed that the materials are electrochemically active at physiological pH likely due to the doping of PAni with SGrf. . In fact, a good electrochemical response is obtained at pH 6 for the PAni/ SGrf s. In addition. high conductivity values are. obtained by four probe technique. The electrical conductivities were 1. 42, 13. 60, 14. 09, 25. 60, 26. 33 S cm-1 for PAni, GSA, GNSA, PAni/ GSA, PAni/ GNSA samples respectively. General results indicated that the both method was efficient to obtain electrochemically active and electrically conductive materials. This let us the conclude that methods of the dopping the polyaniline with graphene oxide and funcionalization of the polyaniline with the modified graphenes worked very well. The sulfonation method was prominent as higher conductivities obtained compare to pure PAni due to surface modificated graphenes provides better interconnection with PAni as it was stated in the hypotheses.. iv.
(6) TABLE OF ABBREVIATIONS. PAni. Polyaniline. GO. Graphene oxide. RGO. Reduced graphene oxide. PAni / RGO. Polyaniline-reduced graphene oxide composite. PAni / GO. Polyaniline-graphene oxide composite. SGrf (s). Sulfonated and reduce graphene (s). GSA. Reduced graphene oxide sheets sulfonated by sulfonic acid. GNSA. Reduced graphene oxide sheets sulfonated by 6-amino-4-hydroxy-2naphthalenesulfonic acid. PAni/ GSA. Polyaniline dopped reduced graphene oxide sheets sulfonated by sulfonic acid composite. PAni/GNSA. Polyaniline dopped reduced graphene oxide sheets sulfonated by 6amino-4-hydroxy-2-naphthalenesulfonic acid. v.
(7) OUTLINE ABSTRACT CHAPTER I .............................................................................................................. 1 I.. INTRODUCTION................................................................................................ 1. II.. BACKGROUND .............................................................................................. 4. a.. Conductive Polymers ...................................................................................... 4. b.. Polyaniline ...................................................................................................... 5. c.. Graphene ...................................................................................................... 10. d.. PAni / Graphene composites ........................................................................ 14. III.. JUSTIFICATION ........................................................................................... 18. IV.. HYPOTHESES ............................................................................................. 18. V.. OBJECTIVE .................................................................................................. 19. Particular Objectives .............................................................................................. 19 CHAPTER II ........................................................................................................... 21 VI.. THEORITICAL ASPECTS ............................................................................ 21. POLYANILINE........................................................................................................ 21 Polyaniline Synthesis ............................................................................................. 22 The doping mechanism of polyaniline and the conductivity ................................... 23 GRAPHENE ........................................................................................................... 23 Structural Features................................................................................................. 24 Conductivity in Graphene ....................................................................................... 25 vi.
(8) From graphite to graphite oxide, from graphite oxide to graphene ......................... 26 Functionalization of Graphene ............................................................................... 28 Method 1: ............................................................................................................... 32 General procedure for the synthesis of emeraldine salt of PANI ............................ 32 Synthesis of chemically reduced PANI (leucoemeraldine salt of PANI): ............... 32 Synthesis of PAni / reduce Go (RGO) ................................................................... 33 Preparation of PAni / GO composites .................................................................... 33 Method 2. .............................................................................................................. 34 Preparation of sulfonated graphene (SGrf). .......................................................... 34 Synthesis of PAni/ sulfonated graphene (PAni/ SGrf) ............................................ 34 VIII.. CHARACTERIZATION .............................................................................. 35. INFRARED SPECTROSCOPY .............................................................................. 35 UV-VIS SPECTROSCOPY .................................................................................... 35 RAMAN SPECTROSCOPY ................................................................................... 35 TEM ....................................................................................................................... 36 TGA........................................................................................................................ 36 CYCLIC VOLTAMMETRY ...................................................................................... 36 CONDUCTIVITY MEASUREMENT BY FOUR-PROBE TECHNIQUE ................... 37 CHAPTER III .......................................................................................................... 39 IX.. RESULTS AND DISCUSSION...................................................................... 39. PART 1 .................................................................................................................. 39. vii.
(9) POLYANILINE / RGO COMPOSITES .................................................................... 39 POLYANILINE/GO COMPOSITES ........................................................................ 40 1.. UV-VIS and FT-IR spectra ............................................................................ 41. 2.. Cyclic voltammetry ........................................................................................ 44. PART 2 .................................................................................................................. 48 Modification of reduced graphene .......................................................................... 48 In situ polymerization of polyaniline........................................................................ 49 1.. UV-VIS and FT-IR spectra ............................................................................ 50. 2.. Tga................................................................................................................ 56. 3.. Raman Spectroscopy.................................................................................... 57. 4.. Cyclic Voltammetry Studies .......................................................................... 59. 4. 1.. Sensor Application ..................................................................................... 69. 5.. Morphology Studies ...................................................................................... 71. X.. CONCLUSIONS............................................................................................ 76. REFERENCES....................................................................................................... 77. viii.
(10) FIGURE CAPTION Figure 1. Formation of aniline radical .............................................................................. 6 Figure 2. Representation of polyaniline: from insulator to conductor by oxidation; from conductor to insulator by reduction. ................................................................................ 7 Figure 3. Conversion mechanism of polyaniline ............................................................ 22 Figure 4. The conventional synthesis of polyaniline ...................................................... 23 Figure 5: All graphitic forms ........................................................................................... 25 Figure 6: TEM images and hexagonal atomic arrangement of graphene nanosheets .. 25 Figure 7. Electron hopping mechanism in valence electrons of graphene .................... 26 Figure 8. Graphite oxidation .......................................................................................... 27 Figure 9. Oxidized graphite ........................................................................................... 27 Figure 10. Reducing graphene by hydrazine................................................................. 29 Figure 11. Simultaneous oxidation of polyaniline .......................................................... 30 Figure 12. Incorporation of the sulfonated graphene onto PAni .................................... 30 Figure 13: Four probe method ....................................................................................... 38 Figure 14: Proposed equation of oxidation of leucoemeraldine state of PAni by reduction of GO............................................................................................................................. 40 Figure 15. GO dopped polyaniline (PANI/GO) .............................................................. 40 Figure 16. UV-VIS spectra of the PAni, PAni / RGO, and GO samples......................... 42 Figure 17. FT-IR spectra of pure PANI, GO, PANI/RGO and PANI/GO ........................ 42 Figure 18. Voltammograms at 100 mV s-1 ..................................................................... 45. ix.
(11) Figure 19. Cyclic voltammograms of the PAni / RGO 100 composite at different scan rates .............................................................................................................................. 46 Figure 20. Sulphanilic acid and reduced graphene sheets ............................................ 48 Figure 21. 6-amino-4-hydroxy-2-naphthalenesulfonic acid and graphene sheets. ....... 49 Figure 22 : RGO-SA dopped polyaniline (PANI/GSA) ................................................... 49 Figure 23. RGO-NSA dopped polyaniline (PANI/GNSA) ............................................... 50 Figure 24. UV-VIS spectra of the PAni, PAni / GSA, and PAni / GNSA ........................ 50 Figure 25. UV-VIS spectra of the doped PAni, PAni / GSA, and PAni / GNSA ............. 52 Figure 26. UV-VIS spectrum of the GSA and GNSA in water ....................................... 53 Figure 27. FT-IR spectra of the PAni-sulfonated graphene composites ........................ 55 Figure 28. FT-IR spectra of the GSA and GNSA materials ........................................... 56 Figure 29. TGA curves of GO, GSA and GNSA ............................................................ 56 Figure 30. Raman spectra of the GO, GSA, and GNSA ................................................ 58 Figure 30. Cyclic voltammograms of a) PAni / GSA, and b) PAni / GNSA composites at different scan rates. ...................................................................................................... 60 Figure 31. Conversion from emeraldine salt to pernigraniline ....................................... 61 Figure 32. CV voltammograms of the composites until 0. 6 V ....................................... 62 Figure 33. Cyclic voltammograms of a) pure PAni, b) PAni / GSA, and c) PAni / GNSA in different pHs at 20 mV. s-1 ......................................................................................... 63 Figure 34. 2nd oxidation potentials versus pH values of the composites ....................... 66 Figure 35. The relationship between the maximum oxidation peak currents and scan rate, the relationship between the maximum oxidation peak current, and the square roots of the scan rate in PAni / SGrfs ............................................................................ 67 x.
(12) Figure 36. Cyclic voltammograms of PAni/GSA composite electrodes in phosphate buffers (pH = 6) + 1mM ferrocenium solution at different scan rates. ........................... 69 Figure 37. Cyclic voltammograms of PAni / GSA and PAni / GNSA materials in phosphate buffers (pH = 6) and 1 mM ferrocenium solution in phosphate buffers pH 6 ...................................................................................................................................... 70 Figure 38. High resolution micrographs of GSA at different magnitude. ....................... 71 Figure 39. a) Graphene sheets reduced by KBrH4 b) GNSA ....................................... 72 Figure 40. TEM images of the GNSA composites. (a) Zero-energy loss bright field image, (b) carbon element mapping, (c) sulfur element mapping.................................. 72 Figure 41. TEM image of the GNSA composite ............................................................ 73 Figure 42. Electron diffraction pattern of the selected areas of the GNSA composite ... 74 Figure 43. TEM images of the PAni/GNSA composites ................................................ 75 Figure 44. TEM images of PAni/GSA composite ........................................................... 76. TABLE LIST Table 1. Specific capacities of the materials ................................................................. 47 Table 2. Potential values at 1st and 2nd oxidation conversions ...................................... 65 Table 3. Dependence of the peak potential on pH for second redox processes. ......... 67 Table 4. Electrical conductivity of the products ............................................................. 68 Table 5. Elemental analysis of the selected areas in Figure 41 .................................... 73. xi.
(13) xii.
(14) CHAPTER I I. INTRODUCTION Materials science can be divided into different groups in relation to their compositions, for example: ceramics, glasses, metals, or plastics. Plastics are typically organic polymers of high molecular mass; they are usually synthetic, most commonly derived from petrochemicals, but many are partially natural. Composite materials often called composites are engineered or naturally occurring materials, made from two or more constituent materials with significantly different physical or chemical properties. Semiconductors are materials with electrical conductivity intermediate in magnitude between that of a conductor and an insulator. Common semiconducting materials are crystalline solids, but amorphous and liquid semiconductors are also known. Silicon is used to create most semiconductors commercially.. In the last years, the area of the science and technology has been directed towards the study of synthetic metals. Synthetic metals are man-made materials that have many of the properties of metals, they conduct electricity, they can be magnetic, and they can be stimulated to produce light and so on (Macdiarmid, 2001).. The common synthetic. metals are the derivates of carbon and conducting polymers. They have applications in an extremely diverse range of areas such as artificial muscles, electronic noses, plastic solar cells, light emitting diodes, corrosion inhibition, biological and chemical sensors, electronic textiles and nerve cell communications (Potts, 2011).. 1.
(15) Carbon compounds are creating the strongest materials ever known by humans, by adopting a variety of forms, such as graphite, diamond, fullerenes, carbon nanotubes and graphene. The reason that it assumes many different structural forms is that carbon atom forms several distinct types of valance bonds, which refers to hybridization of atomic orbitals (Falcao and Wudl, 2007). Because of their different atomic conFigureuration, graphite, graphene, and diamonds are named as allotropes of carbon. Graphite is a common structure of carbon atoms that consists of multiple layers of carbon atoms arranged in a honeycomb lattice. In diamond, the carbon atoms are arranged in a variation of the face-centered cubic crystal structure, called a diamond lattice. Graphene is a single atomic layer of this honeycomb lattice, which is composed of carbon atoms that form hexagonal rings. Graphene is thin, a very good electric conductor, a good thermal conductor, transparent, and is highly impermeable (Fuhrer et al. , 2010). Graphene´s honeycomb lattice sheets of carbon can be wrapped up to create fullerenes that are shaped like a soccer ball, rolled to create nanotubes, or layered to create graphite. The outstanding properties of graphene, such as higher electron mobility, large specific surface area, mechanical strength have catapulted it to be one of the most studied and promising materials for the coming years.. Almost invariably, organic polymers mainly comprise plastics. The vast majority of these polymers are based on chains of carbon atoms alone or with oxygen, sulfur, or nitrogen as well. The properties of plastics are defined chiefly by the organic chemistry of the. 2.
(16) polymer such as hardness, density and resistance to heat, organic solvents, oxidation, and ionizing radiation. Some plastics can be made electrically conductive, with the conductivity of up to 80 kS/cm like in polyacetylene (Kumar et al. , 2011). They are called as conductive polymers or, more precisely, intrinsically conducting polymers (ICPs). They are polymers that conduct electricity linear-backbone "polymer blacks" (polyacetylene, polypyrrole, and polyaniline) and their copolymers are the main class of conductive polymers. Conductive polymers are well known for their low ionization potential, and high electron affinity due their π-electron backbone (Gerard et al. , 2002). The term of “synthetic metals” refers to conductive polymers due their electrical conductivity. Excitement about these polymeric materials is evidenced by the fact that the field of conducting polymers has attracted scientists from such diverse areas of interest as synthetic chemistry, electrochemistry, solid-state physics, materials science, polymer science, electronics and electrical engineering with their applications in solar cells, light weight batteries, electrochromic devices molecular electronic devices and sensors (Manju et al. , 2002). Polyaniline is one of the most compromised intrinsic electrical conductive materials due to its environmental stability, easy to synthesis, good electrical conductivity and uncommon conducting / insulating fast transition by doping / dedoping process and low cost (Bhadra et al. , 2009; Yang et al. , 2010). These capabilities make them ideally suited for use in electrical devices.. In the modern world, plastics and carbenous materials are always tightly integrated. Up to now, most of the studies devoted to the realization of conducting materials using polyaniline and carbenous materials. These materials have been mostly oriented. 3.
(17) towards the synthesis of graphene and polyaniline using insitu polymerization technique, aniodic polymerization technique, electropolymerization technique, etc (Wang et al. , 2009; Gospadinova and Terlemezyan, 1998). Unfortunately, the low efficiency of the functionalization between the polyaniline and graphene, have limited some of their potential applications like sensing, capacitor, actuators, etc (Bai et al. , 2009). This investigation intends to conduct preliminary work towards the functionalization of graphene with the polyaniline. There is much anticipation that growth in the availability of polyaniline / graphene composite materials, and improvements in electrical conductivity, electrochemical activity, thermal properties, will lead to advancements in the field of developing commercially viable sensor, capacitor, etc. II. BACKGROUND a. Conductive Polymers Until about 40 years ago, all carbon based polymers were rigidly regarded as insulators. They were utilized as inactive packaging and insulating material. At the start of the 60's, the research priorities at the Plastics Research Laboratory of BASF in Ludwigshafen, Germany, centered on postulating new structural properties of polymers made by oxidative coupling. Copper chloride and aluminium chloride were used to make oligobenzene from benzene (Shirakawa, 2001). This reaction was extended to include other aromatic compounds and heterocycles. These reaction products were characterized in terms of thermoelectric power, and photo- and dark conductivities. To their surprise polyphenylene and polythiophene showed electrical conductivities of up to 0. 1 S cm-1 4.
(18) (Shirakawa, 2001). Not only was this the highest value yet obtained, but it was the first capable of conducting electricity. Research interest in electroactive polymers started in 1977, when Heeger, MacDiarmid, Shirakawa and their co-workers demonstrated that the conductivity of polyacetylene—the simplest polyene—can be increased by several orders of magnitude by treatment with appropriate oxidizing or reducing agents, the socalled ‘dopants’ (Shirakawa et al. , 1977). These scientists were awarded the Nobel Prize in Chemistry in 2000 for the discovery and development of the so-called ‘conducting polymers’. The award was received giving the following Nobel Lectures: The discovery of polyacetylene film: The dawning of an era of conducting polymers (Nobel Lecture) by Shirakawa (2001); ‘Synthetic metals’: A novel role for organic polymers (Nobel Lecture) by MacDiarmid (2001); semi-conducting and metallic polymers: The fourth generation of polymeric materials (Nobel Lecture) by Heeger (2001).. b. Polyaniline Among the conducting polymers, polyaniline (PAni) is emerging as the material of choice for many applications. Aniline, the monomer of the polynailine, was first obtained in 1826 from the pyrolytic distillation of indigo and was found to produce crystallline salts with sulphuric and phosphoric acid (Wise et al. 1998). Fritsche (1840) isolated colorless oil from indigo and oxidized to PAni (Fritsche, 1840). Lethebey (1862) reported the electrochemical synthesis of PAni when he observed the growth of a blue-green powdery pigment on a platinium anode during the electrolysis of a solution of aniline in sulphuric acid. Lethebey’s findings were verified in nineteenth century investigators, and 5.
(19) the pigment was named “aniline black”. The oxidation of aniline in hydrochloric acid was found to produce a similar product and conductivity of this product was reported by Green and Woodhead at 1910 (Wise et al. , 1950). Letheby’s original observations and findings were confirmed again by Khumotov and Gorbachev in 1950’s (Wise et al. , 1998).. Mohilner et al. , (1962) investigated the kinetics of electrochemical oxidation of aniline in sulphuric acid and deduced that the initial oxidation requires the formation of aniline radical as shown in Figure 1 (Wise et al. , 1998):. Figure 1. Formation of aniline radical. Mohilner et al. , (1962) synthesized the aniline chemically to conclude that the oxidation states of aniline in two basic conversion leucoemeraldine base to emeraldine salt, from emeraldine salt to pernigraniline salt. Emeraldine salt is reported as dark green salt. Chiang and MacDiarmid (1986) proposed representation of conversion of PAni from insulator form to the conductor form by oxidation and reduction as illustrated in Figure 2:. 6.
(20) Figure 2. Representation of polyaniline: from insulator to conductor by oxidation; from conductor to insulator by reduction.. PAni is typically prepared by the chemical oxidation of aniline or anilinium salts, such as aniline hydrochloride or aniline sulfate, in acidic aqueous medium. Ammonium peroxydisulfate (APS) being the most common oxidant (Stejskal et al. 2002; Gospodinova et al. , 1998). Emulsion polymerization route also has been adopted to prepare processible conducting PAni, wherein aniline was polymerized in an emulsion of water and a non-polar or weakly polar organic solvent in the presence of dodecylbenzenesulfonic acid (DBSA) (Österholm et al. , 1993 and Österholm et al. 1994). Kinlen et al. (1998) have followed a slightly different route in emulsion polymerization pathway to prepare PAni salt; i. e. , aniline was oxidized by ammonium persulfate in water, water miscible solvent (2-butoxyethanol) using water-insoluble organic acid (i. e. , dinonylnaphthalenesulfonic acid).. Kinlen et al. (1999) obtained soluble ABA triblock polymers (where A—PAni, B— diamine terminated derivative of polyethyleneoxide, or polypropylene oxide or polydimethylsiloxane or polyacrylonitrile-co-butadiene) by emulsion polymerization 7.
(21) pathway. Stejskal et al. (2002) prepared conducting PAni with the project group at different laboratories. The project has been inspired by an occasionally expressed opinion that “there are as many polyaniline as the number of people who prepare them”, and attempting to check whether to what extent this hypotheses is true. Synthesis was based on mixing aqueous solutions of aniline hydrochloride and ammonium peroxydisulfate at room temperature by oxidation pathway polymerization. Standard polymerizations of aniline have been made by eight individuals from five institutions in five different countries. PAni powders were collected from all the participants at the Institute of Macromolecular Chemistry in Prague, compressed into pellets and subjected to determination of conductivity. The average conductivity was 4. 37 S cm−1. Savitha et al. (2004) reported their finding on synthesis of conducting copolymer poly(aniline-coaminoacetophenone) by emulsion and inverted emulsion methods. By changing the molar feed ratio of aniline and o/m-aminoacetophenone, different compositions of copolymers have been synthesized. Conductivity values of the copolymers were found to be nearly the same and they varied from 1. 6 to 3. 0×10−2 S cm−1. Wang et al. (2006) studied on a novel Zn-PAni dry rechargeable battery. Conducting PAni powder was well mixed with graphite and acetylene black to obtain the optimum conductivity and porosity.. Kim et al. (2007) reported the synthesis procedure of organic soluble PAni preparation by one-step emulsion polymerization pathway, which was carried out in toluene / water solvent system. DBSA was used as the surfactant and acid and APS was used as the oxidant. At the end of the reaction, the toluene layer was separated and analyzed. PAni 8.
(22) film was prepared from PAni solution by either spin coating or roll coating method. Conductivity and transmittance were 2–4×10⁻¹ S cm−1 and >75% for <550 nm thick films, and 1 S cm−1 and 30% for <1 μm thick films. AFM image of PAni film with less than 500 nm thickness shows very homogeneous surface structure and very dense membrane, which suggested that undissolved particles may not be present in PAni solution. Stejskal et al. (2008) studied on reprotonation of polyaniline. PAni base was immersed in aqueous solutions of 42 inorganic or organic acids in order to find out, which was able to constitute a salt with the PAni base and what are the properties of products. The conductivity of the reprotonated PAni bases was determined especially by the pH of acid solutions. The highest conductivity, 1. 22 S cm−1 was found after reprotonation of PAni base with 50% tetrafluoroboric acid. The reaction with most strong inorganic acids yielded samples with a conductivity of 10 −1 S cm−1. Sulfonic acids gave products having conductivity of the order of 10 −2–10−1 S cm−1. Carboxylic acids were less efficient in protonation, and their ability to produce a conducting polymer depended on increasing the acid concentration. Acids containing an acidic hydroxyl group, like picric acid, also protonated PAni to a good level of conductivity. The lowest conductivity, 1. 8 × 10⁻¹⁰ S cm−1 was observed in the absence of any acid.. Most recently Wanga et al. (2009) synthesized electrically conductive core–shell nanoparticles (PAni / PS-PSS) by coating poly (styrene-co-styrene sulfonate) (PS-PSS) nanoparticles with PAni. PS-PSS core particles were prepared in microemulsion system in nitrogen atmosphere and further coated with PAni by using in situ polymerization method at low temperature. The core–shell structure of PAni / PS-PSS composites was 9.
(23) determined by transmission electron microscopy (TEM) and FTIR measurements. In addition, the role of the aniline content was also investigated. The stability of the coated latexes and the conductivity of PAni / PS-PSS pellets were investigated. It was found that the core–shell structure of PAni-coated PS-PSS can be obtained when PAni in PAni / PS-PSS copolymer varies from 2. 78 to 12. 5wt%. The highest conductivity of PAni / PS-PSS pellets was 1. 7 S cm−1. Many reviews about preparation of polyaniline have been published. Bhadra et al. (2009) reviewed all the synthesis, processing and applications of PAni; this study included the advantages of the intrinsically conducting polymers (ICPs) over the other conducting polymers and the superiority of PAni among other ICPs. Details are provided of the different methods used for the synthesis of PAni along with a number of special methods used to obtain a nanostructured PAni. A detailed discussion on the mechanism of electrical conduction in PAni and the factors that influence the conductivity of PAni were also included. Dhand et al. 2011 rewied all the biosensing applications of the PAni.. c. Graphene Carbon nanotubes were major area of materials research until the discovery of the graphene by Andre Geim et al. , Manchester University, United Kingdom in 2004. Although previous attempts to produce graphene had been tried before, they were not successful. Andre Geim thought it might be possible to do something similar to carbon nanotubes, only in an unfolded configuration. He had the idea to polish down a graphite block to just 10 or 100 layers thick and then study the material’s properties. One of his students was assigned the task, and produced a speck of graphite roughly 1000 layers 10.
(24) thick–a little short of the mark. That is when Geim had the idea to use Scotch tape to peel away the top layer. Flakes of graphite come off onto the tape, and the process can be repeated several times to achieve progressively thinner flakes attached to the tape. He then dissolved the tape in solution, leaving him with ultra-thin flakes of graphite: just 10 layers thick. Within weeks, his team had begun fabricating rudimentar y transistors with the material. Subsequent refinements of the technique finally yielded the first graphene sheets. “We fooled nature by first making a three-dimensional material, which is graphite, and then pulling an individual layer out of it, said Geim.. In fact, before graphene isolating, the experimental evidence of existence of the singlenano graphene has been reported in 2001, by Affoune et al. In this study was reported that, it is possible to observe graphene sheets 0. 35-0. 37 nm interlayer distance, by Atomic Force Microscopy. After the achievement of graphene sheets in Science magazine, the studies were continued to know about this novel material. And in many articles has been reported that, graphene is a more one atom thick– perhaps the thinnest material in the universe–and forms a high-quality crystal lattice, with no vacancies or dislocations in the structure. This structure gives it intriguing properties, and yielded surprising new physics. The article entitled “Electric field effect in atomically thin carbon films” is now one of the most highly cited papers in materials physics, and in 2005, by researchers who had succeeded in isolating graphene sheets. But we have to know that also before the experimental discovery of the graphene, the distinct nature of charge carriers in a hexagonal carbon lattice has been speculated upon and was. 11.
(25) proposed to have important implications on the electronic transport in graphitic materials by Novoselov et al. (2004).. The second exciting report, after the isolating the graphene was the discovery of field effect of graphene by Manchester Group.. Novoselov et al. , (2004) reported the. observation of the electric field effect in a naturally occurring two dimensional (2D) material referred to as few-layer graphene (FLG).. They processed the films into. multiterminal Hall bar devices placed on top of an oxidized Si substrate so that a gate voltage (Vg) could be applied. They have studied more than 60 devices with d<10 nm. They focus on the electronic properties of our thinnest (FLG) devices, which contained just one, two, or three atomic layers. All FLG devices exhibited essentially identical electronic properties characteristic for a 2D semimetal, which differed from a more complex behavior observed for thicker, multilayer graphene as well as from the properties of 3D graphite. The observed behavior resembles the ambipolar field effect in semiconductors, but there is no zero-conductance region associated with the Fermi level being pinned inside the band gap. It has been reported measurements can be explained quantitatively by a model of a 2D metal with a small overlap between conductance and valence bands. One of the important points which has been reported, is that Hall resistivity results served as an indicator of the quality and homogeneity of the graphene, and also reported the agreement with the fact that the single layer graphene is in theory a zero-gap semiconductor.. 12.
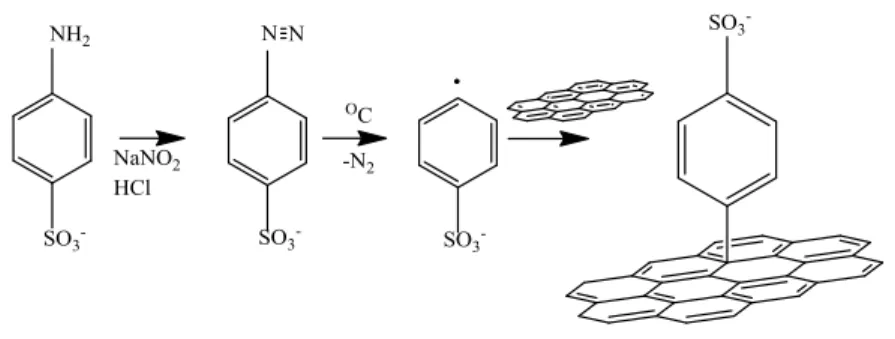
(26) After the discovery of the graphene, various attempts were made to synthesize graphene, graphene oxide, and functionalized graphene. Niyogi et al. (2006) and Stankovich et al. (2006) used ultrasonic dispersions to obtain functionalized graphene. Exfoliation of graphite oxidized with strong acids either by rapid thermal expansion has been worked by Schniepp et al. (2006). Si and Samulski (2008) synthesize watersoluble graphene by sulfonation of graphene oxide. The results indicate that the bulk of the oxygen-containing functional groups were removed from graphene oxide; the electrical conductivity of thin evaporated films of graphene was of 1250 S cm-1. Similarly, Li et al. (2008) worked on aqueous dispersion of graphene.. The chemical structure of the graphene oxide, because of its basal plane is decorated with hydroxyl and epoxy, suggested such a variety of surface-modification reactions to develop the functionalized graphene oxide- and graphene-based materials. Many works have reported on the chemical reduction of graphene oxide ( Stankovich et al. , 2007; Eda et al. , 2008; Becerril et al. , 2008 and Ramanathan et al. , 2008; Zhu et al. 2009) reported the synthesis of readily soluble graphene in organic solvents such as N,Ndimethylformamide and N-methyl-2-pyrrolidinone using diazonium salt functionalization. Lately, synthesis of few layer graphene sheets using chemical vapor deposition method have been widely investigated by Malesevic et al, (2008), Vitchev et al. (2010), and Lee et al. (2010).. Most recently, Chen et al. (2011) prepared the sulfonic functionalized graphene oxide, by some sulfonation routes, for instance, through amide formation between the. 13.
(27) carboxylic group of GO, and amine of sulfanilic acid (AA–GO–SO3−). Zhao et al. (2011) also worked on sulfonated graphene. They reported that sulfonated graphene in aqueous solution is capable of absorbing aromatic pullutants from aqueous solutions.. d. PAni / Graphene composites The studies based on polyaniline and graphite started in 2003. In 2004, it was reported the fabrication and characterization of novel, monolithic electrochemical actuators, based on PAni and a micrometer-sized graphite powder by Li et al. They reported that these PAni–graphite thin films have a graphite-rich layer that renders composite thin film conductive at all redox states. In 2004 also, a facile process for the synthesis of exfoliated graphite and polyaniline / graphite nanocomposite was developed by Du et al. Graphite nanosheets were prepared via the microwave irradiation and sonication from synthesized expandable graphite. The nanocomposites were fabricated via in situ polymerization of aniline monomer in the presence of graphite nanosheets. According to the results, electrical conductivity measurements indicated that the conductivity of final PAni / graphite nanocomposites increased greatly compared with pure PAni. The conductivity of the nanocomposite with only 1. 5wt% graphite nanosheet was 33. 3 S cm-1, which was six times greater than that of neat PAni (about 5 S cm-1).. Bourdo and Viswanathan (2005) studied the synthesis and characterization of graphite / polyaniline composites. They found that the exploration of graphite / PAni composites yielded conducting composites which exhibited conductivities greater than the graphite. 14.
(28) or PAni alone. Lately, in 2007, the characteristics of polyaniline / graphite composites were studied in aqueous electrolyte. The PAni / graphite films, with different graphite particle sizes were deposited on a platinum electrode by Ghanbari et al. to make batteries. To compare two types of batteries were fabricated: Zn-PAni / graphite and Zn-PAni. Studies on the Zn-PAni / graphite cell clearly demonstrated the viability of using this composite as an active electrode material. The Zn-PAni / graphite batteries, according to the number of key factors such as capacity, columbic efficiency and specific energy were improved compared to other works, and the performance of the cell was found to be better than that of the Zn-PAni battery.. More lately, Wang et al. (2009) studied the synthesis of graphene oxide doped polyaniline for supercapacitors. It has been reported that a novel high-performance electrode material based on fibrillar polyaniline (PAni) doped with graphene oxide sheets was synthesized via in situ polymerization of monomer in the presence of graphene oxide, with a high conductivity of 10 S cm−1 at 22°C for the obtained nanocomposite, with a mass ratio of aniline / graphite oxide, 100:1. Zhao et al. , (2009) prepared transparent, conductive and uniform graphene used them as electrodes of the electrochromic devices of polyaniline. It was reported that PANI was synthesized by chemical oxidation of aniline with ammonium persulfate at 0°C. An aqueous dispersion of GO was produced by the Hummers’ method, and purified through dialysis and centrifugation. The GO sheets were deposited on pretreated hydrophilic quartz substrates by the dip-coating method for preparing the electrodes. PAni was spincoated onto graphene electrodes to fabricate electrochromic electrodes, named as PAni15.
(29) graphite electrodes. To compare also PAni spincoated onto ITO slides, the electrodes were characterized by CV for electrochemical activities, and by Spectroelectrochemistry for optical properties. According to the results, the performances of the electrochromic devices with graphene electrodes exhibited slight decrease upon voltage switching, while those of the devices with ITO electrodes decreased dramatically. After 300 cycles, the electrochromic devices with graphene electrodes showed much larger optical contrast, and shorter switching time than those of the devices with ITO electrodes.. More recently, graphene nanosheet (GNS) / PAni composite was synthesized using in situ polymerization by Yan et al. (2010). According to the results, the GNS / PAni composite exhibited more electrochemical active sites compare to the graphene and PAni itself. Yang (2010) studied graphene nanosheet / carbon nanotube / polyaniline (GNS / CNT / PAni) composite. It was reported that the CNTs used as conductive wires between GNS and PAni particles, produced highly conductive composites.. To exploit the potential and to enhance the electrical conductivity, PAni / graphene based materials have been prepared via different synthesis. Wang et al. , (2009) prepared graphene / polyaniline composite by in situ anodic electropolymerization of aniline on graphene paper. Firstly, graphene paper on cellulose membrane was obtained. by. vacuum. infiltration. of. graphene. suspension,. then. aniline. was. electropolymerized on the graphene paper by in situ anodic electropolymerization to form PAni. This composite paper combines flexibility, conductivity, electrochemical 16.
(30) activity, and exhibits gravimetric capacitance of 233 F g -1. Zhang et al. , (2010) synthesized chemically modified graphene and polyaniline nanofiber composites by in situ polymerization of aniline monomer in the presence of graphene oxide. The obtained graphene oxide / PAni composites were reduced to graphene using hydrazine followed by reoxidation and reprotonation of the reduced PAni to give the graphene / PANI nanocomposites. The specific capacity of the material was recorded as 480 F g-1. Wang et al. (2010) also prepared graphene / PAni hybrid material as a supercapacitor electrode. The composite was synthesized by three-step in situ polymerization; the first step, started by the synthesis of graphene oxide / PAni composite through in situ polymerization; in the second step, graphene oxide was reduced. and in the third step, PAni was dedopped. A high specific capacitance of 1126 F g -1 was obtained. More recently, Hao et al. (2010) fabricated sulfonated graphene / polyaniline nanocomposites by liquid / liquid interfacial polymerization. In the fabrication process firstly, graphene oxide was reduced and treated by diazonium salt of sulfanilic acid to form sulfonated graphene (SGr). An aqueous mixture of sulfonated graphene as the water phase and aniline in chloroform as the oil phase were used to synthesis SGr / PAni composites through interfacial polymerization. Lately, Feng et al. (2011) explored the new one-step synthesize to obtain PAni / graphene composites by electrochemical synthesis by using GO and aniline as the starting materials. The aniline monomer and GO were first mixed, and then casted onto ITO. CV was run, and aniline monomer was oxidized and polymerized on the surface of GO and GO was reduced to graphene at the same time. Furthermore, the composite was directly used as the supercapacitor electrode. This supercapacitor showed a high specific capacitance of 640 F g. −1. .. 17.
(31) III. JUSTIFICATION. Since the first report on the isolation of graphene, it has become a top area of research in materials science. Nowadays, graphene is one the most attractive nanomaterials because of its excellent electrical, thermal, optical properties. It has also been reported that it is the thinnest known material and the strongest ever measured. On the other hand, because of its environmentally stability, low cost of raw materials and ease to synthesis, PAni is the most intensively investigated intrinsically conducting polymer. Its electrically conductive form is found to be difficult to process; thus, in order to diversify these difficulties PAni can be mixed with other materials to obtain new composites with novel properties. Therefore, the nanocomposites of the PAni / graphene are expected to have improved conductivity and increased electroactivity. As a result, the present study pretends to contribute to the exhaustive investigations of electrically conductive polymers performed in the last years. Besides, it will also contribute to open the niche to fabricate new PAni / graphene nanocomposites for sensor, or capacitor devices. It is expected that this work will serve as a motivation of further studies for keeping on finding out different methods to functionalize graphene with electrically conductive polymers, to develop new types of electroactive materials.. IV. HYPOTHESES Through the incorporating technique of graphene oxide to leucoemeraldine salt of polyaniline, we would be dopping the polyaniline while reducing the graphene oxide to graphene, thanks to the oxygen functionalities on the surface of the graphene 18.
(32) oxide. This technique makes easy the synthesis of PAni / graphene composites because of no longer reduction step is required. By this technique, we would be dopping the polyaniline by functionalized graphene. Consequently, the PAni / graphene composites will show both improved electrical conductivity and high electroactivity. In addition, it is expected that this materials show capacitance property.. V. OBJECTIVE Developing the methodology to synthesize electroactive and highly electrical conductive composites based on PAni and Graphene.. Particular Objectives . Developing a reproducible method to modify graphite to graphene oxide using the Hummer´s method.. . Characterization of the physical properties of the graphene nanosheets and modified graphene via infrared and Raman spectroscopy.. . Synthesize of leucoemeraldine salt of polyaniline.. . Synthesize polyaniline / graphene composites through: o Incorporation of graphene oxide, as the doping agent, to leucoemeraldine salt of PAni.. 19.
(33) o In situ polymerization of polyaniline in the presence of the sufonated graphene. . Characterization of the physical properties of the polyaniline / graphene composites. through. infrared. spectroscopy,. UV-vis. spectroscopy,. cyclic. voltammetry, and conductivity measurements through the four-probe method.. 20.
(34) CHAPTER II VI. THEORITICAL ASPECTS POLYANILINE The polyanilines are a class of organic polymers with an alternating ring –heteroatom backbone structure. A wide variety of derivates can be synthesized by the substitution on the benzene ring, or on the nitrogen atom. It can exist in at least six different forms, both salt and base versions of leucoemeraldine, emeraldine and pernigraniline. Leucoemeraldine is fully oxidized, emeraldine is half-oxidized and half-reduced, and pernigraniline is fully reduced. Figure 3 illustrates the chemical structures of four oxidation states of polyaniline (Wallace et al. 2002). The production of polyaniline fibers would be rather simple if processing could be achieved with the most desired oxidation state, emeraldine salt (PAni-ES). However, the insolubility of PAni-ES, the only conductive form of polyaniline, requires an alternative approach to processing. Hence, the total process involves the conversion of emeraldine base to leucoemeraldine base and eventually to emeraldine salt. This procedure will be explained in detail when discussing the synthesis.. 21.
(35) Figure 3. Conversion mechanism of polyaniline. Polyaniline Synthesis The conventional synthesis of polyaniline and its morphology has been given in the Figure 4. The oxidative polymerization reaction of aniline is typically carried out in an acidic solution (e. g. , 1 M HCl). The prepared polyaniline is in its doped emeraldine form, which can be de-doped by a base to its emeraldine base form.. 22.
(36) Figure 4. The conventional synthesis of polyaniline The doping mechanism of polyaniline and the conductivity. In polyaniline, protonic acid doping involves the addition of protons to the polymer backbone. The resulting positive charge is balanced by negatively charged anions transferred from the doping agent, which is an aqueous and acidic solution. Protonation also introduces a delocalization of a radical cation, termed a polaron. A polaron is essentially a charge carrier with a surrounding field of polarization. An increase in doping levels is accompanied by the formation of a bipolaron, which is a pair of polarons. This formation reduces the aforementioned band gap between the valence band and the conduction band, making actuation possible (Bredas et al. 1984). In polyaniline, optimum level of doping are accompanied with an increase in conductivity. Therefore, the PAni must be subjected to doping in order to achieve conducting forms.. GRAPHENE In 1859, the British chemist B. C. Brodie explored the structure of graphite and the reactivity of flake of graphite. Throughout his studies, Brodie was interested in the 23.
(37) molecular formula of ‘‘graphite’’ and its discrete molecular weight. Ultimately, he determined the molecular weight of graphite to be 33, saying: ‘‘This form of carbon should be characterized by a name marking it as a distinct element. I propose to term it Graphon. ’’ Nearly 150 years later, ‘‘graphene’’ would take the physics and chemistry communities by storm.. Structural Features Graphene is a single layer of carbon atoms tightly packed into a two-dimensional honeycomb lattice. Graphene is part of the family of atomic "nano-carbons" that includes diamond, carbon nanotubes, buckeyballs (C60 fullerenes), and is a single or a few atomic layers of the three-dimensional material graphite. In these materials, carbon bonds are bonded in different manner. In diamond each atom is bonded tetrahedrally, in fullerenes carbon atoms bend the sheet into spheres, ellipses, or cylinders. The buckyballs are large molecules formed completely of carbon bonded trigonally; carbon nanotubes are structurally similar to buckyballs, except that each atom is bonded trigonally in a curved sheet that forms a hollow cylinder (Figure. 5). Graphite has a layered, planar structure. In each layer, the carbon atoms are arranged in a hexagonal lattice (Figure. 6).. 24.
(38) M Figure 5: All graphitic forms. Figure 6: TEM images and hexagonal atomic arrangement of graphene nanosheets. Conductivity in Graphene Graphite can conduct electricity because of the vast electron delocalization within the carbon layers (a phenomenon called aromaticity). These valence electrons are free to move (Figure. 7), so are able to conduct electricity (Zhu et al. , 2010). However, the electricity is primarily conducted within the plane of the layers. Thus, at the moment graphene is the most widely studied carbon based material for its remarkable electronic transport properties (Singh et al. , 2011).. 25.
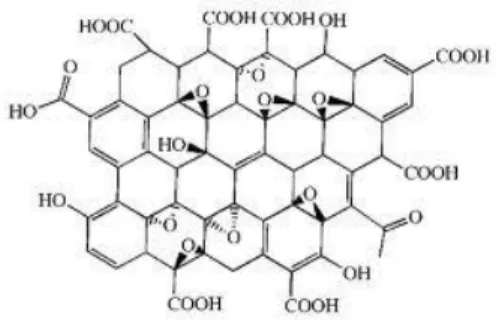
(39) Figure 7. Electron hopping mechanism in valence electrons of graphene From graphite to graphite oxide, from graphite oxide to graphene In recent years, various synthetic approaches have been pursued to prepare graphene nanosheets. Among the various strategies pursued, the reduction of graphite oxide (GO) is one of the most promising methods (Tung et al. , 2009). Graphite oxide, formerly called graphitic oxide is a compound of carbon, oxygen, and hydrogen in variable ratios, obtained by treating graphite with strong oxidizers (Dreyer et al. , 2010). The mechanism of graphite oxide by oxidizers is mainly the generation of oxygencontaining groups on the graphene sheets as seen in the Figure 8 and 9.. 26.
(40) Figure 8. Graphite oxidation. Figure 9. Oxidized graphite. Graphite oxide contains oxygen functionalities but remains stack structured, similar to graphite with much wider spacing due to water intercalation. Graphite oxide reduction was probably historically the first method of graphene synthesis. Reduction as known is decrease in oxidation state. So, a reducing agent is used to reduce / eliminate the oxygen-containing group on the graphene sheets. The reducing agents creates basic media, which weaken the platelet–platelet interaction owing to its hydrophilicity (Dreyer et al. , 2010). Reduction is realized by most of the time with reducing agents, heating, and ultrasonication. In graphene, rather than retaining a stacked structure, the material is exfoliated into monolayers or few-layered structure due to greatly weakening of the surface functionality between layers. Reduction of graphite oxide monolayer films e. g. by hydrazine (Figure. 8), annealing in argon / hydrogen, sodium hydrite, hydrochinone, p-phenylene diamine, strongly alkaline solution, supercritical water, H2-plasma, electrochemical reduction was reported to yield graphene films (Eda and Chhowalla, 2010). However, the quality of graphene produced by graphite oxide reduction is lower 27.
(41) compared to e. g. scotch-tape graphene due to incomplete removal of various functional groups by existing reduction methods.. Functionalization of Graphene The recent advancement in bulk synthesis processes of graphene oxide and reduced graphene oxide has generated great interest to incorporate such unique material into various polymer matrices. Several challenges need to be overcome to realize graphene or graphene oxide based polymer composites e. g. functionalization of graphene sheets, homogeneous dispersion of materials with minimal restacking, effective mixing of graphene oxide and graphene with polymer.. Taking into account that GO has carboxylic, hydroxyl and epoxy groups on the surface, which improve its dispersion in water, and keep individual layers separated from each other (Figure 10), the functional groups introduced to graphene, can be used to achieve good dispersion of derived graphene in different solvents. Numerous efforts have been made to improve the dispersion of GO and RGO by functionalizing the use of organic molecules compatible with the polymer matrix to enhance interfacial interaction with the matrix (Stankovich et al. , 2007).. 28.
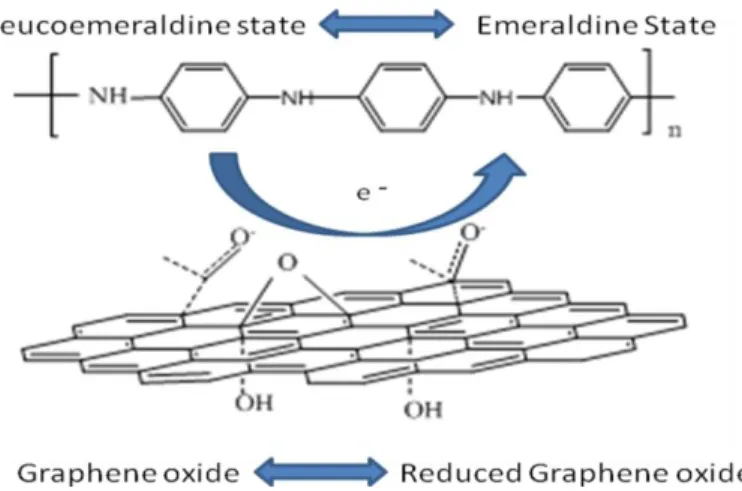
(42) Figure 10. Reducing graphene by hydrazine. POLYMER / GRAPHENE COMPOSITION In this work, two types of polymer / graphene composites are reported. According to the first method, simultaneous reduction of graphene oxide occurs while simultaneous oxidation of polyaniline is occurring (Figure. 11). This donor-acceptor interaction between the leucoemeraldine salt of polyaniline and graphene oxide can be explained by charge transfer between materials (Vallés et al. , 2011). The synthesis mechanism exhibits an unprecedented donor–acceptor interaction at the interface between GO sheets and the leucoemeraldine state of polyaniline. A conceptual explanation is proposed in which GO plays a dual role as electron acceptor and as large counterion for polyaniline.. 29.
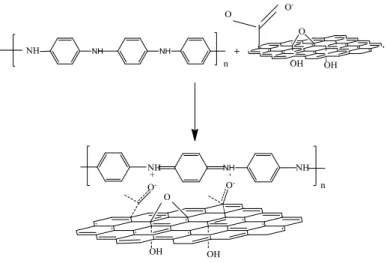
(43) According to the second method, the modified graphene sheets, was incorporated into the PAni matrix during the in situ polymerization synthesis of the PAni / graphene composites as seen in the Figure 12.. Figure 11. Simultaneous oxidation of polyaniline. Figure 12. Incorporation of the sulfonated graphene onto PAni. 30.
(44) VII.. EXPERIMENTAL SECTION. Materials GO was synthesized from natural graphite powder (Sigma-Aldrich) via HummersOffeman method by sulfuric acid (H2SO4, 99%, Panreac), potassium permanganate (KMnO4, Panreac), hydrogen peroxide (H2O2, Panreac) and sodium nitrate (NaNO3, Sigma-Aldrich). GO reduced by hydrazine (N2H4, Aldrich Co. ) Sulfonated graphenes were synthesized by sulfanilic acid (99%, Sigma-Aldrich), amino-4-hydroxy-2naphthalenesulfonic acid (99%, Fluka) and isopentyl nitrite (Sigma-Aldrich). Aniline (Sigma-Aldrich) was purified by distillation under reduced pressure prior to use. Polyaniline is polymerized by HCl (37%, Analar NORMAPUR) and ammonium persulfate (APS, Sigma-Aldrich). Buffer solutions were prepared by potassium dihydrogen phosphate (KH2PO4, Sigma-Aldrich), acetic acid (CH3COOH, Jaber Ind. ), and sodium acetate (CH3COONa, Aldrich) and sodium chloride (NaCl, Scharlau).. Experimentation General procedure for the synthesis of graphite oxide by Hummer´s method: The graphite oxide was synthesized from powder graphite by the fallowing procedure (Hummer´s method): 10 g of natural graphite flake powder was mixed with 5 g sodium nitrate in 0. 2 L of H2SO4. The mixture was cooled to 00C in an ice bath, while stirring 30 g of KMNO4 was added to the suspension gradually to avoid the temperature exceeding 20°C. The ice bath was removed, and 0. 4 L of distilled water were added. 31.
(45) slowly to the mixture, which results in effervescence and an increase in temperature to 980C. The brown colored suspension was maintained at this temperature for 15 min. The suspension was diluted to 1. 4 L of 3% H2O2 in warm water, followed by filtration and washing using 1 L of H2O. The filtered cake was dried by vacuum to use in further process and stored until needed for experimentation.. Method 1: General procedure for the synthesis of emeraldine salt of PAni In this procedure, 9. 3 mL of aniline was dissolved in a 1 M HCl / water solution (80 mL). The solution was cooled to 0-5ºC in an ice bath, and the oxidant, ammonium peroxydisulfate, (NH2)4S2O8, 5. 7 g in 20 mL) was added to launch polymerization. The polymerization was left to occur under vigorous stirring at 0°C for 3 h. The product was filtered and washed with water, followed by drying under vacuum.. Synthesis of chemically reduced PANI (leucoemeraldine salt of PAni): Here, 1 g of PAni was dispersed in 100 mL, 1 M solution of NH3. The dispersion was stirred under nitrogen atmosphere for 96 h. Then filtered and washed several times by deoxygenated distilled water by vacuum.. 32.
(46) Synthesis of PAni / reduce GO (RGO) The GO obtained by the Hummer´s method was dispersed in distilled water at a concentration of 50 mL / mg. Chemically reduced PAni (leucoemeraldine state) was added to the GO dispersion. The mixture was heated at 60°C for 3 h and mixed by magnetic stirring for 24 h. After this time, the material was filtered and washed several times. The solid was left to dry. The PAni / GO composites were prepared by different mass ratios: 75:10, 75:20, 75:30, or 75:50, and resulting composites were respectively named as PAni / RGO 100, PAni / RGO 200, PAni / RGO 300, and PAni / RGO 500.. Preparation of PAni / GO composites For comparison purposed, composites of PAni / GO were prepared by in situ polymerization of aniline in a graphite oxide dispersion. First, 2 g of graphite oxide was dissolved in 100 mL of distilled water and sonicated for 30 min. Next, 9. 3 mL of aniline and 9. 87 mL of HCl were added and mixed vigorously. The dispersion was cooled to 0-5ºC in an ice bath and ammonium peroxydisulfate (5. 7 g) was added to launch the polymerization. The mixture has allowed stirring at room temperature overnight. The composite was collected by filtration and washed several times by distilled water, 0. 1 M ammonium solution and finally with a 1 M HCl solution. The composite was dried at 60oC in a vacuum oven. 33.
(47) Method 2. Preparation of sulfonated graphene (SGrf). GO (1 g) was dispersed in 250 mL of ultrapure water in a round-bottomed flask and then, sonicated for 30 min. Next, 5 mL of 50% hydrazine solution was loaded and heated to 90ºC for 3 h. The material was filtered and washed repeatedly with water. The solid was dissolved in 250 mL of buffered solution at pH 8 to avoid precipitation, and 5. 04 g of sulfanilic acid and 3 mL of isopentyl nitrite were subsequently added. The reaction flask was kept at 80ºC under magnetic stirring overnight. After cooling at room temperature, the product, called as GSA was filtered, and washed with abundant water. The. procedure. was. repeated. for. the. sulfonation. with. amino-4-hydroxy-2-. naphthalenesulfonic acid (6. 97 g) and the product was called as GNSA.. Synthesis of PAni/ sulfonated graphene (PAni/ SGrf) The composites were prepared by polymerization of aniline in a solution containing dispersed SG. Briefly, 0. 1 g of GSA was dispersed in 100 mL of water and treated with ultrasound for 20 min. Then, 9 mL of HCl and 9. 3 mL of aniline were added. The dispersion was cooled to 0-5ºC in an ice bath and ammonium peroxydisulfate (5. 7 g) was added to launch the polymerization. The polymerization was left to occur under vigorous stirring at 0ºC for 3 h. The product, called as GSA / PAni was filtered and washed with water, followed by drying under vacuum. The same procedure was employed for the preparation of PAni and GNSA and the material was called as PAni / GNSA. 34.
(48) VIII.. CHARACTERIZATION. INFRARED SPECTROSCOPY An infrared spectrophotometer (Spectrum One FTIR, Perkin Elmer) was used to collect spectras in transmission mode at a resolution of 4 cm-1. The samples of the synthesized materials were prepared in pellets with potassium bromide (KBr).. UV-VIS SPECTROSCOPY. An UV-VIS spectrophotometer (Spectrum One FTIR, Perkin Elmer) was used to collect spectras in absorption mode from 200 to 700 nm. The powder materials were dissolved in NMP solution (1 mg/1 mL).. RAMAN SPECTROSCOPY. A Raman system (InVia Raman microscope, Renishaw) was used, employing a grating spectrometer with a Peltier-cooled charge-coupled device (CCD) detector coupled to a confocal microscope. All spectra were processed using the Renishaw WiRE 3. 2 software. The Raman scattering was excited using an Argon ion laser with wavelength of 514. 5 nm. The laser beam was focused on the sample with a 100x microscope objective (NA = 0. 85), with a laser power at the sample of < 2 mW.. 35.
(49) TEM. The JEOL JSM-7401 F Field Emision transmission electron microscope with ultra high vacuum and 1 nm resolution was used to characterize both morphologies and elemental anlayse of the samples. Sample preparation was performed by dispersing 0. 1 g of sample in 50 ml of distilled water. The diluted dispersion was sonicated for 5 min to break apart sample agglomerations; afterwards, a drop of the dispersion was placed on a holey-carbon-cooper-grid. .. TGA TGA analysis was achieved using a TA Instruments TQ-50. Samples for analysis were prepared taking required amount to evoporate in the oven. Then, approximately 10 mg of sample were weighed and put into aluminium cups. The characterization was performed using nitrogen atmosphere at heating rate 10 °C min-1 from ambient temperature to 900 oC.. CYCLIC VOLTAMMETRY. The electrochemical measurements were conducted using screen printed electrodes in a DropSense cyclic voltammeter potentiostat. For sample preparation, 0. 01 g of samples was dispersed in 5 m L of N-Methyl-2-pyrrolidone (NMP). Then, 2μL of each solution were drop casted onto to the carbon working electrode and dry under vacuum.. 36.
(50) The electrolyte employed were HCl and buffered solutions of pH 2, 3, 5, 6. In the buffered solutions, 1 M of NaCl was added to maintain the ionic strength constant.. CONDUCTIVITY MEASUREMENT BY FOUR-PROBE TECHNIQUE DC-Conductivity measurements were carried out using the four-probe method on rigorously dried pellets. The measurements were carried out using a four-probe setup equipped with a dc current source (LCS-02, Scientific Equipment & Services) and a digital micro-voltmeter (DMV-001, Scientific Equipment & Services). Prior to conductivity measurements, the polymers were redoped by 100 mL of 0. 1 M HCl under magnetic stirring. Before being filtered, washed with distilled water and dried under vacuum. Two types of PANI/SGrf (PANI/GSA and PANI/GNSA) and PAni/RGO composites of different mass ratio stored until needed for characterizations.. Electrical conductivity of the pressed pellets were calculated by potential-current data taken by four probe method using the Eq. 1 (Smiths, 1958). . . V . V . ln 2 t I 4.5324t I . (1). Where V is the potential, I is the current, and t is the thickness of the pellets.. To calculate the resistivity of a sample of finite width and non-negible thickness; the equation (1) should be multiplicated with the correction factors f1 and f2 (Eq. 2):. V . V . t f1 f 2 4.5324t f1 f 2 I ln 2 I . (2). 37.
(51) Where ;. s is the finite thickness correction for the insulating bottom-boundary pellets,. f1 f11 t. where s is the probe spacing and;. d f 2 f 2c s 13).. f 11. and. is the finite width correction, where d is the diameter of the pellets (Figure. f 2c. values were obtained as described from graphics given by Smiths. (1958). Figure 13: Four probe method. 38.
(52) CHAPTER III IX. RESULTS AND DISCUSSION In the presented work two different experimental systems were studied.. PART 1. In the first part it is depicted the experimental observations of the aformentioned mechanism as it is proposed: The donor-aceptor interection between RGO sheets and PAni, while PAni in its leucoemeraldine state and graphene is oxided.. POLYANILINE / RGO COMPOSITES Leucoemeraldine state of PAni obtained after polymerization of aniline can be oxidized to emeraldine state easily due to its instability. In the presence of GO, with expected electron transfer polyaniline is oxidized, and GO may be reduced. , as seen in the Figure. 14.. 39.
(53) Figure 14: Proposed equation of oxidation of leucoemeraldine state of PAni by reduction of GO. POLYANILINE/GO COMPOSITES In the same way, negatively charged GO sheets can perform as the doping agent of polyaniline, as seen in the Figure. 15:. Figure 15. GO dopped polyaniline (PANI/GO). 40.
(54) 1. UV-VIS and FT-IR spectra The spectra of the samples in N-methyl-2-pyrrolidine (NMP) solutions are showed in Figure. 16. The concentration of the samples was 0. 1 mg mL-1 in all cases. The spectrum of PAni shows two bands. The band at 320 nm is assigned to the ᴨ to ᴨ * transition in the aniline ring. The band at 600–650 nm is assigned to the “exciton” transition of the quinonimine, and is related to the intra-chain hopping (Ginder et al. , 1990). The spectra of the Leucoemeraldine / RGO resembles that of PAni. The first signal appears at a smaller wavelength than PAni. It may due to steric effects between graphitic domains, which are less conjugated. The second band appears at longer wavelength than in the pure PAni. This little shift can be explained by the deprotonation of leucoemeraldine by dissociation of the carboxylate anions on the surface of the GO (Barbero et al. , 2004). In completely reduced leucoemeraldine, this polaron bands would not be displayed, but a unique absorption band around 340 nm (Valles et al. , 2011).. The spectrum of the GO shows the typical unique absoption band at 230 nm. This band shifted to longer wavelengths in leucoemeraldine / RGO, indicating that the electronic conjugation within the reduced graphene sheets was revived upon reduction of graphene oxide (Li et al. , 2008). Uv-spectrum points the leucoemeraldine state of polyaniline oxide, and the interaction between polyaniline and GO .. 41.
(55) Figure 16. UV-VIS spectra of the PAni, PAni / RGO, and GO samples FT-IR spectra of PAni, GO, PAni / RGO and PAni / GO were recorded in the region of 4000-450 cm-1 at ambient temperature, Figure. 17.. Figure 17. FT-IR spectra of pure PANI, GO, PANI/RGO and PANI/GO. 42.
(56) According to the theoretical results of peak positions, the broad peak at the frequency of 3500 cm-1 and the weaker peak at the frequency of 2900 cm-1 indicate the N–H modes of N–H stretching in PAni spectra (Coskun et al. , 2012). For the pristine PAni, the absorption peaks located at 1600 and 1500 cm-1 are respectively ascribed as C=C stretching deformation of quinoid and benzenoid units of emeraldine salt. The peaks at the frequency of 1305 and 1260 cm–1 correspond to the C=N and C–N–C stretching modes in the benzenoid and quinoid imine units, respectively ( Quillard et al. , 1994). When PAni was converted to PAni / GO, the peaks at 1600 and 1500 cm-1 became sharper. And the peak at 1260 cm-1 became weaker. This can be attributed to the π–π interaction between the two components, as well as hydrogen bonding.. The intensive peak at around 1150 cm-1 is attributed to C–N stretching for the benzonoid ring. (He, 2005). The peaks at 750, 600, and 500 cm-1 are assigned to C–H stretching mode. For GO, the characteristic vibrations include the broad and intense peak at 3450 cm-1, which was attributed to O–H groups, highly saturated C=O peak in carboxylic acid and carbonyl moieties at 1700 cm-1. The peaks at 1400 and 1250 cm-1 were attributed respectively to C–OH and C–O–C groups. The sharp peak at 1070 cm-1 and the weaker peak at 850 cm-1 was assigned to C–O stretching in C–OH functional groups and aromatic C–H peak, respectively (Wang et al. , 2009). The peak centered at 1590 cm-1 was assigned to adsorbed water, but it may be also related to the presence of components from skeletal vibrations of unoxidized graphitic domains (Yan et al. , 2010).. 43.
(57) In the PAni / RGO composite, considering basic repeating monomer unit of PAni, new peaks were attributed to RGO. Comparing to PAni / GO composite in the spectrum of PAni / RGO the intensity of the OH peak at the frequency of 3200 cm-1 and the intensity of the C=O peak at 1700 cm-1 become weaker. It is the evidence of the removal of the oxygen functional groups. In the spectrum the peaks between 1100 and 1650 cm-1 are associated to the stretching vibrations of both double and single CN and CC bonds, and the stretching of CH bonds of the PAni.. By comparison, the spectra of the PAni / GO and PAni / RGO composites illustrate the obvious presence of PAni characteristic vibrations, suggesting PAni can be successfully presented on the GO and RGO surfaces.. 2. Cyclic voltammetry The characterization processes of cyclic voltammetry (CV) involve redox reactions, which are based on the transfer of electrons from a reductant to an oxidant. To further confirm the electrochemical activity of the PAni composites and asses the protonationoxidation states of the PAni, the electrochemical properties of the composites were characterized by this technique. CV was run on the PAni and PAni / RGO in electrodes.. 44.
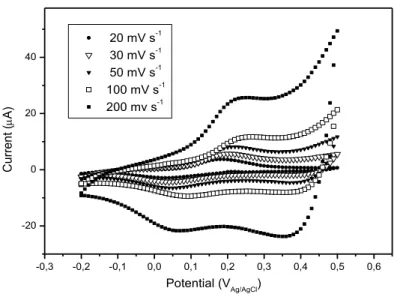
(58) PANI PANI/RGO 100 PANI/RGO 200 PANI/RGO 300 PANI/RGO 500. 25 20. Current (A). 15 10 5 0 -5 -10 -15 -0,3. -0,2. -0,1. 0,0. 0,1. 0,2. 0,3. 0,4. 0,5. 0,6. Potential (VAg/AgCl). Figure 18. Voltammograms at 100 mV s-1. Both PAni and other electrode materials show a redox pair, which mainly results from transition of the PAni leucoemeraldine form to its conducting state, which is the emeraldine form as seen in Figure 18. The peaks show that PAni / RGO composites are electrochemically active. The peak positions of the graphene based materials are down shifted. It can be ascribed as the effect of the changing in PAni structure doped by graphene based materials. The electrochemical performances have been affected by the mass ratio PAni : RGO. According to the Figure, PAni / RGO 100 exhibits closer electrochemical performance to PAni. In Figure 15, the electrochemical performance of the PAni / RGO 100 electrode material was analyzed at 20, 30, 50, 100, or 200 MV s-1 scan rates.. 45.
(59) -1. 20 mV s -1 30 mV s -1 50 mV s -1 100 mV s -1 200 mv s. Current (A). 40. 20. 0. -20. -0,3. -0,2. -0,1. 0,0. 0,1. 0,2. 0,3. 0,4. 0,5. 0,6. Potential (VAg/AgCl). Figure 19. Cyclic voltammograms of the PAni / RGO 100 composite at different scan rates The specific capacitance of the electrodes was calculated according to Eq 3: (Wang et al. , 2010): C=(∫ I dV) / (v m V). (3). Where the C is capacitance (F g-1), I is the current density (A g-1), v is the potential scan rate (mV s-1), m is the mass of the electroactive materials in the electrodes and V is the potential. As shown in Figure 18, the area of the positive part of the CV curves was used for specific capacity calculation. According to this equation, the calculated specific capacitances of the PAni / RGO materials was 20 mV s-1. The scan rates are listed in the Table 1. These values are lower than pure PAni specific capacitance (117. 7 F g-1) and those given by Wang et al. (2010) due to the different route of synthesis.. 46.
Figure

+7


Documento similar