1
Potential and Analysis of an Osmotic Power Plant in the Magdalena River
Using Experimental Field-Data
Jacobo M. Salamanca*
Department of Systems Engineering and Automation University of Valladolid, Valladolid, Spain
e−mail: [email protected] Óscar Álvarez-Silva
Department of Physics and Geosciences Universidad del Norte, Barranquilla, Colombia
e−mail: [email protected] Fernando Tadeo
Department of Systems Engineering and Automation University of Valladolid, Valladolid, Spain
e−mail: [email protected]
Abstract
The Magdalena River mouth in Colombia is studied as a candidate site for a renewable power plant via osmotic energy technology, using pressure retarded osmosis. This power generation plant would operate through the controlled mix of two flows with different salinities (river water and sea water in this case study). A preliminary design of a pressure retarded osmosis power plant is proposed here by means of experimental data acquisition on-site at the river mouth. The obtained net power production is shown to reach 6 MW, with adequate membrane power densities above 5 W/m2. These promising results consider energetic losses involved in the process, which have been further analysed to propose improvement targets in pretreatment processes and membrane permeability.
Keywords
Osmotic Energy, Pressure Retarded Osmosis, River Mouths, Renewable Energies, Membrane Processes
1. Introduction
Increasing global population and energy demands in its current trend will inevitably result in global warming and depletion of natural resources [1]. The anthropogenic origin of this global warming and its consequential forthcoming climate change needs to be acknowledged and mitigated [2]. In this context, research for renewable energy techniques is of the utmost importance for a sustainable future [3], in order to reduce the dependency on fossil fuels as the major energy source [4].
Water resources and its availability and uses are slowly becoming a critical issue as well, and are deeply connected to the energy sector [5]. Both water and clean energy are involved in
2
salinity gradient energy (SGE) processes. This relatively new group of technologies (also known as osmotic processes, osmotic energy, blue energy) address the possibility of producing renewable electrical energy through the controlled mix of two water streams with different osmotic pressures, that is, mainly but not only, different salt contents. The availability of two streams with a high salinity gradient across them is found naturally at river mouths [6], though it can appear in other environments, such as hypersaline systems, in which bodies of water with high salinity (e.g. the Dead Sea) are involved [7]. Another natural system gaining scientific attention more recently are geothermal wells. A project combining osmotic and geothermal power is in development in Denmark [8]. Some industrial processes offer this possibility as well, especially in the desalination industry, due to the production of brines as residue, which could instead be regarded as a by-product [9]. This approach could also be extended to other industry sectors if other residual water streams were to be considered, such as treated sewage water [10].
Salinity gradient energy technology has shown much growth since Pattle’s approach in 1954 [11], when idea of the untapped potential of salinity gradients was first considered, although it did not receive much attention until years later. Economic instability and the increase of oil prices drove the scientific community to search for alternative energy sources [12]. In 1974 Loeb presented pressure retarded osmosis (PRO) [13]. Pressure retarded osmosis is a membrane process in which a low salinity water stream (feed) and a pressurized high salinity stream (draw) are made to interact through a semipermeable membrane. Water is selectively allowed to flow from the feed side through the membrane towards the draw side. This results in an increment of the amount of pressurized water, which can be used afterwards in a turbine to produce electricity.
This paper concentrates on PRO [14], but it is not the only technology that aims to exploit salinity gradients. Reverse electrodialysis (RED) is receiving similar attention. RED is also a membrane process, on which two types of membranes (anion exchange and cation exchange membranes) are placed alternatively forming a stack, with both feed and draw streams flowing in between. This configuration creates a difference of potential over the two types of membranes, which can be connected to provide electricity [15]. It is worth noting that the electrical energy extracted is done directly, whereas PRO needs a converter (e.g. turbine). A third group of technologies is capacitive mixing. This does not employ membranes, but electrodes instead, which are immersed alternatively in the ionic feed and draw solutions following a charge-discharge cycle, which is thermodynamically similar to a heat engine [16].
Real plants have been built using the two main SGE technologies, PRO and RED. In 2009, the first osmotic power plant was started up in Norway by Statkraft, using PRO, followed by the Netherlands’ Redstack plant and Japan’s MegaTon Water System project [17].
3
Aside from the technical limitations and how to face or mitigate them, it is important to analyse where these technologies could be implemented. If the worldwide riverflow discharge into the oceans is summed up and considered, there is a theoretical potential above 1 TW to be harnessed. However, this global quantification and how to decide whether an actual site is feasible or not, is a matter of disagreement among experts [24]. From a purely energetic point of view, the actual extractable energy will always be considerably smaller than the theoretical potential for all natural systems, due to the inevitability of energy consumption and losses intrinsic to any SGE generation process. The most significant energetic costs are the transportation of the water streams towards the power plant, the water pretreatment to prevent or reduce membrane deterioration and the inefficiencies of the energy conversion system (turbine inefficiencies).
Few investigations have been conducted regarding actual systems and considering their own unique characteristics. Ortega et al. analysed studied the suitability of a Colombian river [25], Sharma et al. evaluated the potential of power production in an estuary in India [26], and in Turkey other evaluations have been performed [27], [28]. Experimental data gathering at a real site would provide salinity and temperature data, including their temporal variability, necessary for determining the available salinity gradient and to estimate more accurately the operating pressure, which is one of the most important process variables, and it is key to sizing plant equipment and to the behaviour of other variables. More accurate simulations could be performed as well, providing better estimations of the extractable energy and aiding to determine the membrane surface area required to treat a given riverwater stream. Surface area often takes a considerable portion of the economic costs, so it is critical for feasibility [29].
It is also important to have information about the possible impact on the ecosystem [30], the actual water quality, and proximity to the demanding population (connectivity to electricity grid). Water quality information would provide indications about the potential pretreatments required.
This study is focused on the natural system formed at the Magdalena river mouth in the Caribbean Sea, to evaluate its potential for electrical production via salinity gradient technology, specifically considering pressure retarded osmosis (PRO). Experimental on-site data have been acquired and proved to be useful in the proposal of a preliminary PRO plant design. A realistic approach for power production calculations is considered, taking into account the decrease of the gradient in a continuous flow operation and giving estimations of energetic costs linked to the process.
2. Materials and Methods
This section describes the location for the proposed PRO plant and the acquisition of the experimental data. Afterwards, a review of PRO models is presented, in order to establish the calculation procedure to estimate the power production.
2.1. Case study
4
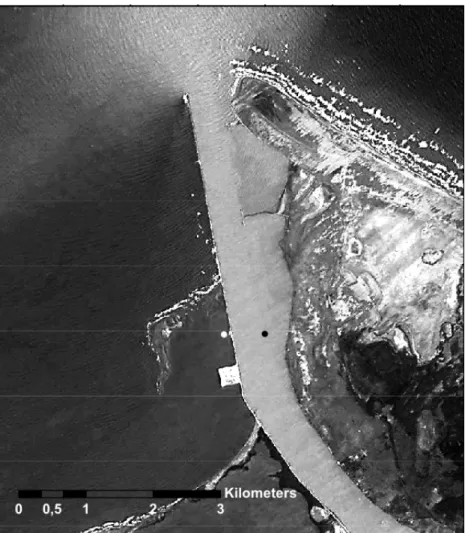
canalization was built in order to reduce the flux area to cause a rise in the water velocity and enhance the navigability of the Magdalena River. This resulted in the current configuration where the river and sea are separated in the east margin of the river course by a 6 km jetty of only a few meters wide. Figure 1 shows that the river plume formed in the sea does not interfere with the seawater intake area. This behaviour is constant throughout the year.
An important feature of the Caribbean Sea is that it is a semi-enclosed sea in a tropical region; these circumstances make it both saltier and warmer than average worldwide ocean water. These characteristics are advantageous to any PRO process [31], [32].
Fig. 1: Magdalena River mouth. Satellite image source: CNES/Astrium 18.03.2016, taken and modified from Google Earth. coordinate system UTM Zone 18N
Black and white circles show the measurement sites in the river and sea sides, respectively
2.2. Experimental data
Temperature and salinity data were gathered every 30 minutes in both river and sea using the conductivity and temperature sensors and loggers described in [33]. The river and seaside sensors present a maximum measurement error of 3% and 5% respectively.
5
were measured parallel to the western jetty in both river and sea sides. These measurements showed that the salinity of the river increases closer to the ocean, while the salinity of the sea decreases due to the proximity to the river mouth; therefore, the salinity gradient decreases. In the sector where the sensors where finally installed the salinity of the river reduces to near zero and remains constant upstream. Thus, it can be assumed that the chosen locations are representative of the best possible conditions achievable on the river mouth.
2.3. Models for pressure retarded osmosis
Different models have been proposed, under different assumptions and different levels of detail. The aim is to determine the water permeation Jw and then the power density production W:
W
W =J ∆P (1)
All these models are based on the fact that water permeation across a semipermeable membrane (Jw) can be expressed in terms of the water permeability coefficient A, the
transmembrane hydraulic pressure difference ∆P and the osmotic pressures of the feed and draw, πF and πD, ideally following the expression:
)
( P
A
JW = πD −πF −∆ (2)
Osmotic pressures are evaluated using Van’t Hoff equation:
CRT vH
β
π = (3)
where βvH is the Van’t Hoff coefficient, which represents the number of ionic species on the
solution coming from the dissociation of the original salt. βvH is close to 2.0, since the
majority of sea salt is sodium chloride. C depicts the molar concentration of the solution (mol/l), R is the universal gas constant and T the absolute temperature.
However, this ideal expression (Eq. 2) is only an approximation because, in practice, membrane selectivity is not perfect: a salt flux always takes place in the opposite direction to the water permeation. This undesired salt flux reduces the effective salinity gradient across the membrane. Another deviation from ideal behaviour is caused by hydrodynamics near the membrane surface, usually presenting concentration polarization [34]. This detrimental phenomenon, in broad terms, consists of the accumulation of solute (feed side of the membrane) or depletion (draw side) near the physical interfaces. This concentration polarization is called external when the active layer of the membrane interface is affected, and internal when it happens on the membrane support layer. It causes a decrease in the actual effective transmembrane salinity gradient. More comprehensive modelling than Eq.1 is required to include these phenomena in order to describe more realistically this. Thus, several models are now briefly described.
2.3.1. Lee Model
6 ∆ − − + − = P K J J B K J C C A J w W w m D b F m D W ) 1 exp( 1 ) exp( 1 , , ,
π (4)
Where CF,b is the bulk salt concentration at the feed side, CD,m the salinity at the
membrane-fluid interface on the draw side, K the solute resistivity and B the salt permeability of the membrane. From a practical point of view, it is difficult to know concentration values on the active layer (CD,m). Moreover, it does not consider the influence of the salinity on the feed
side.
2.3.2. Achilli model
Achilli et al. [36] added the effect of external concentration polarization, expressed through a mass transfer coefficient k, assumed to be the same on both sides of the membrane:
∆ − − + − − = P K J J B k J K J k J A J w W W w b D b F W b D W ) 1 exp( 1 exp ) exp( 1 exp , , , π π π (5)
This model does not require interfacial concentrations, only bulk osmotic pressures at feed and at draw sides (subindex b).
2.3.3. Other models
The contribution of other authors is also noteworthy, like Yip’s model [37], similar to previous models, but extending them by implementing the effect of the reverse salt flux, Prante’s [38] modification of Achilli’s, or Sivertsen’s adaptation for hollow fiber membranes [39].
2.3.4. Touati model
In this work, the following model was used because it considers all types of concentration polarization, the reverse salt flux and it describes the PRO process through a general mass transport model [31]:
, ,
)
1 exp W 1 exp( ) exp W
W D b F b W
W D W F
J J
B A P B A P
J A J K P
A J k A J k
π ∆ π ∆
= + + − − + + − ∆
(6)
Where the mass transfer coefficients differentiated for feed side and draw are represented by kF and kD.
Salt permeation can be calculated as follows:
1
S W
W
B A P
J J
Aβ RT J
∆
= +
(7)
7
equation is an adaptation of the ideal model (Eq. 2). In Touati’s model each osmotic pressure is adjusted by the addition of a term and then multiplying by a gain, representing in a broader sense the effective or practical osmotic pressure on each side of the membrane. Due to the effect of the internal polarization only being present on the feed side (because that is where the actual water transport takes place), the overall osmotic gradient is more sensitive to feed concentration changes than in the draw. This behaviour has been experimentally observed [34] and is adequately represented on this model.
From a calculation point of view, this model is essentially an implicit equation, that must be resolved numerically for each group of three independent variables (the two concentrations and the pressure).
2.4. Simulation and power production calculation for designing a countercurrent flow pressure retarded osmosis process
Countercurrent flow configuration provides a more constant osmotic difference in all the membrane sections compared to a parallel flow system. Thus, the external pressure applied will be near optimal at every point.
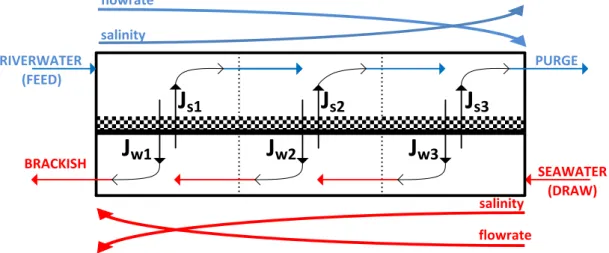
In order to prevent an overestimation of the salinity gradients, the aforementioned mathematical model for water permeation in PRO must be used, taking care of two phenomena that happen in any continuous operation. The reverse salt flux is one of the reasons why the effective transmembrane gradient diminishes, the other being the draw dilution. The former increases the salt concentration on the feed side, while the latter decreases the draw salinity, as it can be seen on the schematic in Figure 2. Both previous undesired effects must be taken into account when simulating the process. Any calculation procedure must consider those concentration variations along the membrane.
PURGE RIVERWATER
BRACKISH
J
w1J
w2J
w3 SEAWATERJ
s3J
s2J
s1salinity flowrate
salinityflowrate
(FEED)
(DRAW)
Fig. 2: Flow distribution on the system
In this work, this issue is approached dividing the membrane in different sections (for simplicity, three sections of the same length are considered). A countercurrent flow configuration is selected to maintain a more constant transmembrane salinity gradient and to further exploit the water resources.
8
QF(i+1) = QF(i) – Jw(i) · Area(i) (8)
QD(i+1) = QD(i) + Jw(i) · Area(i) (9)
CF(i+1) = [CF(i) · QF(i) + Js(i) · Area(i)] / QF(i+1) (10)
CD(i+1) = [CD(i) · QD(i) + Js(i) · Area(i)] / QD(i+1) (11)
This countercurrent multiple stage configuration requires iterative calculations to solve its mathematical loop of equations (Eq. 8-11). The feed (river) and draw (sea) salt concentrations and flowrates serve as boundaries, while the internal intermediate concentrations and flows are updated on each iteration, till the overall mass balance is satisfied.
Once the mathematical system has been solved, it is possible to proceed with the design. One of the most decisive process variables is the external pressure applied to the draw current. It is known that the optimal pressure is approximately half the osmotic gradient between the two water sources at its inlets [14]. However, when considering the gradient variations along the membrane, this assumption is no longer valid. The optimal pressure now will take a different value, significantly smaller, which will have to take place in the range comprised by the osmotic gradients in both ends of the module, (πdraw - πpurge)/2 and (πbrackish - πfeed)/2 for a
countercurrent design. A sensitivity analysis has been performed, varying the external pressure and observing its effect on some of the process variables, the power production among them. The optimal pressure determined with this procedure is used later in further analysis (see Figure 5 on 3.2.1). The power density in each section is also monitored, since it is highly recommended for it to be above 5 W/m2 [18].
This general procedure has been applied to the case study. For simplicity, the river and sea intakes are set to 30 m3/s, which keep the Magdalena River intake flowrate well above its minimum environmental limit of 420 m3/s [24]. It has been reported [6] that using values of sea to river ratio slightly higher than one lead to higher theoretical potentials. However, higher pumping and pretreatment costs would be associated. In order to simplify, on this analysis the sea to feed ratio is kept at one. The plant sizing is chosen so power production is similar to small hydro power plants, common in Colombia [40], [41].
The physical properties of the membrane are a critical aspect of PRO processes, mainly its salt and water permeabilities B and A, respectively. These permeabilities have been chosen according to experimental results provided by other authors [19]. Physical properties have been previously determined experimentally [34].
2.5 Estimation of the potential net power production
9
3. Results and discussion
The experimental data and calculations derived from the previously described model show the following results.
3.1 Experimental field data
Salt concentration and temperature data gathered during the three week registered period are presented on Figures 3 and 4, respectively. Their variability has been shown, on both sides of the jetty. The magnitudes of both variables oscillate on a daily period, with the exception of the salinity at the river side. The daily average of all variables remains moderately stable throughout the days. The salinity of the river is very low and only started to take higher values at the end of the registration period. This increase in the river salinity is due to the reduction of the river discharge during the dry season and the consequent salt wedge intrusion by seawater [8]. This seawater penetration in the channel, which varies throughout the yearly seasons, means that the river water intake should be placed either further inland or closer to the water surface at that time of the year. Further data collection is being performed at different river locations to solve this issue.
0.1 0.2 0.3 0.4 0.5
River salinity
4-25 february 2017
s
al
ini
ty
(
g/
L)
30 32 34 36
Sea salinity
4-25 february 2017
s
al
ini
ty
(
g/
L)
Fig. 3: Magdalena River and Caribbean Sea measured salinities for the selected period
24 25 26 27 28 29 30 31
4-25 february 2017
T
(
ºC)
10
Fig. 4: Magdalena River and Caribbean Sea measured temperatures for the selected period
The average salinity is 0.21 g/l (river) and 33.7 g/l (sea) with maximum and minimum of 0.11 g/l and 0.46 g/l for the river, 30.1 g/l and 34.9 g/l, a standard deviation of 0.02 g/l and 0.66 g/l.
3.2 Simulation of the process in a countercurrent flow design
As discussed in 2.4, the mathematical model is simulated, carefully choosing the optimal external pressure, and followed by the preliminary design.
3.2.1. Determination of the optimal pressure
A central aspect for the design, analysis and operation of PRO plants is the selection of the external applied pressure AP. This pressure is the one that would lead to the maximum power production. Under several assumptions [18], it is half the osmotic pressure difference across the membrane. In practice, this optimal pressure is always less than half the osmotic gradient, because the gradient progressively diminishes as the process goes by (draw dilution, reverse salt flux towards the feed), as explained in subsection 2.4. Using the detailed models (Eq 4-6), it is difficult to determine this optimal pressure in an analytical manner, even when considering only three sections. Consequently, in this work, the optimal pressure was tracked through simulation of the model, following the idea presented in 2.4.
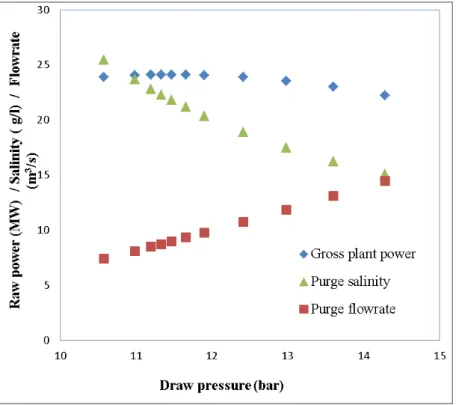
A sensitivity analysis on the influence of the external pressure has been performed, and its results are shown on Figure 5. Here the focus is on the power production, although the purge stream characteristics are also shown, because they affect the analysis of the overall plant flows. The maximum simulated pressure is selected to be half the osmotic difference between the river and sea water at their inlets (which corresponds to an ideal one-stage PRO process), and then decreasing it until the maximum power production is found.
11
The results show that the optimal operating pressure for this configuration is 11.5 bar. Purge characteristics (flowrate and salinity) are shown for each pressure on Figure 5. The purge salinity is a good measure to predict the levels of fouling that would be present in a real process. It is shown that operating with slightly higher pressures than the optimal (up to 12 or 12.5) does not incur a big loss of power production, but can decrease significantly the purge salinity and avoid scaling of the membrane [44]. The purge flowrate varies inversely, increasing while the salinity decreases. In general, for better functioning of the process, it might be convenient to operate with higher purge flowrates, to avoid blockage, pumping issues, and having the purge drag impurities.
3.2.2. Simulation results and overall preliminary design
Once the optimal external pressure to be applied is determined, the strategy proposed in section 2.4 leads to the following results when introducing the experimental data. The schematic presented on Figure 6 shows the flowrates and salinities corresponding to the optimal pressure, different for each section.
Purge 9 m3/s
21 g/l 13 m3/s
10 g/l 21 m3/s
3.3 g/l Riverwater 30 m
3/s
0.2 g/l
Brackish 51 m
3
/s 16 g/l
42 m3/s 21 g/l
34 m3/s 27 g/l
30 m3/s
34 g/l Seawater
Jw Jw Jw
Js Js
Js
Fig. 6: Preliminary design results of the flowrates and salinities along the three sections of the membrane
For a facility with the capacity to treat 30 m3/s of river water, some of the parameters are listed below:
Table 1. Membrane parameters, operation variables and performance results
Water permeability A 1.06×10⁻¹¹ m3/m2·s·Pa Salt permeability B 1.22×10⁻⁷ m3/m2·s Hydraulic external pressure 11.47 bar
Average osmotic gradient 19.7 bar
Membrane area 5×10⁶ m2
Average power density 6.45 W/m2
3.3 Power capacity and process energetic costs
12
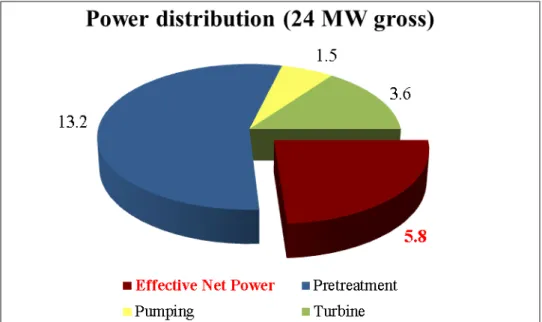
Fig. 7: Power Distribution (MW)
3.4 Potential power production: Analysis and improvement targets
Several more simulations have been performed and are presented on Figure 8, focusing on how much the power production would increase if membranes with higher permeability and more energetically efficient pretreatment processes were to be used.
Fig. 8: Net power estimations for more efficient pretreatments and higher permeability membranes
As shown before (Fig. 7), the pretreatmens take the biggest share of the energy losses and it is here where most efforts should be made to improve the feasibility of the process. 25% lower pretreatment costs (from 0.22 to 0.16 MJ/m3) would lead to 50% higher power production, or almost three times more for a 75% pretreatment cost reduction.
13
would result in the reduction of the membrane area required. The combined situation, double permeability and 75% reduction on pretreatment would lead to a power production of more than triple, i.e. 19 MW.
3.5. Expected uncertainty
Due to the sensor measurement potential errors and the data variability, an uncertainty in the power capacity is to be expected. The design capacity of 5.8 MW could be reduced to 5.3 MW or increased to 6.3 MW (9% each) only considering the sensor errors, worst and best case scenario.
The work presented here has been carried out for average values of the experimental data for the gathering period. In order to take into account the influence of the variability of the data, simulations have been repeated for the maximum and minimum values of the salinities. The temperature variation was also considered, but it only showed negligible repercussions. The expected variation due to the salinity variability amounts to 4.66 MW (-20%) and 6.2 MW (7%) when the sea and river salinity reached minimum and maximum values respectively, and vice versa, that is, best and worst situation possible. Both effects combined would incur a variability of -24% and + 17% in the power capacity.
It is important to notice the greater negative effect caused by higher river salinity than the positive one due to higher sea salinity, even though the sensor is more precise when measuring river water. This observation is to be expected, due to the non-linear nature of the model (as described in section 2.3), in which fresh water with higher salinity leads to a harder penalization in the resulting water flux, and consequently in the power density.
4. Conclusions
In this work, the potential development of an osmotic power plant in the Colombian Caribbean region is proposed. On-site data of both Magdalena River and Caribbean Sea have been acquired. The potential capacity for a power plant facility has been estimated by modelling and simulation of the process, with special focus on not overestimating the salinity gradients and getting a more practical sense of the hypothetical process performance. A state-of-the-art membrane has been used in the simulations, showing that power densities could surpass the limit of 5 W/m2, which is commonly accepted as the minimal value for an economically feasible
design. The net power potentially achievable for a power plant treating 30 m3/s amounts to almost 6 MW and fits within the range of small hydropower plants. The overall efficiency is low, 24%, due to the energetic costs associated to the process. Design indications and improvement targets have been given, showing that if a more energetically efficient pretreatment process and higher permeability membranes were available, the net electrical production could be more than three times higher.
Acknowledgements
14
References
1. Zidanšek, A., Blinc, R., Jeglič, A., Kabashi, S., Bkteshi, S., Šlaus, I., Climate changes, biofuels and the sustainable future, International Journal of Hydrogen, Vol. 34, No. 16, pp 6980-6983, 2009.
2. Riti, J.S., Shu, Y., Song, D., Kamah, M., The Contribution of energy use and financial development by source in climate change mitigation process: A global empirical perspective, Journal of Cleaner Production, Vol. 148, pp 882-894, 2017.
3. Akorede, M.F., Hizam, H., Ab Kadir, M.Z.A., Aris, I., Buba, S.D., Mitigating the anthropogenic global warming in the electric power industry, Renewable and Sustainable Energy Reviews, Vol. 16, No. 5, pp 2747-2761, 2012.
4. Wang, L., Wei, Y-M.,Brown, M.A., Global transition to low-carbon electricity: A bibliometric analysis, Applied Energy, Vol. 205, pp 57-68, 2017.
5. Wakeel, M., Chen, B., Hayat, T., Alsaedi, A., Ahmad, B., Energy consumption for water use cycles in different countries: A review, Applied Energy, Vol. 178, pp 868-885, 2016. 6. Álvarez-Silva, O., Winter, C., Osorio, A.F., Salinity Gradient Energy at River Mouths,
Environmental Science and Technology Letters, Vol. 1 (10) pp 410-415, 2014.
7. Bajraktari, N., Hélix-Nielsen, C., Madsen, H.T., Pressure retarded osmosis from hypersaline sources – A review, Desalination, Vol. 413, pp 65-85, 2017.
8. http://ipaper.ipapercms.dk/EsbenThomsen/SaltPower/
9. Touati, K., Salamanca, J.M., Tadeo, F., Elfil, H., Energy recovery from two-stage SWRO plant using PRO without external freshwater feed stream: Theoretical analysis, Renewable Energy, Vol. 105, pp 84-95, 2017.
10. Saito, K., Irie, M., Zaitsu, S., Sakai, H., Hayashi, H., Tanioka, A., Power generation with salinity gradient by pressure retarded osmosis using concentrated brine from SWRO system and treated sewage as pure water, Desalination and Water Treatment, Vol. 41, pp 114-121, 2012.
11. Pattle, R.E., Production of electric power by mixing fresh and salt water in the hydroelectric pile, Nature, Vol. 174, pp 660, 1954.
12. Sørensen, B., Energy and Resources, Science, Vol. 189, pp 255-260, 1975. 13. Loeb, S., Osmotic power plants, Science, Vol. 189, pp 654-655, 1975.
14. Touati, K., Tadeo, F., Chae, S.H., Kim, J.H., Álvarez-Silva, O.A., Pressure Retarded Osmosis. Renewable Energy Generation and Recovery, Academic Press, 2017.
15. Mei, Y., Tang, C.Y., Recent Developments and future perspectives of reverse electrodialysis technology: A review, Desalination, Vol. 425, pp 156-174, 2018.
16. Rica, R.A., Ziano, R., Salerno, D., Mantegazza, F., van Roji, R., Brogioli, D., Capacitive mixing for harvesting the free energy of solutions at different concentrations, Entropy, Vol. 15, pp 1388-1407, 2014.
17. Kurihara, M., Sakai, H., Tanioka, A., Tomioka, H., Role of pressur-retarded osmosis (PRO) in the mega-ton wáter project, Desalination and Water Treatment, Vol. 57, pp 26518-26528, 2016.
18. Helfer, F., Lemckert, C., Anissimov, Y.G., Osmotic power with Pressure Retarded Osmosis: Theory, performance and trends – A review, Journal of Membrane Science, Vol. 453, pp 337-358, 2014.
19. Wan, C.F., Yang, T., Gai, W., De Lee, Y., Chung, T.S., Thin-film composite hollow fiber membrane with inorganic salt additives for high mechanical strength and high power density for pressure retarded osmosis, Journal of Membrane Science, Vol. 555, pp 388-387, 2018. 20. Nagy, E., Hegedüs, I., Tow, E.W., Lienhard, J.H., Effect of fouling on performance of
15
21. Long, R., Lai, X., Liu, Z., Liu, W., Pressure retarded osmosis: Operating in a compromise between power density and energy efficiency, Energy, Vol. 172, pp 592-598, 2019.
22. Maisonneuve, J., Chintalacheruvu, S., Increasing osmotic power and energy with maximum power point tracking, Applied Energy, Vol. 238, pp 683-695, 2019.
23. Soltani, R., Struchtrup, H., Modeling and simulation of the dual stage pressure retarded osmosis systems, Desalination, Vol. 460. Pp 28-40, 2019.
24. Álvarez-Silva, O., Osorio, A.F., Winter, C., Practical global salinity gradient energy potential, Renewable and Sustainable Energy Reviews, Vol. 60, pp 1387-1395, 2016.
25. Ortega, S.; Stenzel, P.; Alvarez-Silva, O.; Osorio, A. F., Site-specific potential analysis for pressure retarded osmosis (PRO) power plants: The León River example, Renewable Energy , Vol. 68, pp 466−474, 2014.
26. Sharma, M., Chakraborty, A., Kuttippurath, J., The potential of power production using salinity gradient at the Hooghly estuary system, International Conference on 21st Century Energy Needs – Materials, Systems and Applications, 2016.
27. Pasaoglu, M.E., Koyuncu, I., Sengur-Tasdemir, R., Guclu, S., Turken, T., Budeyri, B., Baykan, O., Daskiran, F., Tezcan, E., Applicability of Pressure Retarded Osmosis Power Generation Technology in Istanbul, Periodicals of Engineering and Natural Sciences, Vol 6., pp 141-147, 2018.
28. Saki, S., Uzal, N., Gökçek, M., Ates, N., Predicting potential of pressure retarded osmosis power for different estuaries in Turkey, Environmental Progress & Sustainable Energy, https://doi.org/10.1002/ep.13085, 2018.
29. Chung, H.W., Swaminathan, J., Banchik, L.D., Lienhard, J.H., Economic framework for net power density and levelized cost of electricity in pressure-retarded osmosis, Desalination, Vol. 448, pp 13-20, 2018,
30. Seyfried, C., Palko, H., Dubbs, L., Potential local environmental impacts of salinity gradient energy: A review, Renewable and Sustainable Energy Reviews, Vol. 102, pp 111-120, 2019.
31. Touati, K., Hänel, C., Tadeo, F., Schiestel, T., Effect of the feed and draw solution temperatures on PRO performance: Theoretical and experimental study, Desalination, Vol. 365, pp 182-195, 2015.
32. Touati, K., Tadeo, F., Hänel, C., Schiestel, T., Effect of the operating temperature on hydrodynamics and membrane parameters in pressure retarded osmosis, Desalination and Water Treatment, Vol. 23, pp 10477-10489, 2015.
33. http://www.onsetcomp.com/products/data-loggers/u24-002-c
34. Touati, K., Tadeo, F. (2016), Study of the reverse salt diffusion on pressure retarded osmosis: influence on concentration polarization and effect of the operating conditions, Desalination, Vol. 389, pp 171-186, 2016.
35. Lee, K.L:, Baker, R.W., Lonsdale, H.K., Membranes for power generation by pressure-retarded osmosis, Journal of Membrane Science, Vol. 8, pp 141-171, 1981.
36. Achilli, A., Tzahi, Y.C., Childress, A.E., Power generation with pressure retarded osmosis: An experimental and theoretical investigation. Journal of Membrane Science Vol. 343 pp 42–52, 2009.
37. Yip, N.Y., Tiraferri, A., Phillip, W.A., Schiffman, J.D., Hoover, L.A., Chang Kim, Y., M. Elimelech, Thin-film composite pressure retarded osmosis membranes for sustainable power generation from salinity gradients, Environmental Science and Technology Vol. 45 pp 4360–4369, 2011.
16
39. Sivertsen, E.H., Thelin, T.W., Brekke, G., Modeling mass transport in hollow fiber membranes used for pressure retarded osmosis, Journal of Membrane Science, Vols. 417-418, pp 69-79, 2012.
40. Duque, E.A., González, J.D., Restrepo, J.C., Developing sustainable infrastructure for small hydro power plants through clean development mechanisms in Colombia, Procedia Engineering, Vol. 145, pp 224-233, 2016.
41. Zapata, S., Castaneda, M., Garces, E., Franco, C.J., Dyner, I., Assessing security of supply in a largely hydroelectricity-based system: The Colombian case, Energy, Vol. 156, pp 444-457, 2018.
42. O’Toole, G., Jones, L., Coutinho, C., Hayes, C., Napoles, M., Achilli, A., River-to-sea pressure retarded osmosis: Resource utilization in a full-scale facility, Desalination, Vol. 389, pp 39-51, 2016.
43. Pearce, G.K., UF/MF pre-treatment to RO in seawater and wastewater reuse applications: a comparison of energy costs, Desalination, Vol. 222, pp 66-73, 2008.
44. Zhang, M., Hou, D., She, Q., Tang, C.Y., Gypsum scaling in pressure retarded osmosis: Experiments, mechanisms and implications, Water Research, Vol. 48, pp 387-395, 2014. 45. Seme, S., Sredensk, K., Praunseis, Z., Stumberger, B., Hadziselimovic, M., Optimal price of