TítuloQuantitative ultrasound imaging pixel analysis of the intrinsic plantar muscle tissue between hemiparesis and contralateral feet in post stroke patients
10
0
0
Texto completo
(2) Int. J. Environ. Res. Public Health 2018, 15, 2519. 2 of 10. In European countries, high economic costs were shown [4]. The characteristics and treatment may depend on the stroke types (i.e., hemorrhagic or ischemic). Strokes represented a major disability cause with neurologic disorders and impairments such as walking [1,4]. Plantar flexor muscles of poststroke patients were considered as a key focus of assessment and intervention [5–7]. Indeed, ultrasound imaging was applied to evaluate the medial gastrocnemius muscle with a good reliability and may be utilized for clinical assessment in poststroke patients [6]. Regarding ultrasound imaging in the intrinsic plantar muscles, prior studies assessed the cross sectional area (CSA) of these foot muscles, such as flexor digitorum brevis (FDB), flexor hallucis brevis (FHB), and abductor hallucis (AbH) with an excellent reliability [8–10]. Concretely, a FHB thickness increase and a plantar fascia thickness reduction of the hemiparetic and contralateral feet from poststroke patients were shown with respect to control feet from healthy matched participants. Nevertheless, there were not morphology changes, such as CSA or thickness differences, of the intrinsic plantar muscles between hemiparesis and contralateral feet [11]. Considering resolution and costs, prior studies with different analysis image software were applied in order to evaluate B-mode ultrasound image from different musculoskeletal structures [12,13]. Quantitative ultrasound imaging of the muscle tissue was applied in the neurology field, showing B-mode grayscale pixels values differences of the biceps brachii muscle in chronic poststroke spastic patients [14] as well as biceps, deltoid, wrist flexors, quadriceps, medial gastrocnemius, and tibialis anterior muscles in patients with Duchenne muscular dystrophy [15]. These novel findings may potentially serve as a useful biomarker for disease progression and intervention effects in muscle neurology disorders [15]. To date, the Image J software pixel analysis of the intrinsic plantar muscles CSA has not yet been analyzed in poststroke patients [16]. We hypothesized that mean, standard deviation (SD), and count of the pixels from the B-mode ultrasound quantitative analysis of the FDB, FHB, and AbH could show differences between hemiparetic and contralateral feet of patients who suffered from stroke disease. Thus, the aim of this study was to analyze and compare the Image J software pixel differences in B-mode ultrasound imaging of the intrinsic plantar muscles CSA between hemiparesis and contralateral feet in poststroke patients. 2. Material and Methods 2.1. Design A case-control study was performed from June 2017 to January 2018. The Strengthening the Reporting of Observational Studies in Epidemiology (STROBE) statements were considered [17]. 2.2. Sample Size Calculation A sample size calculation was carried out by the difference between two independent groups thought the G*Power 3.1.9.2 software (Universität Düsseldorf, Düsseldorf, Germany) and based on the FDB pixels mean of a pilot study (n = 8) with two groups (mean ± SD), four feet with hemiparesis (81.75 ± 3.35 pixels), and four contralateral feet (69.81 ± 14.82 pixels). Furthermore, a one-tailed hypothesis, an effect size of 1.11, an α-error probability of 0.05, a power (1-β error probability) of 0.80 and an allocation ratio (N2/N1) of 1 were used for the sample size calculation. Thus, a total sample size of 22 feet, 11 feet with hemiparesis and 11 contralateral feet, was provided. 2.3. Participants A convenience sampling method was used in order to recruit 22 feet from 11 poststroke patients at the poststroke unit of the Beata Maria Ana Hospital (Madrid, Spain). The total sample was divided into 11 hemiparesis feet (case group) and 11 contralateral feet (control group). The inclusion criteria included outpatients > 18 years old without soreness in lower limb areas during the last six months [8,10] and with a prior diagnosis of stroke (hemorrhagic or ischemic types) in chronic (>12 months) phase [14]. The exclusion criteria included self-reported or medical record.
(3) Int. J. Environ. Res. Public Health 2018, 15, 2519. 3 of 10. conditions (such as surgery, fracture, sprain, tear, tendinopathy, systemic alterations, and rheumatoid arthritis) [8–10,18]. 2.4. Ethical Approval La Salle Ethics committee (Spain-CSEULS-PI-156/2017) approved this research. Signed informed consents and the Helsinki Declaration were respected [19]. 2.5. Descriptive Data The descriptive data including sex (male or female), age (years), weight (kg), height (m), body mass index (BMI; kg/m2 ), and foot side (right or left) were registered [8–10]. In addition, the stroke type (hemorrhagic or ischemic) and chronicity (months since the stroke) were collected [14]. The ambulation capacity was assessed by an experienced neurology physician by means of the functional independence measure and functional assessment measure (FIM + FAM) with good psychometric properties of Spanish validation and reliability in poststroke patients from stroke [20–22]. The ambulation capacity was categorized in the following ranges: 1—total assistance, 2—maximum assistance, 3—moderate assistance, 4—minimum assistance, 5—supervision, 6—modified independency, and 7—complete independency [20–23]. The Modified Modified Ashworth Scale (MMAS) was measured by an experienced neurology physician with a good agreement in order to evaluate the plantar flexor spasticity in poststroke patients. This scale was categorized in the following ranges: 0—normal muscle tone, 1—slight hypertonicity, 2—moderate hypertonicity, 3—high hypertonicity, and 4—very high hypertonicity [24]. 2.6. B-Mode Ultrasound Imaging All ultrasound imaging measurements were performed by an expert physiotherapist with >4 years of experience who was not blind to case or control group allocation. A high-quality ultrasound tool (Ecube-i7; Alpinion-Medical Systems, Seoul, Korea) with a linear probe from 8- to 12.0-MHz-range (Broadband Linear type L3-12-T; 45-mm footprint was used to carry out resting B-mode ultrasound image. For all measurements, a pre-designed preset was used in order to use the same filter. All images were collected with the same preset contrast, an image depth of 3 cm, frequency of 12 MHz, a focus of 1.5 cm, total gain of 0 dB, dynamic range of 64 dB and tissue harmonic imaging kept constant. The probe location was performed according to prior ultrasound imaging studies within intrinsic plantar muscles CSA measurements [8–10]. The CSA (perpendicular to the muscle fibers) was evaluated in the thickest portion of the AbH, FDB, and FHB muscles in three different scanning lines. The AbH scanning line was placed from the navicular bone tuberosity to the medial calcaneus bone tuberosity. The FDB scanning line was located from the 3rd toe to the medial calcaneus tuberosity bone tubercle. The FHB scanning line was located along the 1st metatarsal shaft [8–10]. 2.7. Image J Software Analysis Finally, the Image J software analyses were calibrated in cm from the ultrasound images pixels based on the same described ultrasound imaging preset with a 150% image zoom and carried out by an expert physiotherapist with >4 years of experience (blinded to the case or control group allocation). Previously, static grayscale images of the intrinsic plantar muscles were stored in the Digital Imaging and Communications in Medicine (DICOM) format, transferred to a computer and measured offline determining the muscle grayscale pixel value [14]. The ImageJ software (version-2.0; U.S.-National Institutes of Health; Bethesda-Maryland, USA) was utilized in order to measure the interface distance (tissue cm from the probe center to the most superficial point of each muscle CSA), CSA as well as the mean, standard deviation (SD), and count of the pixels from all the offline images of the FDB, FHB, and AbH (Figure 1) [16]. The average of three repeated measurements was used for the data analysis. An excellent reliability (intraclass correlation coefficient, ICC = 0.91–0.98) of the CSA measurements was previously reported [8]..
(4) Int. J. Environ. Res. Public Health 2018, 15, 2519. Int. J. Environ. Res. Public Health 2018, 15, x. 4 of 10. 4 of 10. of of thethe CSA, mean, SD SD andand count of the from from the FDB, Figure 1. ImageJ ImageJsoftware softwareanalysis analysis CSA, mean, count ofpixels the pixels the FHB, FDB, and AbH theofhemiplegic and contralateral feet infeet poststroke patients. Abbreviations: AbH, FHB, and of AbH the hemiplegic and contralateral in poststroke patients. Abbreviations: AbH, abductor hallucis; CSA, cross-sectional area;flexor FDB, digitorum flexor digitorum FHB,hallucis flexor hallucis abductor hallucis; CSA, cross-sectional area; FDB, brevis; brevis; FHB, flexor brevis; brevis; SD, standard deviation. SD, standard deviation..
(5) Int. J. Environ. Res. Public Health 2018, 15, 2519. 5 of 10. 2.8. Statistical Analysis Statistical analysis was performed by the 22.0v SPSS (software IBM SPSS Statistics, Windows; Armonk-NY: IBM-Corp, Armonk, NY, USA) considering an α error of 0.05 and a 95% confidence interval (CI) with a desired power of 80% (β error of 0.2) according to the sample size calculation. Regarding the quantitative data, normality Shapiro-Wilk test was performed. Parametric data (p > 0.05) were described as mean ± standard deviation (SD) and range (minimum−maximum), and analyzed by the Student t-test for independent samples in order to compare descriptive data (weight and height) and all ultrasound and Image J measurements (CSA, mean, SD and count of pixels for FDB, FHB, and AbH muscles). Non-parametric data (p < 0.05) were described as median ± interquartile range (IR) and range (minimum–maximum), and analyzed by the Mann–Whitney U test in order to compare descriptive data (age and BMI). Considering the categorical data, frequencies, and percentages were utilized to describe these data. Furthermore, a multivariate predictive analysis was carried out by linear regression in order to predict the between-groups statistically significant findings (i.e., the AbH pixel count). Linear regression was performed utilizing the stepwise selection method as well as the R2 coefficient in order to establish the quality adjustment. Demographic and descriptive data, such as sex, age, height, weight, BMI, foot side, stroke type and chronicity, FIM + FAM grades, MMAS degrees, and AbH interface distance were used as independent variables. The AbH pixels count was considered as the dependent variable. 3. Results 3.1. Demographic and Descriptive Data Demographic data of the sample showed four males and seven females, median ± IR of 62.00 ± 5.00 years, weight mean ± SD of 69.45±17.32 kg, height mean ± SD of 1.68 ± 0.11 kg, and BMI median ± IR of 19.55 ± 7.99 kg/cm2 . Descriptive data of the hemiparetic side of the sample comprised six right and five left feet, as well as the MMAS grades included 9 grades-II and 2 grades-III for the hemiparetic foot and 11 grades-0 for the contralateral feet, and FIM + FAM scale showed 0 (0%) grade-1, 4 (16.7%) grade-2, 8 (33.3%) grade-3, 4 (16.7%) grade-4, 5 (16.7%) grades-5, 2 (8.3%) grade-6, and 0 (0%) grade-7. In addition, patients showed six (54.5%) ischemic and five (45.5%) hemorrhagic stroke types with a chronicity median ± IR of 18.00 ± 12.00 months. 3.2. B-Mode Ultrasonography and Image J Analysis of Intrinsic Plantar Muscles The ultrasound measurements regarding the interface distance, CSA, mean, SD, and count of the pixels from the FDB, FHB, and AbH of the hemiparetic and contralateral feet from poststroke patients were shown in Table 1. Regarding the intrinsic plantar muscles, statistically significant differences (p = 0.003) were only shown for the AbH pixels count. The rest of measurements did not show any statistically significant difference (p > 0.05). Table 1. ImageJ software analysis of the interface distance, CSA, mean, SD, and count of the pixels from intrinsic plantar muscles of the hemiparetic and contralateral feet in poststroke patients. Parameter. Hemiparesis Feet Mean ± SD (n = 11). Contralateral Feet Mean ± SD (n = 11). p-Value *. Interface (cm) FDB FHB AbH. 0.40 ± 0.06 (0.30–0.50) 0.55 ± 0.07 (0.43–0.67) 0.15 ± 0.03 (0.11–0.21). 0.39 ± 0.05 (0.32–0.49) 0.52 ± 0.10 (0.35–0.66) 0.15 ± 0.03 (0.11–0.23). 0.672 0.463 1.000. CSA (cm2 ) FDB FHB AbH. 2.31 ± 0.58 (1.39–3.37) 2.08 ± 0.46 (1.11–3.86) 2.38 ± 0.56 (1.39–3.53). 2.57 ± 0.68 (1.34–3.43) 1.97 ± 0.45 (1.31–2.52) 2.78 ± 0.74 (1.84–4.42). 0.341 0.611 0.167.
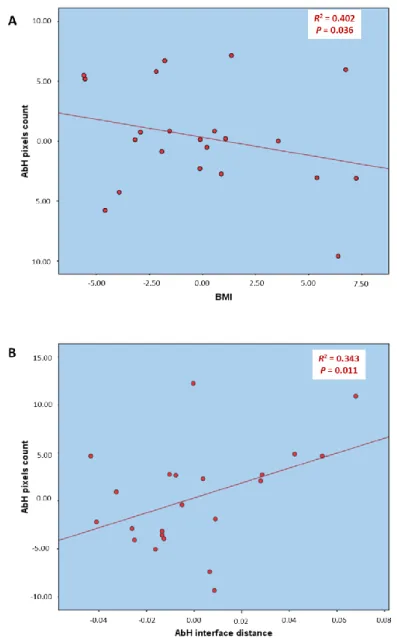
(6) Int. J. Environ. Res. Public Health 2018, 15, 2519. 6 of 10. Table 1. Cont. Hemiparesis Feet Mean ± SD (n = 11). Contralateral Feet Mean ± SD (n = 11). 65,249.90 ± 18,089.52 (46,028.00–95,940.00) 62,931.63 ± 11,849.62 (48,161.33–83,519.33) 66,572.48 ± 12,770.22 (47,111.00–85,467.67). 83,075.51 ± 23,339.07 (39,728.00–13,8092.67) 71,732.91 ± 19,720.70 (37,901.00–10,3927.00) 87,513.18 ± 15,644.87 (57,851.33–11,4668.00). Pixel mean FDB FHB AbH. 86.35 ± 10.59 (69.53–103.20) 88.19 ± 9.30 (71.39–99.70) 75.87 ± 12.81 (60.70–104.81). 75.57 ± 17.10 (47.72–111.09) 76.86 ± 15.62 (58.04–100.14) 67.13 ± 11.15 (60.70–104.81). 0.091 0.055 0.107. Pixel SD FDB FHB AbH. 41.08 ± 5.90 (34.91–52.23) 33.04 ± 3.14 (28.81–36.50) 37.42 ± 0.25 (27.46–44.35). 38.57 ± 5.98 (29.69–49.77) 31.83 ± 5.79 (22.68–45.91) 38.05 ± 4.77 (31.39–47.06). 0.334 0.552 0.760. Parameter. p-Value *. Pixel count FDB FHB AbH. 0.102 0.219 0.003. Abbreviations: AbH, abductor hallucis; CI, confidence interval; CSA, cross-sectional area; FDB, flexor digitorum brevis; FHB, flexor hallucis brevis; IR, interquartile range; SD, standard deviation. In all analyses, a p-value < 0.05 with a 95% CI was considered as statistically significant. * Student t-test for independent samples was used.. 3.3. Multivariate Predictive Analysis of AbH Pixels Count Regarding the multivariate regression analysis of the Table 2 and Figure 2, the model of linear regression for the AbH pixels count prediction showed statistically significant differences (p < 0.05) with a prediction model R2 of 0.745 based on the BMI and AbH interface distance. The rest of the variables were excluded from the prediction model. Table 2. Multivariate predictive analysis of ImageJ software analysis of count of the pixels of the AbH from the hemiparetic and contralateral feet in poststroke patients. 0.935 * BMI R2 Change †. Model R2. −0.935 * BMI. 0.402. 0.745. +86.432 * AbH interface distance. 0.343. Parameter. Model. AbH pixels count. 43.057. Abbreviations: AbH, abductor hallucis; BMI, body mass index. * Multiplay: BMI (kg/m2 ); AbH interface distance (cm). † p-value < 0.05 with a 95% CI was shown..
(7) Int. J. Environ. Res. Public Health 2018, 15, 2519. Int. J. Environ. Res. Public Health 2018, 15, x. 7 of 10. 7 of 10. Figure 2. Partial linear regression graphs of the multivariate predictive analysis for the prediction Figure 2. Partial linear regression graphs of the multivariate predictive analysis the(A) prediction of of the count of the pixels of the AbH muscle (dependent variable) based on thefor BMI and AbH the count of the pixels of the AbH muscle (dependent variable) based on the BMI (A) and AbH interface distance (B) from the hemiparetic and contralateral feet in poststroke patients. Abbreviations: interface distance (B) from thebody hemiparetic and contralateral feet in poststroke patients. Abbreviations: AbH, abductor hallucis; BMI, mass index. AbH, abductor hallucis; BMI, body mass index.. 4. Discussion 4. Discussion The grayscale pixel values may represent muscle atrophy and were shown to be higher in post-stroke spastic pixel bicepsvalues brachii muscles thanmuscle in healthy and poststroke non-spastic bicepsin brachii The grayscale may represent atrophy and were shown to be higher postmuscles [14]. Gao et al. brachii measured grayscale pixel values (mean, minimum and maximum) by counting stroke spastic biceps muscles than in healthy and poststroke non-spastic biceps brachii 2500 pixels (50Gao × 50)etinal.a rectangular region of pixel interest in the(mean, center of the biceps brachii muscle by at muscles [14]. measured grayscale values minimum and maximum) the depth2500 of 2 cm with to athe skin, while we prioritized mean, SDbiceps and count of counting pixels (50respect × 50) in rectangular region of interesttoinmeasure the center of the brachii the grayscale pixels contained in the CSA of the FDB, FHB, and AbH due to the smaller muscles size muscle at the depth of 2 cm with respect to the skin, while we prioritized to measure mean, SD and permitted us grayscale to measure the completed CSA. addition, the non-existence of CSA and count of the pixels contained in the In CSA of the FDB, FHB, and AbH due to theinterface smaller distance between-groups the sameCSA. ultrasound imaging and conditions muscles size permitted usdifferences to measureunder the completed In addition, the filters non-existence of CSA also and permitted us to avoid the influence of these parameters on our measurements. interface distance between-groups differences under the same ultrasound imaging filters and Despite thepermitted presenceusoftohigher pixel mean and SD values in the flexor muscles of conditions also avoid the influence of these parameters onplantar our measurements. hemiparetic contralateral feet, pixel there mean were not differences. Although Despite versus the presence of higher andstatistically SD values significant in the plantar flexor muscles of Gao et al. [14]versus did not analyze thefeet, pixelthere count due not to astatistically region of interest with differences. 2500 pixels was used, hemiparetic contralateral were significant Although Gao et al. [14] did not analyze the pixel count due to a region of interest with 2500 pixels was used, our study showed a lower pixel count value in the AbH CSA of hemiparetic versus contralateral feet.
(8) Int. J. Environ. Res. Public Health 2018, 15, 2519. 8 of 10. our study showed a lower pixel count value in the AbH CSA of hemiparetic versus contralateral feet in poststroke survivors. Nevertheless, future studies are necessary in order to understand these findings and the stroke disease progression. The multivariate predictive analysis showed that the AbH pixels count may be directly predicted by the BMI decrease and AbH interface distance increase according to Table 2 and Figure 2. Despite the interface distance [14] may influence the pixel count in B-mode gray scale, our sample did not show any statistically significant difference for the interface distance of the measured muscles. 4.1. Future Studies or Clinical Implications This study provides novel findings as a first cross-sectional approach in order to apply these quantitative B-mode ultrasound analyses of the intrinsic plantar muscles as potential biomarkers for future longitudinal research studies during the stroke disease course. To date, real-time ultrasound imaging has been used as a non-expensive, portable, non-invasive and safe tool with excellent diagnostic accuracy, which was commonly used to provide indirect and direct information about various vessels features in both extracranial and intracranial structures during the stroke disease course [25]. Currently, quantitative ultrasound may be considered as a potential biomarker and a complementary modality for the assessment of neurological conditions such as Duchenne muscular dystrophy [15,26] and amyotrophic lateral sclerosis [27–29]. Nevertheless, these analyses should be replicated in the stroke disease course including the AbH muscle based on our findings. 4.2. Limitations Some limitations may be considered in the present study. A randomized sampling method, the use of a region of interest [14] for the ImageJ analyses and the analysis of one stroke type in an isolated manner should be applied for future studies. 5. Conclusions Image J software differences in B-mode ultrasound imaging with a reduction of the AbH pixels count were presented between hemiparetic and contralateral feet in poststroke patients. Further studies are necessary in order to apply our findings as potential biomarkers during the stroke disease course. Author Contributions: Conceptualization, C.C.-L. and I.S.-C.; Data curation, A.I.U.-O., J.A.-P., M.M.-S., and C.R.-M.; Formal analysis, C.C.-L., J.A.-P., C.R.-M., and I.S.-C.; Investigation, C.C.-L., A.I.U.-O., J.A.-P., M.M.-S., C.R.-M., I.S.-C., D.R.-S., and D.L.-L.; Methodology, C.C.-L., A.I.U.-O., J.A.-P., C.R.-M., I.S.-C., D.R.-S., and D.L.-L.; Resources, A.I.U.-O, J.A.-P., and M.M.-S.; Software, J.A.-P., M.M.-S., and D.R.-S.; Supervision, C.C.-L., D.R.-S., and D.L.-L.; Validation, C.C.-L., D.R.-S., and D.L.-L.; Visualization, C.C.-L., A.I.U.-O., M.M.-S., C.R.-M., I.S.-C., D.R.-S., and D.L.-L.; Writing—original draft, C.C.-L., D.R.-S., and D.L.-L.; Writing—review & editing, C.C.-L., A.I.U.-O., J.A.-P., M.M.-S., C.R.-M., I.S.-C., D.R.-S., and D.L.-L.. Funding: This research received no external funding. Conflicts of Interest: The authors declare no conflict of interest.. References 1.. 2.. 3.. 4.. Zhang, Y.; Chapman, A.-M.; Plested, M.; Jackson, D.; Purroy, F. The Incidence, Prevalence, and Mortality of Stroke in France, Germany, Italy, Spain, the UK, and the US: A Literature Review. Stroke Res. Treat. 2012. [CrossRef] [PubMed] Vega, T.; Zurriaga, O.; Ramos, J.M.; Gil, M.; Alamo, R.; Lozano, J.E.; López, A.; Miralles, M.T.; Vaca, P.; Alvarez Mdel, M.; et al. Stroke in Spain: Epidemiologic incidence and patterns; a health sentinel network study. J. Stroke Cerebrovasc. Dis. 2009, 18, 11–16. [CrossRef] [PubMed] Mar, J.; Masjuan, J.; Oliva-Moreno, J.; Gonzalez-Rojas, N.; Becerra, V.; Casado, M.Á.; Torres, C.; Yebenes, M.; Quintana, M.; Alvarez-Sabín, J.; et al. Outcomes measured by mortality rates, quality of life and degree of autonomy in the first year in stroke units in Spain. Health Qual. Life Outcomes 2015. [CrossRef] [PubMed] Di Carlo, A. Human and economic burden of stroke. Age Ageing 2009, 38, 4–5. [CrossRef] [PubMed].
(9) Int. J. Environ. Res. Public Health 2018, 15, 2519. 5.. 6. 7.. 8. 9. 10.. 11.. 12.. 13.. 14.. 15.. 16. 17.. 18. 19. 20.. 21. 22.. 23.. 9 of 10. Santamato, A.; Francesca Micello, M.; Panza, F.; Fortunato, F.; Logroscino, G.; Picelli, A.; Manganotti, P.; Smania, N.; Fiore, P.; Ranieri, M. Extracorporeal Shock Wave Therapy for the Treatment of Poststroke Plantar-Flexor Muscles Spasticity: A Prospective Open-Label Study. Top. Stroke Rehabil. 2014, 21, S17–S24. [CrossRef] [PubMed] Cho, K.H.; Lee, H.J.; Lee, W.H. Reliability of rehabilitative ultrasound imaging for the medial gastrocnemius muscle in poststroke patients. Clin. Physiol. Funct. Imaging 2014, 34, 26–31. [CrossRef] [PubMed] Gao, F.; Ren, Y.; Roth, E.J.; Harvey, R.; Zhang, L.-Q. Effects of repeated ankle stretching on calf muscle-tendon and ankle biomechanical properties in stroke survivors. Clin. Biomech. 2011, 26, 516–522. [CrossRef] [PubMed] Crofts, G.; Angin, S.; Mickle, K.J.; Hill, S.; Nester, C.J. Reliability of ultrasound for measurement of selected foot structures. Gait Posture 2014, 39, 35–39. [CrossRef] [PubMed] Angin, S.; Crofts, G.; Mickle, K.J.; Nester, C.J. Ultrasound evaluation of foot muscles and plantar fascia in pes planus. Gait Posture 2014, 40, 48–52. [CrossRef] [PubMed] Lobo, C.C.; Marín, A.G.; Sanz, D.R.; López, D.L.; López, P.P.; Morales, C.R.; Corbalán, I.S. Ultrasound evaluation of intrinsic plantar muscles and fascia in hallux valgus: A. case-control study. Medicine 2016, 95, e5243. [CrossRef] [PubMed] Calvo-Lobo, C.; Useros-Olmo, A.I.; Almazán-Polo, J.; Becerro-de-Bengoa-Vallejo, R.; Losa-Iglesias, M.E.; Palomo-López, P.; Rodríguez-Sanz, D.; López-López, D. Rehabilitative ultrasound imaging of the bilateral intrinsic plantar muscles and fascia in post-stroke survivors with hemiparesis: A. case-control study. Int. J. Med. Sci. 2018, 15, 907–914. [CrossRef] [PubMed] Coppieters, M.W.; Hough, A.D.; Dilley, A. Different nerve-gliding exercises induce different magnitudes of median nerve longitudinal excursion: An in vivo study using dynamic ultrasound imaging. J. Orthop. Sport. Phys. Ther. 2009, 39, 164–171. [CrossRef] [PubMed] Ellis, R.; Osborne, S.; Whitfield, J.; Parmar, P.; Hing, W. The effect of spinal position on sciatic nerve excursion during seated neural mobilisation exercises: An in vivo study using ultrasound imaging. J. Man. Manip. Ther. 2017, 25, 98–105. [CrossRef] [PubMed] Gao, J.; He, W.; Du, L.-J.; Chen, J.; Park, D.; Wells, M.; Fowlkes, B.; O’Dell, M. Quantitative Ultrasound Imaging to Assess the Biceps Brachii Muscle in Chronic Post-Stroke Spasticity: Preliminary Observation. Ultrasound Med. Biol. 2018. [CrossRef] [PubMed] Koppaka, S.; Shklyar, I.; Rutkove, S.B.; Darras, B.T.; Anthony, B.W.; Zaidman, C.M.; Wu, J.S. Quantitative Ultrasound Assessment of Duchenne Muscular Dystrophy Using Edge Detection Analysis. J. Ultrasound Med. 2016, 35, 1889–1897. [CrossRef] [PubMed] Schneider, C.A.; Rasband, W.S.; Eliceiri, K.W. NIH Image to Image J: 25 years of image analysis. Nat. Methods 2012, 9, 671–675. [CrossRef] [PubMed] Vandenbroucke, J.P.; von Elm, E.; Altman, D.G.; Gøtzsche, P.C.; Mulrow, C.D.; Pocock, S.J.; Poole, C.; Schlesselman, J.J.; Egger, M.; STROBE Initiative. Strengthening the Reporting of Observational Studies in Epidemiology (STROBE): Explanation and elaboration. Int. J. Surg. 2014, 12, 1500–1524. [CrossRef] [PubMed] Cartwright, M.S.; Walker, F.O. Neuromuscular ultrasound in common entrapment neuropathies. Muscle Nerve 2013, 48, 696–704. [CrossRef] [PubMed] Holt, G.R. Declaration of Helsinki—The World’s Document of Conscience and Responsibility. South. Med. J. 2014, 107, 407. [CrossRef] [PubMed] Nayar, M.; Vanderstay, R.; Siegert, R.J.; Turner-Stokes, L. The UK Functional Assessment Measure (UK FIM+FAM): Psychometric Evaluation in Patients Undergoing Specialist Rehabilitation following a Stroke from the National UK Clinical Dataset. PLoS ONE 2016, 11, e0147288. [CrossRef] [PubMed] Hall, K.M.; Hamilton, B.B.; Gordon, W.A.; Zasler, N.D. Characteristics and comparisons of functional assessment indices. J. Head. Trauma Rehabil. 1993, 8, 60–74. [CrossRef] Huertas Hoyas, E.; Pedrero Pérez, E.J.; Águila Maturana, A.M.; García López-Alberca, S.; González Alted, C. Predictores de funcionalidad en el daño cerebral adquirido. Neurología 2015, 30, 339–346. [CrossRef] [PubMed] Martínez-Martín, P.; Fernández-Mayoralas, G.; Frades-Payo, B.; Rojo-Pérez, F.; Petidier, R.; Rodríguez-Rodríguez, V.; Forjaz, M.J.; Prieto-Flores, M.E.; de Pedro Cuesta, J. Validation of the functional independence scale. Gac. Sanit. 2009, 23, 49–54. [CrossRef] [PubMed].
(10) Int. J. Environ. Res. Public Health 2018, 15, 2519. 24.. 25. 26.. 27.. 28.. 29.. 10 of 10. Mishra, C.; Ganesh, G.S. Inter-Rater Reliability of Modified Modified Ashworth Scale in the Assessment of Plantar Flexor Muscle Spasticity in Patients with Spinal Cord Injury. Physiother. Res. Int. 2014, 19, 231–237. [CrossRef] [PubMed] Liu, Y.; Hua, Y.; Feng, W.; Ovbiagele, B. Multimodality ultrasound imaging in stroke: Current concepts and future focus. Expert. Rev. Cardiovasc. Ther. 2016, 14, 1325–1333. [CrossRef] [PubMed] Rutkove, S.B.; Geisbush, T.R.; Mijailovic, A.; Shklyar, I.; Pasternak, A.; Visyak, N.; Wu, J.S.; Zaidman, C.; Darras, B.T. Cross-sectional Evaluation of Electrical Impedance Myography and Quantitative Ultrasound for the Assessment of Duchenne Muscular Dystrophy in a Clinical Trial Setting. Pediatr. Neurol. 2014, 51, 88–92. [CrossRef] [PubMed] Martínez-Payá, J.J.; Ríos-Díaz, J.; Medina-Mirapeix, F.; Vázquez-Costa, J.F.; del Baño-Aledo, M.E. Monitoring Progression of Amyotrophic Lateral Sclerosis Using Ultrasound Morpho-Textural Muscle Biomarkers: A Pilot Study. Ultrasound Med. Biol. 2018, 44, 102–109. [CrossRef] [PubMed] Martínez-Payá, J.J.; Ríos-Díaz, J.; del Baño-Aledo, M.E.; Tembl-Ferrairó, J.I.; Vazquez-Costa, J.F.; Medina-Mirapeix, F. Quantitative Muscle Ultrasonography Using Textural Analysis in Amyotrophic Lateral Sclerosis. Ultrason. Imaging 2017, 39, 357–368. [CrossRef] [PubMed] Martínez-Payá, J.J.; del Baño-Aledo, M.E.; Ríos-Díaz, J.; Tembl-Ferrairó, J.I.; Vázquez-Costa, J.F.; Medina-Mirapeix, F. Muscular Echovariation: A New Biomarker in Amyotrophic Lateral Sclerosis. Ultrasound Med. Biol. 2017, 43, 1153–1162. [CrossRef] [PubMed] © 2018 by the authors. Licensee MDPI, Basel, Switzerland. This article is an open access article distributed under the terms and conditions of the Creative Commons Attribution (CC BY) license (http://creativecommons.org/licenses/by/4.0/)..
(11)
Figure


Documento similar
Since such powers frequently exist outside the institutional framework, and/or exercise their influence through channels exempt (or simply out of reach) from any political
Of special concern for this work are outbreaks formed by the benthic dinoflagellate Ostreopsis (Schmidt), including several species producers of palytoxin (PLTX)-like compounds,
In the previous sections we have shown how astronomical alignments and solar hierophanies – with a common interest in the solstices − were substantiated in the
While Russian nostalgia for the late-socialism of the Brezhnev era began only after the clear-cut rupture of 1991, nostalgia for the 1970s seems to have emerged in Algeria
The concept of breakdown probability profile is useful to describe the break- down properties of any estimate obtained through resampling, not just the bagged median or the
In this respect, a comparison with The Shadow of the Glen is very useful, since the text finished by Synge in 1904 can be considered a complex development of the opposition
In the “big picture” perspective of the recent years that we have described in Brazil, Spain, Portugal and Puerto Rico there are some similarities and important differences,
1. S., III, 52, 1-3: Examinadas estas cosas por nosotros, sería apropiado a los lugares antes citados tratar lo contado en la historia sobre las Amazonas que había antiguamente
