Economic and Financial Analysis of Zara and his competitors Leader and Followers
45
0
0
Texto completo
(2) INDEX: 1. INTRODUCTION: ................................................................................... 4 2. PROFITABILITY ANALYSIS: ..................................................................... 5 2.1 RETURN ON ASSETS .......................................................................... 5 2.1.1) 2011-2013 ROA TIME SERIES ...................................................... 8 2.1.2) 2013 ROA CROSS-SECTION ....................................................... 12 2.2 RETURN ON EQUITY........................................................................ 15 2.2.1) 2011-2013 TIME SERIES............................................................ 18 2.2.2) 2013 CROSS-SECTION ............................................................... 24 3. LIQUIDITY ANALYSIS: .......................................................................... 28 3.1 CURRENT RATIO ............................................................................. 29 3.1.1) 2011-2013 CURRENT RATIO TIME SERIES ................................. 30 3.1.2) 2013 CURRENT RATIO CROSS-SECTION .................................... 31 3.2 AVERAGE PERIOD OF FINANCIAL MADURATION............................. 32 3.2.1) 2011-2013 APFM TIME SERIES ................................................. 34 3.2.2) 2011-2013 APFM CROSS-SECTION............................................ 38 4. CONCLUSIONS: ................................................................................... 41 5. BIBLIOGRAPHY: .................................................................................. 45. 2.
(3) INDEX OF TABLES AND GRAPHS: Table 1 ........................................................................................................................................8 Table 2 ........................................................................................................................................9 Table 3 ......................................................................................................................................11 Table 4 ......................................................................................................................................12 Table 5 ......................................................................................................................................18 Table 6 ......................................................................................................................................20 Table 7 ......................................................................................................................................21 Table 8 ......................................................................................................................................22 Table 9 ......................................................................................................................................24 Table 10 ....................................................................................................................................24 Table 11 ....................................................................................................................................30 Table 12 ....................................................................................................................................31 Table 13 ....................................................................................................................................34 Table 14 ....................................................................................................................................35 Table 15 ....................................................................................................................................36 Table 16 ....................................................................................................................................38 Table 17 ....................................................................................................................................38 Table 18 ....................................................................................................................................39. Graphic 1 ....................................................................................................................................8 Graphic 2 ..................................................................................................................................10 Graphic 3 ..................................................................................................................................11 Graphic 4 ..................................................................................................................................13 Graphic 5 ..................................................................................................................................14 Graphic 6 ..................................................................................................................................14 Graphic 7 ..................................................................................................................................18 Graphic 8 ..................................................................................................................................20 Graphic 9 ..................................................................................................................................21 Graphic 10 ................................................................................................................................22 Graphic 11 ................................................................................................................................24 Graphic 12 ................................................................................................................................26 Graphic 13 ................................................................................................................................26 Graphic 14 ................................................................................................................................26 Graphic 15 ................................................................................................................................27 Graphic 16 ................................................................................................................................30 Graphic 17 ................................................................................................................................31 Graphic 18 ................................................................................................................................34 Graphic 19 ................................................................................................................................35 Graphic 20 ................................................................................................................................37 Graphic 21 ................................................................................................................................38 Graphic 22 ................................................................................................................................38 Graphic 23 ................................................................................................................................39 3.
(4) 1. INTRODUCTION: Everyone who has minimal interest in the Spanish business world knows that Inditex is one of the most important companies in our country, and one of our most international companies. The growth model of Zara and all the whole Inditex textile group is almost a required subject in postgraduate and managers training centers, both in Spain and abroad. Inditex has been able to create an excellent business model and differentiate itself in a very difficult world, as the clothing industry is. The miracle of Zara or Inditex, as it is known in the world of business training, does not breathe self-indulgence, but quite the opposite: willigness to learn and to improve what can be improved. Because of that, we have wondered, what is the key to success of Inditex? On this basis, this paper is to conduct an assessment and diagnosis of the financial situation of Inditex (in this dissertation we will call it Zara group) and its nearest competitors, such as Primark, Cortefiel, Sfera, Pepe Jeans, Kiabi and Punto Roma, basing our study on the calculation and interpretation of key financial ratios, as well as the connections between them. The content will be developed in such a way that all readers are able to understand it, starting with a simple analysis of time series of the last three years of activity, and an analysis of the 2013 cross-section of each of the companies, including the study of their liquidity and profitability indicators. Last but not least, we will draw some conclusions that allow between seeing the most significant differences between the clear sector leader and its most immediate competitors.. 4.
(5) 2. PROFITABILITY ANALYSIS: Generally speaking, a company’s main objective is to maximize the return on invested funds without jeopardizing the continuity of its activity over time. The concept of profitability is designed to measure the performance achieved by the company, in relative terms, with the capital it invested over a determinate period of time. Therefore, profitability ratios use components from the income statement, comparing a measure of profits with a measure of investment or funds used for yielding such profit. Thus, in general terms, we can define profitability as follows: Profitability = Profit / Investment Based on this definition, it is common to use an averaging period as a measure of the investment, since those funds that have been used during the whole fiscal year in order to make a profit are neither the ones from the end nor the ones from the beginning of the tax year, but an average of both of them. We must be more accurate when trying to define the exact term of profitability, because depending on both the chosen measures of profit and of investment, we will face magnitudes that can conceptually be very different. For instance, later on in this dissertation it will be proven that the return on assets of a company may be very different from its return on equity, and the main cause of this difference would be the debt level of the company.. 2.1 RETURN ON ASSETS With regard to return on assets (ROA), also known as profitability of assets or return on investment (ROI), which is defined as the ratio between earnings before interest and taxes (EBIT) and total assets. ROA = EBIT / Total asset The asset is in the denominator, and it acts as a measure for all the investment made by the company, representing its economic structure. In the numerator, there is the result generated by all of these investments, which is none other than the earnings before interest and taxes. Comparing this result with the funds that have been used in order to make up the total assets, we will obtain the profitability of the economic structure of the company.. 5.
(6) The interpretation of this ratio is something direct, since it involves the comparison of the company’s profitability before the deduction of the remuneration for the resources that have been used (interest payments for creditors, dividends for shareholders) and the profit tax, with the real investments which have been used in order to obtain them. Therefore, it is a mesure of the profitability of total investments regardless of the chosen funding method. However, it has to be taken into account that the interest on the debt is not included in the numerator; it depends on the financial structure of the company. Hence, this ratio has no influence whether the company has chosen to finance itself through debt and it pays the interest corresponding to such debt, or it has opted to be financed through its own resources. Thus, the main advantage that is related to return on assets is none other than its ability to act as an independent measure of how the company is financed. Two companies which can be seen as equal, with the same assets and profitability, will yield the same earnings before interest and taxes and the same return on assets, although they have chosen to be financed differently. The value of ROA will vary depending on the kind of industry that lies under study. There will be a remarkable difference between a company from the metalworking industry and a restaurant located right in the middle of a big metropolis. Clearly, companies that require a higher initial outlay will have lower returns on investment since, in those cases, the value of the denominator is greater (the asset value is very large because the company has a lot of machinery and capital to carry out its productive activities) despite net profit can be much higher. In a service providing business which uses much more labor force rather than capital, the ROA will be higher even though the net profit may be lower. ROA values above 5 % (i.e., for every euro invested, the business would generate 5 cent return) are considered acceptable. The expression that defines the return on assets can be decomposed into those different elements that compose it, in order to make its analysis easier and understand the causes that justify its evolution. When its expression is multiplied and divided by the net sales of that particular period, the result will point out the two essential components of itself: economic margin and asset turnover. This way, we have: ROA = (EBIT / Net sales) x (Net sales / Total asset). Economic margin on sales. Asset turnover. 6.
(7) In response to this breakdown, we will see in the first place the economic margin on sales, i.e., the profit per unit sales, defined as the percentage of earnings before interest and taxes on the turnover, or, what is to say, the margin left after covering all costs of inputs used in the production of the products sold or the services rendered. The second expression is the asset turnover, and it expresses the number of times an asset has been sold and spare or, in other words, the level of sales for a given investment. It also reflects the capacity assets have to generate sales and the relative efficiency the company is managed with. In this paper we will analyze the profitability of each of the selected samples from the textile industry, and thus we will be able to distinguish three different types of data used in economics and business management. These data which will be found in this analysis include: Time series (chronological or historical series): These are values of a variable over time, that is, a time series is a set of observations which generally show a regular frequency on a particular variable for diverse time points. Cross-sectional data (cross section): These are values for different subjects in a given time, that is, they are a set of observations on different individuals or evidence relating to the same point in time. Panel data: These are a combination of time series data and cross-sectional data. In panel data, observations on different units are obtained at different moments in time, it being understood that at least some parts of the units which information is collected from do not vary across periods. However, in this work only the time series 2011-2013 will be used to analize the ROA and the cross section from 2013.. 7.
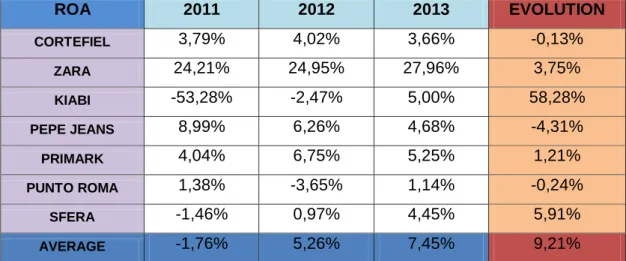
(8) 2.1.1) 2011-2013 ROA TIME SERIES Next, there is a series of charts and graphs where the development of profitability and its components for the period 2011-2013 for each of the companies analyzed in the sample of companies from the textile industry appear. Then, the most relevant facets of each of the graphs will be discussed. Table 1 ROA. 2011. 2012. 2013. EVOLUTION. CORTEFIEL. 3,79%. 4,02%. 3,66%. -0,13%. ZARA. 24,21%. 24,95%. 27,96%. 3,75%. KIABI. -53,28%. -2,47%. 5,00%. 58,28%. PEPE JEANS. 8,99%. 6,26%. 4,68%. -4,31%. PRIMARK. 4,04%. 6,75%. 5,25%. 1,21%. PUNTO ROMA. 1,38%. -3,65%. 1,14%. -0,24%. SFERA. -1,46%. 0,97%. 4,45%. 5,91%. AVERAGE. -1,76%. 5,26%. 7,45%. 9,21%. Graphic 1. 2011-2013 ROA EVOLUTION. 40,00% 30,00%. CORTEFIEL. 20,00%. ZARA. 10,00%. KIABI. 0,00% -10,00% -20,00% -30,00% -40,00% -50,00%. 2011. 2012. 2013. PEPE JEANS PRIMARK PUNTO ROMA SFERA MEDIA. -60,00%. This ratio is a key indicator of its overall productivity, and it shows the percentage of profit a company earns in relation to its total resources. A negative ROA suggests that a company is improperly using its capital, and that it may have a questionable management. As it can easily be seen from the chart, the evolution of the average return on assets of the sector has been favorable, since it has grown from a negative rate of 1.76 % in. 8.
(9) 2011 to a positive ratio of 7.45 % in 2013, i.e., in the analyzed period the ROA has increased 9.21 percentage points. Half of the surveyed companies have improved their return on assets during this period. These companies are Zara, Kiabi, Primark and Sfera. The evolution experienced by the company Kiabi is remarkably surprising, since it has gone from having a negative ratio of 53.28 % in 2011 to a positive ratio of 5 % in 2013, that is, it has increased its profitability in 58.28 percentage points in just 3 years. On the other hand, it should also be pointed out that the other half of the companies have seen their profitability decline during the period reviewed in this study —these companies are Pepe Jeans, Cortefiel and Punto Roma. The highest drop has been experienced by Pepe Jeans; the ratio of the company has deteriorated, and it has gone from 8.99 % in 2011 to be reduced by 4.68% in 2013. The expression that defines the return on assets can be decomposed into the elements that comprise it (margin and rotation) in order to facilitate its analysis and delve into the causes that justify its evolution. Because of that, both the evolution of margin and rotation will be analyzed in this dissertation as well. Table 2 MARGIN. 2011. 2012. 2013. EVOLUTION. CORTEFIEL. 5,56%. 5,66%. 5,25%. -0,31%. ZARA. 22,75%. 23,70%. 25,80%. 3,05%. KIABI. -17,73%. -0,81%. 1,60%. 19,33%. PEPE JEANS. 10,94%. 7,90%. 6,49%. -4,44%. PRIMARK. 1,61%. 3,00%. 2,19%. 0,58%. PUNTO ROMA. 0,64%. -1,87%. 0,59%. -0,05%. SFERA. -1,32%. 0,84%. 3,43%. 4,75%. AVERAGE. 3,21%. 5,49%. 6,48%. 3,27%. 9.
(10) Graphic 2 30,00%. 2011-2013 MARGIN EVOLUTION. CORTEFIEL. 20,00%. ZARA KIABI. 10,00%. PEPE JEANS 0,00% 2011. 2012. -10,00% -20,00%. 2013. PRIMARK PUNTO ROMA SFERA. So far we have seen that in order to overcome the crisis companies have to sell more. And if they want to sell more it is of capital importance to expand the business and/or create new products (either a new product or a new customer). And to achieve this, they must have a good product sold at a reasonably good price. Nevertheless, this it is not enough. It is also essential that the companies get to earn money and, in order to achieve that, the key point is gross margin. When speaking of gross margin we are specifically referring to the selling price of a product minus its variable cost. The variable cost typically corresponds only to components, since labor costs are almost everywhere a fixed cost (though not always, due to outsourcing, overtime, etc.). This gross margin (in euros) has to pay anything else, which involves basically: wages and overheads and, to a lesser extent, interest and taxes. This way we get to net profit. Gross margin is measured as a percentage on sales. Gross margin is the key point of the company’s profitability. If this deteriorates, then problems begin. In sectors with lots of competition (such as the textile industry, in this case) the margin tends to erode, as competitors who sell similar products but at lower prices arise and force down prices, with a consequent erosion of the margin.. The only thing companies can do is to raise prices or reduce the variable cost. Let us see. Raising prices: in a sector with much competition prices can only be raised if the product is improved, that is, if the company innovates or even if it seeks new customers willing to pay a higher price. Again, the company must innovate or expand the business. To reduce the variable cost of production it is necessary to improve the production process, which means being more efficient.. 10.
(11) As we can see from the graph, the evolution of the average margin of the sector has been positive, as it has increased by 3.27 percentage points during the three years which have been analyzed in this work.. Half of the surveyed companies have improved their margin over this period. These companies are Zara, Kiabi, Primark and Sfera. It should be pointed out from this data that the company Kiabi experienced a surprising evolution, since it has grown from a negative margin of 17.73 % in 2011 to a positive margin of 1.6 % in 2013, ie, it has increased its margin by 19.33 % in three years.. On the other hand, it is also remarkable that the other half of the surveyed companies have seen their margins decrease as a result of the crisis and the reasons discussed above. These companies are Pepe Jeans, Cortefiel and Punto Roma. The highest drop has been experienced by the brand Pepe Jeans. The margin of this company has been reduced by 4.44 percentage points during the three years that have been analyzed in this study. Table 3 ROTATION. 2011. 2012. 2013. EVOLUTION. CORTEFIEL. 0,68. 0,71. 0,70. 0,01. ZARA. 1,06. 1,05. 1,08. 0,02. KIABI. 3,01. 3,05. 3,12. 0,12. PEPE JEANS. 0,82. 0,79. 0,72. -0,10. PRIMARK. 2,51. 2,25. 2,39. -0,11. PUNTO ROMA. 2,14. 1,96. 1,94. -0,20. SFERA. 1,11. 1,15. 1,30. 0,19. AVERAGE. 1,62. 1,57. 1,61. -0,01. Graphic 3 3,50 3,00 2,50 2,00 1,50 1,00 0,50 0,00. 2011-2013 ROTATION EVOLUTION. CORTEFIEL ZARA KIABI PEPE JEANS PRIMARK PUNTO ROMA. 2011. 2012. 2013. SFERA. 11.
(12) As we can see from the chart, the evolution of the average turnover of the sector has been negative, as it has been reduced by 0.01 during the period under our study. The decrease from one year to another in the rotation of the asset may indicate that the companies now employ a proportionately higher level of assets in order to generate sales. An improvement in the return on assets is probably based on a higher profit margin. Asset rotation can be maximized in two different ways: 1. Increasing sales in greater proportion of assets 2. Reducing assets in greater proportion to sales Half of the companies in question have improved their rotation along this period. These companies are: Zara, Kiabi, Cortefiel and Sfera. Again, it should be noted the favorable evolution experienced by Sfera, as the company has increased its asset turnover 0.19 between 2011 and 2013. On the other hand, the other half of the companies have seen their turnover drop as a result of the reasons already discussed above. These companies are Pepe Jeans, Primark and Punto Roma. The highest decrease has been experienced by Punto Roma, since the rotation of this company has been reduced by 0.2 during the three years that have been analyzed.. 2.1.2) 2013 ROA CROSS-SECTION Next, there is a table with decreasing values and a graph where the economic performance carried out during 2013 by each of the analyzed companies selected for the sample of textile and its components appear. Table 4. ROA 2013. ZARA. PRIMARK. KIABI. P.JEANS. SFERA. CORTEFIEL. P.ROMA. AVG. 27,96%. 5,25%. 5,00%. 4,68%. 4,45%. 3,66%. 1,14% 7,45%. 25,80%. 2,19%. 1,60%. 6,49%. 3,43%. 5,25%. 0,59% 6,48%. 1,08. 2,39. 3,12. 0,72. 1,3. 0,70. Components: MARGIN ROTATION. 1,94. 1,61. 12.
(13) Graphic 4. 2013 ROA 30,00% 20,00% 10,00% 0,00%. ROA 2013. The average profitability of the sector in 2013 is 7.45 %. This gives us insight of how efficient the management of the enterprises is when using their assets to generate revenue, or how good their businesses are. Although the average is quite good, there are two companies that stand out, both positively as negatively. In this case they are Zara and Punto Roma. As a result of its success, Zara is the company with greater profitability. In this case, the company has a ROA of 27.96 %, since, obviously, the higher the ROA, the greater the company’s profitability of assets and the better situation will be the company in, because Zara is making more money with a lower investment. Conversely, Punto Roma is the one which has a poorer ROA compared to the other companies analyzed.This company has obtained a ROA of 1.14 %. This result gives us an idea of the efficiency of the company’s inversions in assets to generate net income. It should be noted that, generally speaking, the ROA should be large enough, because it has to be kept in mind that even with this gain, the company still has to reward to debt and to shareholders, as well as to the State, in this case through corporate tax. Therefore, in this case a positive economic return does not simply imply that the company obtains a final benefit, because the company needs more investment for obtaining some profit. In order to facilitate ROA’s analysis and delve into the causes for its evolution, we will analyze its components. According to its decomposition, first the economic margin on sales, i.e., profit per unit sale, will be taken into account. It should be underlined that the result we have used in order to calculate the economic margin of each of the companies is net of interest and taxes on sales.. 13.
(14) Graphic 5. 2013 MARGIN 30,00% 20,00% 10,00% 0,00%. MARGEN. The average margin of the sample selected in 2013 is around 6.48 %, although it should be pointed out that the margin differs greatly from one company to another. The most remarkable differences can be seen between Zara and Punto Roma. Zara leads the chart with a high percentage of 25.84 %, unlike Punto Roma, which obtains 0.59 %. This gap of 25.25 percentage points can be easily explained because Zara has risen its margin as a result of the increase of the sales price of the goods, or maybe due to a reduction of its costs. Nevertheless, in many cases, achieving cost reduction seems more viable than the possibility of increasing the prices of products, since the latter may depend on the external behavior of the market where the company operates. In the second instance, active rotation —i.e., the level of sales for a given investment— will also be considered.. Graphic 6. 2013 ROTATION 4,00 3,00 2,00 1,00 0,00. ROTACIÓN. 14.
(15) The average rotation of the sample selected in 2013 is around 1.61. It should be noted that the rotation is similar in most companies. Companies which have a higher turnover are the companies known as "low cost", such as Kiabi with a rotation of 3.12, followed by Primark —with a rotation of 2.39. The increased turnover in both companies indicated a rise in sales over the increase in assets, or even a decrease in assets over the drop in sales, which implies an increase in profitability and efficiency, holding everything else constant. In conclusion, as ROA is the result of multiplying the margin by rotation, and rotation is similar in most businesses —what really explains that the behavior of ROA is the margin—, the difference of ROA is what has caused the different ratio results in each of the companies.. 2.2 RETURN ON EQUITY If return on assets was what remained to reward both lenders and shareholders, return on equity refers to remaining profitability which belongs exclusively to shareholders. This “return on equity” is also known as ROE (or financial profitability), and has two alternative definitions, as before or after tax: ROE = Profit before tax / Equity ROE = Result for the year / Equity In this measure of profitability the way of funding does have a great influence, as in the numerator, depending of the result, interests on the debt would have already been subtracted, being shareholders the only ones left to remunerate. For this reason, in the denominator only shareholder funds are included, namely equity. The following diagram shows this reasoning: Operating income - Operating Expenses = Operating result. Active (flow associated with economic activity). + Operating Income = Earnings before interest and taxes (EBIT) - Financial expenses (FE) = Brofit before tax (PBT). Flow associated with external funds. Flow associated with equity 15.
(16) Therefore, it gives rise to a comparison between the income which can be attributed to the property with the resources provided to the activity by that property. As for its interpretation, it should be stressed that the financial profitability does depend on the way the company finances itself. Return on equity can be studied as the effect of two different vectors: first, the vector that defines the economic management of assets, represented by the return on assets (ROA); and second, the vector that determines the financial management of the debt represented by the variable cost of debt (CF) and debt ratios (L). The breakdown of financial profitability in these two vectors is justified by the relationship between the variables that make up each vector, whose analytic relationship is set forth below: ROE = ROA + (ROA - CF) x L Apart from considering the factors that have an influence in the economic viability, return on equity incorporates the effect of the sources used by the company in order to fund those assets. Consequently, financial profitability (ROE) depends, first, on the economic profitability (ROA), and, second, on the relationship total assets/equity (L) and debt ratios (CF). In other words, the breakdown of the financial profitability allows to appreciate the extent to which its value is related to the management of the assets (ROA) or the management of the funding sources (financial structure or cost of itself). Return on equity is, therefore, equal to the economic profitability (ROA) plus/minus an additional factor, due to the use of external financing. This factor is called “leverage effect”, and its sign will vary depending on the profitability of assets whether they are or are not higher than the cost of debt, all weighted by the proportion that this debt represents in the global financial structure. ROE = ROA + Financial leverage effect Thus, to the extent that the interest with which the borrowed funds are repaid is higher/lower than the yield obtained for every euro of investment in assets, the beneficiaries/wronged ones by such differential would be contributors from the other kind of funding, ie, shareholders. So the relationship between economic profitability (ROA) and the cost of debt (CF) results in three possible scenarios:. 16.
(17) 1. If ROA > CF, the differential (ROA-CF) will be positive, resulting in a positive leverage effect and, therefore, ROE will excede ROA. 2. If RE < CF, the differential (ROA-CF) will be negative, due to a negative financial leverage effect, so ROE will be lower than ROA. 3. If ROA = CF, the differential (ROA-CF) will be void, so ROA equals ROE. If economic profitability is higher than the average cost of liabilities, as the relationship of debt grows, the company takes advantage of it in order to improve shareholder returns. If, nevertheless, the economic profitability is lower than the average debt rate, financial profitability decreases as debt increases the greater is debt ratio defined by L. Finally, if the economic returns are equal to half the interest rate, the effect of leverage gets nullified, so that the presence of debt does not determine the value of financial profitability. In this paper we will analyze the financial profitability of each of the companies selected for the sample of the textile sector. We can distinguish three different types of data used in economics and business management. These data which can be found in the analysis include: Time series (time or historical series). These are values of a variable over time. This means that a time series are a set of observations, which generally have a regular frequency on a particular variable, for different time points. Cross-sectional data: These are values for different subjects in a given time. That is, they are a set of observations of different individuals or evidence relating from the same point in time. Panel data: These data are a combination of time series data and cross-sectional data. In panel data observations on different units are obtained at different moments in time, it being understood that at least some parts of the units which information is collected from do not vary across periods. However, in this work we will only use the time series from 2011-2013 and the cross section of 2013 in order to analyze the ROE.. 17.
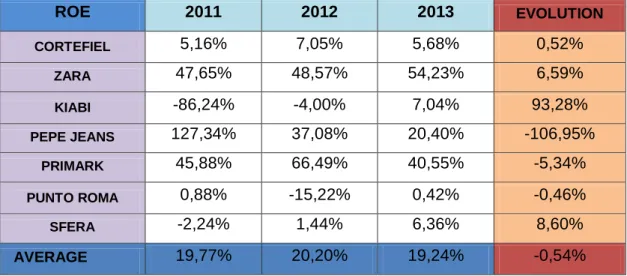
(18) 2.2.1) 2011-2013 TIME SERIES Next we show a series of charts and graphs, where the evolution of financial profitability and its components for the period 2011-2013 for each of the analyzed companies selected for the sample of the textile sector can be seen. Then, we discuss the most relevant aspects for each one of the graphs collected. Table 5 ROE. 2011. 2012. 2013. EVOLUTION. CORTEFIEL. 5,16%. 7,05%. 5,68%. 0,52%. ZARA. 47,65%. 48,57%. 54,23%. 6,59%. KIABI. -86,24%. -4,00%. 7,04%. 93,28%. PEPE JEANS. 127,34%. 37,08%. 20,40%. -106,95%. PRIMARK. 45,88%. 66,49%. 40,55%. -5,34%. PUNTO ROMA. 0,88%. -15,22%. 0,42%. -0,46%. SFERA. -2,24%. 1,44%. 6,36%. 8,60%. 19,77%. 20,20%. 19,24%. -0,54%. AVERAGE. Graphic 7. 2011-2013 ROE EVOLUTION. 150,00%. CORTEFIEL 100,00%. ZARA KIABI. 50,00%. PEPE JEANS PRIMARK. 0,00% 2011. 2012. -50,00%. 2013. PUNTO ROMA SFERA MEDIA. -100,00%. As we can see from the chart, the evolution of the average of the financial profitability of this sector has remained more or less constant, since the decrease in ROE from 2011 to 2013 has been small, only 0.54 %. Companies like Zara, Primark and Pepe Jeans have a financial return above the average, but the adverse change that has starred in the latter company it should be 18.
(19) pointed out; it has suffered a surprising decline, since it has gone from having a positive ratio of 127.34 % in 2011 to a ratio of 20.4 % in 2013. Comparing the ROE with earnings per share is a good way to see if the management is doing well. In the short term, the increase in earnings per share makes the stock prices move up, but, in the long term, what makes makes the future of the company possible is the profitability of the company. For example, a company reinvests its profits from the previous year in an account which has an interest rate of 3 % (what is a ridiculously low amount for a company), instead of giving it to its shareholders or reinvesting them in the company. This generates profit for the company, but not for its shareholders. Other examples of misuse of benefits, although they also generate increases in earnings per share, are share buybacks, acquisitions or mergers with rivals. These practices really do not make shareholder value grow, since the ROE would be negatively affected by the artificial increasement of capital. These practices make earnings per share grow without making the ROE, at least often, increase. This is the case of Pepe Jeans, which has managed to raise its earnings per share, but its ROE has decreased. This could mean that the management is doing something wrong. The other half of the companies, as Kiabi, Cortefiel, Sfera and Punto Roma have a financial profitability below the average, but the surprising evolution experienced by the company Kiabi is really remarkable, since it has gone from having a negative financial return of 86.24 % in 2011 to achieve a positive rate of 7.04 % in 2013, i.e., it has increased its financial profitability at 93.28 percentage points in just three years. That is why this company, in order to increase its ROE, has increased net profit margin, rotation of assets and debt. The expression that defines the financial returns can be decomposed into the elements that comprise it (ROA and financial leverage) in order to facilitate analysis and delve into the causes that justify its evolution. It is for this reason that we will also analyze this evolution. According to its decomposition, both the return on assets –reminder: this concept has already been explained in the previous section- and the effect of financial leverage will be taken into account. Now let us focus on financial leverage. Its evolution and the evolution of its components in each of the companies can be seen in the charts below:. 19.
(20) Table 6 FL. 2011. 2012. 2013. EVOLUTION. CORTEFIEL. 1,37%. 3,02%. 2,02%. 0,65%. ZARA. 23,44%. 23,62%. 26,27%. 2,84%. KIABI. -32,96%. -1,52%. 2,04%. 35,00%. PEPE JEANS. 118,35%. 30,83%. 15,72%. -102,63%. PRIMARK. 41,84%. 59,75%. 35,30%. -6,54%. PUNTO ROMA. -0,50%. -11,57%. -0,73%. -0,23%. SFERA. -0,7827%. 0,4773%. 1,9019%. 2,68%. AVERAGE. 21,54%. 14,94%. 11,79%. -9,75%. Graphic 8. 2011-2013 FL EVOLUTION. 140,00% 120,00%. CORTEFIEL. 100,00%. ZARA. 80,00%. KIABI. 60,00%. PEPE JEANS. 40,00%. PRIMARK. 20,00%. PUNTO ROMA. 0,00% -20,00%. 2011. 2012. 2013. -40,00%. SFERA MEDIA. -60,00%. As we can see from the chart, the evolution of the average of the financial leverage of this sector has been reduced by 9.75 percentage points over three years, as this ratio used to represent a 21.54 % in 2011, and it has been reduced by 11.79 % in 2013. Companies like Zara, Primark and Pepe Jeans have a financial leverage above average, although the adverse change that has starred the latter company should be noted, since it has suffered a surprising decline; it has gone from having a positive ratio of 118.35 % in 2011 to a rate of 15.72 % in 2013. The other half of the companies as Kiabi, Cortefiel, Sfera and Punto Roma have a financial leverage below average. The latter of this companies has an especially remarkable worsening, as its negative ratio has increased by 0.23 percentage points. We must also highlight the amazing evolution experienced by the company Kiabi,. 20.
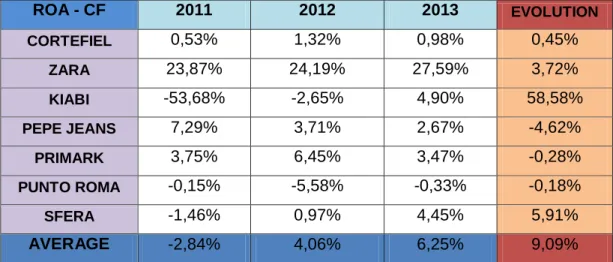
(21) which has gone from having a negative financial leverage of 32.96 % in 2011 to get a positive financial leverage of 2.04 % in 2013, i.e., it has risen the possibility to finance certain purchases of assets without the need for the money from the operation at this very time by 35 percentage points. The financial profitability before tax is the sum of economic profitability and leverage factor. The most important of this factor is what is known as margin leverage, i.e., (ROA - CF), the difference between profit extracted by the company from its assets and the average cost of financing through borrowings. This range determines that the financial profitability either increases or undermines regarding the economy. Table 7 ROA - CF. 2011. 2012. 2013. EVOLUTION. CORTEFIEL. 0,53%. 1,32%. 0,98%. 0,45%. ZARA. 23,87%. 24,19%. 27,59%. 3,72%. KIABI. -53,68%. -2,65%. 4,90%. 58,58%. PEPE JEANS. 7,29%. 3,71%. 2,67%. -4,62%. PRIMARK. 3,75%. 6,45%. 3,47%. -0,28%. PUNTO ROMA. -0,15%. -5,58%. -0,33%. -0,18%. SFERA. -1,46%. 0,97%. 4,45%. 5,91%. AVERAGE. -2,84%. 4,06%. 6,25%. 9,09%. Graphic 9 40,00% 30,00% 20,00% 10,00% 0,00% -10,00% -20,00% -30,00% -40,00% -50,00% -60,00%. 2011-2013 (ROA - CF) EVOLUTION. CORTEFIEL ZARA KIABI. 2011. 2012. 2013. PEPE JEANS PRIMARK PUNTO ROMA SFERA MEDIA. 21.
(22) Table 8 CF. 2011. 2012. 2013. EVOLUTION. CORTEFIEL. 3,27%. 2,70%. 2,68%. -0,59%. ZARA. 0,34%. 0,77%. 0,37%. 0,03%. KIABI. 0,39%. 0,18%. 0,09%. -0,30%. PEPE JEANS. 1,70%. 2,55%. 2,01%. 0,31%. PRIMARK. 0,29%. 0,30%. 1,78%. 1,48%. PUNTO ROMA. 1,53%. 1,93%. 1,47%. -0,06%. SFERA. 0,0008%. 0,0010%. 0,0032%. 0,002%. AVERAGE. 1,08%. 1,20%. 1,20%. 0,13%. Graphic 10. 2011-2013 CF EVOLUTION. 3,50%. CORTEFIEL. 3,00%. ZARA 2,50%. KIABI. 2,00%. PEPE JEANS. 1,50%. PRIMARK. 1,00%. PUNTO ROMA SFERA. 0,50%. MEDIA. 0,00% 2011. 2012. 2013. As it can be seen from the chart, the evolution of the average of the margin of leverage (ROA - CF) in this sector has increased by 9.09 percentage points over three years. With this graph we can explain the behavior of ROE that we have highlighted earlier in Pepe Jeans, Kiabi and Punto Roma. In the case of Kiabi, the leverage margin has evolved favorably, as it has grown from a negative margin of 53.68 % in 2011 to become a positive one of 4.9 % in 2013, so when the margin leverage is positive it means that ROA > CF, since in 2013 ROA is 5 % and CF are 0.09 %, which in turn also means that ROE > ROA, since in 2013 ROA is 5% and ROE is 7.04 %. When this occurs (ROE > ROA), it means that with every external euro invested in assets the company will get a higher return in the cost of the. 22.
(23) loan of this aforementioned euro. Consequently, the difference between what is gained with that euro and its cost is earned by shareholders. In the case of Pepe Jeans, the leverage margin has adversely changed, since it has been reduced by 4.62 percentage points in the reviewed period. Although the leverage margin remains positive, the ROE of the company has been reduced due to the drop of economic profitability by 4.31 percentage points, and to the increase of financial costs by 0.31 %. In the case of Punto Roma, the leverage margin has evolved unfavorably, as the negative margin has increased by 0.33 percentage points. Thus, when the margin leverage is negative it implies that ROA < CF, since in 2013 ROA is 1.14 % and CF are 1.47 %, which in turn implies that ROE < ROA, since in 2013 ROA is 1.14 % and ROE is 0.42 %. When this occurs (ROE < ROA), with every external euro invested in assets the company obtains a lower return in the cost of the loan of this aforementioned euro. Consequently, the difference between the cost of this euro and what is gained with it, reduces the shareholder’s remaining wealth. Therefore, the determinant of the relationship between economic profitability and financial profitability is the leverage margin. The leverage factor simply multiplies the effect of an external euro by the proportion of external euros that exists in the financial structure of the company. If the margin leverage is positive, the shareholders are making money thanks to every external euro introduced in the company. As a result, external resources should be increased and, therefore, the debt ratio and leverage ratio should also be increased. Otherwise, when the margin leverage is negative, it should be appropriate to reduce the proportion of external resources in the company.. 23.
(24) 2.2.2) 2013 CROSS-SECTION Next, there is a table and a graph ordered from the highest values to the lowest ones. In both of them we can see the financial return of 2013 for each of the analyzed companies selected for the sample of textile sector, as well as its components. Table 9 ZARA. ROE 2013:. PRIMARK P.JEANS. KIABI. SFERA CORTEFIEL P.ROMA. AVG. 54,23% 40,55% 20,40% 7,04% 6,36%. 5,68%. 0,42% 19,24%. ROA. 27,96%. 4,68% 5,00% 4,45%. 3,66%. 1,14%. FL :. 26,27% 35,30% 15,72% 2,04% 1,90%. 2,02%. -0,73% 11,79%. Components:. . Debt(L). * ROA - CF. 5,25%. 0,95. 10,17. 27,59%. 3,47%. 5,88. 0,42. 0,43. 2,67% 4,90% 4,45%. 2,06. 7,45%. 2,21. 0,98%. 3,16. -0,33% 6,25%. Table 10. ZARA. CF 2013 0,37%. PRIMARK. P.JEANS. 1,78%. 2,01%. KIABI. SFERA. 0,09% 0,003%. CORTEFIEL. 2,68%. P.ROMA. 1,47%. AVG. 1,20%. Graphic 11. 2013 ROE 60,00% 50,00% 40,00% 30,00% 20,00% 10,00% 0,00%. ROE 2013:. The average of the financial profitability of this sector in 2013 is 19.24 %. This gives us an idea of how efficient the management of enterprises is in the use of its net worth in order to generate income, or of how good their deals are. Also, the amount of net income returned as a percentage of net worth can be seen as well. Although the 24.
(25) average is good, there are two companies that stand out, both positive as negative. In this case they are Zara and Punto Roma, respectively. The ideal situation is to obtain the maximum financial return, since the goal of every business is maximizing their shareholder’s wealth. In both companies, Zara and Punto Roma, a positive ROE is obtained, although it should be noted that the returns earned by Zara (54.23 %) are much higher than in the case of Punto Roma (0.42 %). A company that has a high ROE, as in the case of Zara, is more likely to be a company that is able to generate cash and, therefore, generate more wealth for its shareholders. When comparing companies placed in the same sector, it is always better to choose the ones with a higher ROE. Typically, ROE range between 10 % and 20 %. Companies with less than 10 % are generally "bad" investments (slow growth) —such as Punto Roma—, whereas companies with more than 20 %, are generally companies with clear competitive advantages. However, companies with high ROE may cause difficulties in growth towards the future just because investing higher amounts of cash to a higher interest rate is quite difficult if the company has more and more cash available to be invested. One cannot always reinvest at higher rates; the reason: the power of compound interest. In order to facilitate its analysis and delve into the causes for the evolution of the ROE, we will analyze its components. According to its decomposition, economic profitability —which has already been explained in the previous section— and the effect of financial leverage will be taken into account. Now let us focus on financial leverage, which is synonymous with debt, because it is usually said that a company is financially leveraged when in debt. Financial leverage measures the possible positive effect of debt. It is defined as the more than proportional variation that occurs in financial performance as a result from variations in economic performance, being indebtedness the cause of this variation. Its evolution and its components in each of the companies can be seen below:. 25.
(26) Graphic 12. 2013 Financial leverage 40,00% 30,00% 20,00% 10,00%. Apalancamiento financiero. 0,00% -10,00%. Graphic 13. 2013 Debt (L) 12,00 10,00 8,00 6,00 4,00 2,00 0,00. * Endeudamiento (L). Graphic 14. (ROA - CF) 2013 30,00% 25,00% 20,00% 15,00% 10,00% 5,00% 0,00% -5,00%. * ROA -CF. 26.
(27) Graphic 15. CF 2013 3,00% 2,50% 2,00% 1,50% 1,00% 0,50% 0,00%. CF 2013. In this case, companies that stand out positively are, in the first and second place respectively, Primark and Zara. On the other hand, the company that highlights adversely is Punto Roma. In the case of Zara, according to the equation of financial leverage, return on assets will be higher than the economic profitability when the differential (ROA - CF) is positive, as long as the L ratio (debt) is nonzero. In turn, the L ratio produces a lever effect or multiplier on the differential (ROA - CF), regardless of whether it is positive or negative. The spread is positive in 27.59 points, but, when L < 1, the multiplier effect converts the value of leverage effect on 0.2627 (0.2759 x 0.95). In this case, the financial creditors are getting paid less 0.37 % than the one the company gets for managing their assets 27.96 %, so this lower remuneration of external capital reverts to a higher return on the equity of the company 28,33% (0.2796 + 0,0037). That is, if the return on assets is higher than the average cost of funds, as the relationship of debt grows, the company takes advantage of it in order to improve shareholder returns. If, converserly, the return on assets is lower than the average cost of debt, then the financial returns will be lower than the economic viability, as it happens in the case of Punto Roma. In this company, the excess of compensation of debt 1.47 % implies that the owners of the company are going to receive a compensation for their contributions lower 0.42 % than the one obtained by the entity thanks to the management of its activities 1.14%. That is, if the profitability is lower than the average rate of debt, financial profitability decreases as debt increases the greater is the debt ratio defined by L.. 27.
(28) 3. LIQUIDITY ANALYSIS: The purpose of liquidity analysis is to evaluate the ability of the company to meet its short-term payment commitments, for which it must have enough cash at the right time. The common or typical activity of the company should be the one which generates such resources, and the adequacy of current receipts and payments resulting from that activity is also required. Otherwise, to the extent that this synchronization would not exist, the company would have to liquidate the available assets or go into debt. The central component of the liquidity of the company is the working capital or working asset, both denominations representing the same magnitude, although they have different approaches. Working capital is defined as the difference between current assets and current liabilities. From a different perspective, working capital is the difference between permanent capital (plus non-current liabilities equity) and noncurrent assets. This long-term perspective it is also known as working asset. Grouping on the one hand the current portion and on the other hand the permanent one: Current Assets - Current Liabilities = Net worth + Current liabilities - Non-current assets We have two versions of the working capital: That portion of current assets financed by permanent resources: Working capital = Current assets - Current liabilities That part of the permanent resources released to fund current assets: Working capital = Net worth + Current liabilities - Non-current assets This second definition, as it has been stated earlier, is also known as working asset. In short, with any of the definitions, working capital absorbs offsets from the expected flows of receipts and payments. There are several indicators that are used in order to come to the knowledge of the liquidity of the company, among which are the following: Working capital or working asset, the average period of financial maturity, working capital needed, the current ratio, acid test ratio, the liquid ratio, the basic financial ratio and other liquidity ratios.. 28.
(29) Working capital represents a fundamental way of measuring the liquidity of the company or also its short-term solvency. However, it presents a serious problem in its application, by not allowing to compare data from different years from a determinate company, or even compare different companies one to each other. This is because working capital is expressed in absolute magnitudes, which causes that it cannot be compared when the sizes of the companies are not identical. Thus, that a large drugstore chain has a working capital of 30 million euros and a small supermarket has a working capital of 30,000 euros, does not imply that the first one has a better liquidity, as both measures are not comparable since they are companies with very different sizes. In order to overcome this problem, ratios are typically used, since they are only relative magnitudes measuring some aspect of the company and allow comparisons between different years or different enterprises. In this paper we will focus on the current ratio and in the average period of financial maturity from both perspectives, from the analysis of 2011-2013 time series and the analysis of cross-section from the year 2013.. 3.1 CURRENT RATIO This ratio measures the relationship between current assets and current liabilities, although not as a remainer, but as quotient. Therefore, the current ratio is defined as: CR = Current assets / Current liabilities It indicates the ability of the company to generate, with achievable short-term bills, enough liquid resources to meet its payment obligations as recorded in the current liabilities. Thus, current assets show the potential of the company to meet its payment obligations with a due date equal or lower than a year. The higher the ratio, the greater the guarantee given to short-term creditors. This ratio is also called “distance to default”. The suspension of payment generally occurs when the current liabilities exceed current assets, therefore, when the ratio is less than 1. Because of this, the farther from this value it is found, the less likely it is to take part in this process. And, the closest from this value it is, any additional problems that could arise in sales or debt collection of the company could make it impossible for the company to meet their payment obligations. However, it all depends on the business sector in which the company is located.. 29.
(30) 3.1.1) 2011-2013 CURRENT RATIO TIME SERIES Both the next table and graph show the evolution of this ratio during the period 20112013 for each of the companies analyzed in the selected sample from the textile industry. Then, the most relevant aspects of the chart will be discussed. Table 11 CURRENT RATIO. 2011. 2012. 2013. EVOLUTION. CORTEFIEL. 0,95. 0,89. 0,79. -0,16. ZARA. 0,91. 0,96. 1,07. 0,16. KIABI. 1,52. 2,74. 2,54. 1,02. PEPE JEANS. 1,23. 1,02. 1,07. -0,16. PRIMARK. 0,65. 0,64. 1,37. 0,72. PUNTO ROMA. 1. 1,09. 0,66. -0,34. SFERA. 0,81. 1,02. 1,13. 0,32. AVERAGE. 1,01. 1,19. 1,23. 0,22. Graphic 16. 2011-2013 CURRENT RATIO EVOLUTION 3. CORTEFIEL. 2,5. ZARA. 2. KIABI PEPE JEANS. 1,5. PRIMARK. 1. PUNTO ROMA. 0,5. SFERA. 0 2011. 2012. 2013. MEDIA. This financial ratio makes possible to value the ability of the partnership to meet its financial commitments in the short term and also to have sufficient liquidity to proceed. As we can see from the chart, the evolution of the average current ratio of this sector has been steady, as it has barely increased. The growth has been 0.22. Half of the surveyed companies have improved their ratio throughout this period. These companies are Zara, Kiabi, Primark and Sfera. However, the evolution experienced by the company Kiabi should be especially pointed out, since it has grown from a ratio of 30.
(31) 1.52 in 2011 to a ratio of 2.54 in 2013, ie, it has increased its ratio to 1.02 in three years. On the other hand, it is also remarkable that the other half of the companies that have been reviewed in this work have seen their current ratio during this period decrease. These companies are Pepe Jeans, Cortefiel and Punto Roma. The most notable drop in the sector has been experienced by the brand Punto Roma. The ratio of the company has deteriorated; it has gone from 1 in 2011 to be reduced by 0.66 in 2013.. 3.1.2) 2013 CURRENT RATIO CROSS-SECTION Both the following table ordered from high to low values and the graph show the current ratio of 2013 of each of the analyzed companies selected for the sample of textile sector. Table 12. KIABI. CR.2013 2,54. PRIMARK. 1,37. SFERA ZARA. 1,13. 1,07. P.JEANS. CORTEFIEL. P.ROMA. AVG. 1,07. 0,79. 0,66. 1,23. Graphic 17. 2013 CURRENT RATIO 3 2,5 2 1,5 1 0,5 0. CR 2013. The ideal situation for companies is not presenting the highest possible ratio, as high liquidity indicates a relieved financial situation, but also the existence of idle assets with a high opportunity cost. Therefore, excessive liquidity can lead to a decrease in profitability, as resources remain idle without generating any profit.. 31.
(32) Thus, it is considered that the optimum value of this ratio ranges between 1.5 and 2. It depends on the activity sector the companies belong to. If the activities of the analyzed companies are carried out in an area of rapid recovery and expanded payment, as it happens in our case, they can work seamlessly with lower ratios. This may explain the average current ratio of the sector in 2013, the which is 1.23. Companies like Zara and Kiabi have a current ratio above average, though the current ratio of Zara should be primarily highlighted, since it has reached a ratio of 2.54 in 2013. Many analysts consider that a current ratio of 2.00 is a security indicator. As it can be easily seen, this company is the one that has a greater ability to meet its payment obligations. Other companies such as Cortefiel, Sfera, Punto Roma, Pepe Jeans and Primark have a ratio below average, although it should be noted the unfavorable ratio that Punto Roma has reached, since it had a negative ratio of 0.66 in 2013. We have seen that the bankruptcy occurs when the current ratio is below 1; in this case, any additional problems that could arise in the sales of the company or in the debt recovery could face the company with the impossibility of meeting their payment obligations.. 3.2 AVERAGE PERIOD OF FINANCIAL MADURATION The average period of maturity, or operating cycle, is the period between the company inversions in the factors of production (purchases of goods or raw materials) until this investment is recovered by charging customers for sold production. This period of maturity of commercial enterprises, as in our case, is divided into two sub-periods: SP = Goods storage period CP = Customer collection period Therefore, the maturity period of commercial enterprises is defined as the addition of storage and collection periods: APM = SP + CP Instead, the maturity period of industrial enterprises is divided into four sub-periods: RMSP = Raw materials storage period MP = Manufacturing period 32.
(33) FPSP = Finished products storage period CP = Customer collection period Therefore, the maturity period of industrial enterprises is defined as the sum of the following periods: APM = RMSP + MP + CP + FPSP In the event that there are credits granted by suppliers of goods and production services, the company has to finance the inversion in current items not funded by such suppliers with its own or external long-term funds. The period of time which it is not financed by specific sources of exploitation is often called “financial maturity period”. The period of financial maturity is defined as the average maturity period less the time allowed by suppliers for payment. Thus, the average maturity period of financial trading companies, as in our case: APFM = AP + CP - PS And of industrial enterprises: APFM = RMSP + MP + FPSP + CP – P. 33.
(34) 3.2.1) 2011-2013 APFM TIME SERIES Next we show a table and a graph, where the evolution of PMMF and of its components for the period 2011-2013 appears for each of the companies analyzed from the selected sample of the textile sector. Then, the most relevant aspects of the chart will be discussed. Table 13 PMMF. 2011. 2012. 2013. EVOLUTION. CORTEFIEL. -5,05. 28,86. 53,98. 59,04. ZARA. -32,70. -31,26. -19,92. 12,78. KIABI. 75,75. 74,98. 67,61. -8,14. PEPE JEANS. 94,68. 105,96. 120,52. 25,84. PRIMARK. 47,01. 66,87. 63,74. 16,73. PUNTO ROMA. 29,78. 146,53. 153,72. 123,94. SFERA. 71,19. 95,93. 96,29. 25,10. AVERAGE. 40,09. 69,69. 76,56. 36,47. Graphic 18. 2011-2013 APFM EVOLUTION 200,00. CORTEFIEL ZARA. 150,00. KIABI. 100,00. PEPE JEANS 50,00. PRIMARK. 0,00. PUNTO ROMA 2011. 2012. 2013. -50,00. SFERA. As we can see from the chart, the evolution of the mean of the average period of financial maturity of the sector has not been very favorable, as it happened to be a period of 41 days in 2011 to one of 77 days in 2013, i.e., companies have increased by 36 days the period of time between their payment to suppliers until they recover the money by charging customers during the analyzed period. All companies surveyed —except for Kiabi— have increased their APFM throughout this period. However, the surprising evolution experienced by the company Punto Roma should be pointed out, since it has increased its APFM by 124 days during these 34.
(35) three years, which indicates that it would probably have to resort to increased external financing, which could induce it to have solvency problems. On the other hand, the decreased APFM of Kiabi should also be noted, as it has managed to reduce its APFM in eight days, what will allow the company to reduce their costs stem from applying for external financing. The expression that defines the average period of financial maturity can be decomposed into the elements that comprise it (average period of economic maturity the period of payment to suppliers) in order to facilitate its analysis and delve into the causes that justify their evolution. It is because of this reason that we will also analyze its evolution. Table 14 APEM. 2011. 2012. 2013. EVOLUTION. CORTEFIEL. 22,53. 52,81. 89,11. 66,58. ZARA. 61,82. 63,22. 60,75. -1,07. KIABI. 76,19. 77,02. 70,66. -5,53. PEPE JEANS. 181,77. 195,12. 205,40. 23,63. PRIMARK. 79,15. 93,26. 87,00. 7,85. PUNTO ROMA. 124,64. 155,57. 169,72. 45,08. SFERA. 130,11. 158,41. 155,19. 25,07. AVERAGE. 96,60. 113,63. 119,69. 23,09. Graphic 19. 2011-2013 APEM EVOLUTION 250,00. CORTEFIEL. 200,00. ZARA. 150,00. KIABI. 100,00. PEPE JEANS PRIMARK. 50,00. PUNTO ROMA. 0,00 2011. 2012. 2013. SFERA. 35.
(36) By calculating the average period of maturity we will see how long (in days) the companies take to recover every dollar invested in their operating cycle. This period is called a Money-Money or Money-Commodity-Money (M-C-M) cycle, since it measures the average time the company takes to re-monetize every euro invested in its operating cycle. The longer this period is, the longer the company will take to recover every euro invested in its operating cycle and, therefore, the greater will be the time needed to obtain benefits for every euro spent. The company is interested in its average period of maturity to be not too high, although, depending on the type of activity, this period may be higher or lower. As we can see from the chart, the evolution of the mean of the average period of economic maturity of the sector has not been very favorable, as it happened to be a period of 97 days in 2011 to one of 120 days in 2013, i.e., companies have increased by 23 days the period of time to recover every dollar invested in their operating cycle. All companies analyzed except Zara and Kiabi have increased their APEM over this period. Also, the unfavorable evolution experienced by the company Cortefiel should be noted, since it has increased its APEM in 67 days during these three years. On the other hand, it is worth mentioning the decrease of the APEM Kiabi has achieved during the analyzed period, as it has managed to reduce its APEM by six days; this will have a positive impact on company costs, as the need for external financing will be reduced. Table 15 PS. 2011. 2012. 2013. EVOLUTION. CORTEFIEL. 27,58. 23,95. 35,12. 7,54. ZARA. 94,52. 94,48. 80,66. -13,86. KIABI. 0,44. 2,04. 3,05. 2,60. PEPE JEANS. 87,09. 89,17. 84,89. -2,21. PRIMARK. 32,14. 26,39. 23,27. -8,87. PUNTO ROMA. 94,86. 9,05. 16,00. -78,86. SFERA. 58,92. 62,48. 58,89. -0,03. AVERAGE. 56,51. 43,94. 43,13. -13,38. 36.
(37) Graphic 20. EVOLUTION PS 2011-2013 100,00. CORTEFIEL. 80,00 60,00. ZARA. 40,00. KIABI. 20,00. PEPE JEANS. 0,00 2011. 2012. 2013. PRIMARK. As we can see from the graph, the evolution of the average period of payment to suppliers in the sector has been reduced by 13 days, i.e., suppliers have increased their bargaining power during the reviewed period. As a result, companies will experience a greater difficulty when using providers in order to finance part or all of their operating cycle. All companies except for Kiabi and Cortefiel have reduced their payment terms to suppliers. The most significant reduction has been featured by Punto Roma, which has reduced its payment terms to suppliers in 79 days. The company will have to resort to external financing, and it should be noted as well that its APEM has also been increased. This company will necessarily have to use these external funds to finance its operating cycle. On the other hand, the company Cortefiel should be highlighted, since it has increased its bargaining power with suppliers in eight days during the reviewed period. This will have a positive impact on costs of the company with regard to funding. In conclusion, the APFM is the result of subtracting the PS to the APEM. In most companies both factors have increased over the period analyzed, but what has had more weight in obtaining the APFM in each the years has been the increase of the days that companies take to complete their operating cycle (PSEM).. 37.
(38) 3.2.2) 2011-2013 APFM CROSS-SECTION Next, there is a table and a graph ordered from the highest values to the lowest ones. In both of them we can see the 2013 PMMF of each of the companies analyzed for the selected sample of the textile sector and its components. Table 16 P.ROMA. P.JEANS. SFERA. KIABI. PRIMARK. CORTEFIEL. ZARA. AVG. APFM 153,72. 120,52. 96,29. 67,61. 63,74. 53,98. -19,92. 76,56. Graphic 21. APFM 2013 200,00 150,00 100,00 50,00 0,00 -50,00. PMMF. Table 17 P.JEANS. APEM 205,40. P.ROMA. SFERA. 169,72 155,19. CORTEFIEL. PRIMARK. KIABI. ZARA. AVG. 89,11. 87,00. 70,66. 60,75. 119,69. Graphic 22. APEM 2013 250,00 200,00 150,00 100,00 50,00 0,00. PMME. 38.
(39) Table 18. PS. P.JEANS. ZARA. SFERA. 84,89. 80,66. 58,89. CORTEFIEL PRIMARK. 35,12. 23,27. P.ROMA. KIABI. AVG. 16,00. 3,05. 43,13. Graphic 23. PS 2013 100,00 80,00 60,00 40,00 20,00 0,00. PP. When we talk about commercial companies, the average maturity period is determined by taking into account the different economic process they have, since they can be characterized and differentiated from industrial companies because they are engaged in sales of products purchased from abroad without having to undergo any transformation process, so in this case we should not include the manufacturing stage, and we should also take into account only a single storehouse. For commercial companies, we will divide it into two subperiods: ● Economic or technical maturity period (APMe): It indicates how many days the company takes to complete its operating cycle. ● Financial maturity period (APMf): This period will be telling us how long we will have to autofinance our operating cycle. Both periods are different in that while the APEM starts counting from the very moment the company makes the investment in its operating cycle —that is, since it makes the order to their suppliers—, the APFM starts running from the very moment the company pays the invoice to its supplier (if the purchase is on credit this payment would be subsequent to the reception of goods; if it is paid with cash, we would have the same scenario than in the previous case; and if payment is completed in advance, it would be prior to the time of receipt of the goods). 39.
(40) The operating cycle is the period between the purchase of raw materials by the company until it gets to sell the acquired merchandise and also gets paid for it. That is, it is the time it takes to recover the investments made in production and sale (current assets). The company commits money to perform its production process, and that money cannot be recovered until the sales made are paid back (the amount of money invested is recovered and a benefit is obtained, or, in the worst scenario, there is a loss of money). The operating cycle is longer or shorter depending on the activity of the company (the manufacture of ships is not the same as the manufacture done by a third party, as in our case). The company is necessarily interested in reducing their maturity period to the top and in repeating the cycle as often as possible, because that makes its profits increase. Generally speaking, it can be said that the company will be interested in decreasing the length of each period in order to recover its investments as soon as possible, and thus, reduce the necessary funding. If the company is able to reduce its APM, apart from having lower costs, it will have less financial needs, and it will make its profitability increase. By reducing the average storage period or the average sales period (increasing their productivity and improving their times sales), the money invested in the stores is reduced. The same effect is achieved by reducing the average collection period (charging customers sooner) or extending the average period of payment to suppliers (negotiating with suppliers over long periods of payment). As we can see from the chart, the evolution of the mean of the average period of economic maturity of the sector in 2013 is 120 days, period of time that companies take to get the money invested in their operating cycle. However, their APFM is 77 days, which indicates that companies are not funding their operating cycle through their suppliers. As companies take on average 120 days to complete their operating cycle, and their suppliers get paid after 43 days, which is the reason why companies from this sector have to resort to external financing, leading to a rise in its operating cycle. In this cross-section analysis of 2013 two companies stand out: on the one hand Punto Roma, which has a APEM of 170 days. It can be said that the company takes on average 170 days to complete its cycle of exploitation or, what is the same, it takes 170 days to recover each euro of investment made in its operating cycle. In change, its APFM is of 154 days, which indicates that the company is not funding its operating cycle through its suppliers. As the company takes on average 170 days to complete its 40.
(41) operating cycle and its suppliers are paid after 16 days, it has to resort to external financing through long-and-short-term debt through credit institutions in order to be able pay suppliers. As a result of this strategy, the cost of their operating cycle will be more expensive. On the other hand, Zara should be highlighted as well, since it has a APEM of 61 days. It can be said that the company takes on average 61 days to complete its cycle of exploitation or, what is the same, it takes 61 days to recover each euro it invested in its operating cycle. It is the company, out of all of the surveyed companies, that takes a shorter payback. In change, its APFM is of -20 days and, as we can see, the value of APFM is negative, indicating that the company is funding 100 % of their operating cycle through their suppliers, as the company takes on average 61 days to complete its operating cycle and the funding obtained from its suppliers is 81 days higher than the average period of maturity.. 4. CONCLUSIONS: After creating a template of indicators and analyzing the profitability and liquidity of each of the selected companies, we have reached a series of conclusions that allow us to show the most significant differences between Zara and its closest competitors: With regard to profitability analysis, the evolution of the average profitability of competitors has been favorable. The ratio has increased by 5.91 percentage points in the period under review, as it has gone from having a negative average return of 6.09 % in 2011 to achieve a positive rate of 4.03 % in 2013. This average has been positively affected by the surprising evolution experienced by the company Kiabi, which has gone from having a negative ratio of 53.28 % in 2011 to a positive ratio of 5 % in 2013; i.e., it has increased its economic profitability in 58.28 percentage points in three years. However, despite this positive trend, Zara continues to have a higher economic profitability, achieving a return of 24.21 % in 2011, to reach, in 2013, a return of 27.96. Its growth has also been higher, since the ratio has increased by 10.12 percentage points in that period, unlike its competitors’, which has increased by 5.91 percentage points. The expression that defines the economic returns can be decomposed into the elements that comprise it (margin and rotation) in order to facilitateits analysis and. 41.
(42) delve into the causes that justify their evolution. It is for this reason that we have also analyzed its evolution. The evolution of the average margin of competitors has been favorable, as it has increased by 4.75 percentage points over the three years under study. This average has been positively affected by the margin growth undergone by the company Kiabi, which has gone from a negative margin of 17.73 % in 2011, to get to reach a positive margin of 1.6 % in 2013; i.e., it has increased its margin by 19.33 % in three years. Despite the favorable margin growth of its competitors, Zara has achieved amazing margins. This company has reached a margin of 22.75 % in 2011 and has get to increase it to 25.80 % in 2013; growth in the analyzed period was of 3.31 percentage points, a percentage slightly lower than its competitors’ —4.75 percentage points—, although it should be noted that the margins of Zara are significantly much higher than those of its competitors. This disparity can be explained because Zara has raised its margin as a result of an increase of the selling price of the goods or due to reduced costs. However, in many cases, achieving a reduction in costs seems more viable than the possibility of increasing the prices of products, since the latter may depend on the external behavior of the market where the company operates. The average rotation of the competitors during the period analyzed is high, as during the three years under review the rotation was greater than 1. Its evolution has been constant between 1.6 and 1.7, however, Zara’s rotation is lower than its competitors’, and its evolution has also been steady, between 1.06 and 1.08. The fact that Zara has a lower rotation than its competitors is because it employs a proportionately higher level of assets to generate sales as a result of the heavy investment that it performs. In short, the key difference between the economic profitability of Zara and that of its competitors is the margin, and this is due to good management of the company, as the gross margin is by far the largest of all the companies analyzed. Relating these two concepts —margin and rotation— with strategic marketing, we should remember that there are companies that achieve high profitability by selling few highly differentiated products, but with a wide margin. It is a strategy of differentiation with high margin and a small rotation, as is Zara’s case, with a very superior margin than the rest and a rotation lower than most of them. While others manage to sell many products with a small margin, that is a costs leadership strategy with a low margin and high turnover, as it happens with Kiabi and Primark, "low cost" companies.. 42.
Figure


+4


Documento similar
If the concept of the first digital divide was particularly linked to access to Internet, and the second digital divide to the operational capacity of the ICT‟s, the
1. S., III, 52, 1-3: Examinadas estas cosas por nosotros, sería apropiado a los lugares antes citados tratar lo contado en la historia sobre las Amazonas que había antiguamente
Since such powers frequently exist outside the institutional framework, and/or exercise their influence through channels exempt (or simply out of reach) from any political
In the previous sections we have shown how astronomical alignments and solar hierophanies – with a common interest in the solstices − were substantiated in the
While Russian nostalgia for the late-socialism of the Brezhnev era began only after the clear-cut rupture of 1991, nostalgia for the 1970s seems to have emerged in Algeria
We advance the hypothesis that fraudulent behaviours by finan- cial institutions are associated with substantial physical and mental health problems in the affected populations.
The recent financial crisis, with its origins in the collapse of the sub-prime mortgage boom and house price bubble in the USA, is a shown to have been a striking example
MD simulations in this and previous work has allowed us to propose a relation between the nature of the interactions at the interface and the observed properties of nanofluids:
