Capital goods imports and long run growth: Is the Chinese experience relevant to developing countries?
25
0
0
Texto completo
(2) Capital goods imports and long-run growth in developing countries: The Chinese experience.1 M.J. Herrerias†. Vicente Orts§. †The University of Nottingham, School of Contemporary Chinese Studies §Department of Economics and Institute of International Economics, Universitat Jaume I. 5 October 2012. Abstract In this paper, we analyse the role played by capital goods imports in the long-run growth of developing countries. We focus in the case of the Chinese economy in the last few decades. We find evidence that the ratio of imported to domestic capital goods, that is, the composition of investment, as well as the capital accumulation (both physical and human) were key determinants of the long-run growth rate of per capita GDP over the analysed period. Furthermore, our results are also consistent with the hypothesis that the link between trade openness and long-run growth operates mainly through imports. This finding supports some recent developments of Schumpeterian models of growth, and the very specific economic policy recommendations arising thereof. In short, these models state that, in the early stages of growth, government intervention to encourage an investment-based strategy, with emphasis on large investment efforts and the adoption of foreign technology could be an appropriate strategy for development. JEL Classification: O40, O53, F1 Key Words: Openness, imports of capital goods, capital accumulation, growth, China. 1. Contact: Universitat Jaume I, Department of Economics. Avd. Sos Baynat s/n. 12071, Castellon, Spain. Email: [email protected]; [email protected] V. Orts gratefully acknowledge financial support from the Spanish Ministry of Education and Science and FEDER, (project ECO2011-28155), from the Generalitat Valenciana (PROMETEO/2009/068) and Fundació Caixa CastellóBancaixa (P1-1B2010-17). The usual disclaimer applies..
(3) 1. Introduction Today, nobody doubts that openness to trade is a source of long-run economic growth. However, understanding the channels through which trade can enhance growth remains a widely policy debated question. One of the key points of such discussion lies in the fact that it is not easy to isolate the channels that can produce the expected positive impact of openness on growth and that these channels may differ both from country to country and depending on the stage of development. Economists have made an effort to disentangle this piece of the puzzle in the international economics literature, but there are still questions that have still not be dealt with and need answering to be able to fully understand the empirical relation between trade and growth, and then to make the best economic policy recommendations in each situation.2 What is the right mix of policies that have to implement a country willing to liberalize their trade? For example, is enhanced growth always primarily due to the impact of openness on exporting or on importing activity? Has increasing competition and the improvement of scale associated with increased trading volume (exports and imports) been the most valuable conduit of growth? Or is the positive effect of openness on growth to be found in the improvement of the country’s technological level due to the imported foreign intermediate and capital goods? Obviously, the answer to these questions affects the strategy of liberalization and the composition of economic policies. In this paper, we address some of these questions in a case study: the Chinese economy over the last few decades. From the standpoint of growth models, it seems that the links between trade openness and growth should be stronger through imports than exports, and this is especially true for certain types of imports. First of all, in a wide range of growth models, sustained growth will only be possible in the long run if there are large sustained productivity gains to counteract the tendency towards the diminishing returns induced by the accumulation of capital. These gains can arise from two channels: from investment in R&D and the innovation process that incorporate. 2. For a recent survey of the literature on trade liberalization and economic performance in developing countries, see Santos-Paulino (2010).. 2.
(4) technological progress into productive activity, on the one hand, and from a more efficient capital accumulation, on the other. But, as pointed out by Aghion and Howitt (1998), the critical question is that “capital accumulation and innovation should not be regarded as distinct causal factors but as two aspects of the same process”.3 In fact, new technologies are usually embodied in intermediate and capital goods and it is through capital accumulation that they gradually become incorporated into the economy.4 And indeed for developing countries to adopt policies aimed at increasing openness to trade and more specifically the liberalization of imports of intermediate and capital goods, can help improve both channels and thereby sustain productivity gains and growth in the long term. International trade theory tells us that, regardless of the nature of the sources of comparative advantage, countries that liberalised their international trade tend to specialize and export goods that are produced more efficiently, thus achieving static gains from trade. Developing economies often have a comparative advantage in the production of unskilled or semi-skilled labour-intensive goods, whereas developed countries have an advantage in the production of capital and technology intensive goods. It is well known that the majority of production and hence of world exports of capital goods are concentrated in a few developed countries, while 5. developing countries tend to be importers of such goods. Thus, for developing countries, imports of capital goods are a way to improve both the efficiency of capital accumulation6 and the efficiency of domestic production processes due to the technological progress embodied in these imported goods.7 Additionally, there is a growing body of literature suggesting that, in open economies, the interaction between the domestic and foreign processes of innovation and 3. Aghion and Howitt (1998), p.85. At the same time, many authors have underlined the empirical significance of machinery and equipment investment in economic growth. See for example the seminal works by De Long and Summers (1991) and, for the Chinese case, Herrerias and Orts (2010). 5 According to Keller (2004), “for most countries, foreign sources of technology are of dominant importance (90 per cent or more) for productivity growth”. In similar terms Eaton and Kortum (1996) stated that more than 50 per cent of growth in some countries can be attributed to innovation originated in countries like the United States, Germany or Japan. 6 See Lee (1995) and Mazumdar (2001). 7 See Aghion and Howitt (1998), Grossman and Helpman (1991a), Rivera-Batiz and Romer (1991), Coe et al. (1997) 4. 3.
(5) growth may itself become a new engine of long-run growth.8 However, this same literature emphasizes that the possible relationship of complementarity or substitutability between domestic and foreign innovation depends on the domestic institutions and policies of different countries and their stage of development. As stressed in Acemoglu et al. (2006), in the early stages of growth, the adoption by the government of economic policies aimed to promoting an investment-based strategy (with the emphasis on large investment efforts and adoption of foreign technology) might be appropriate to successfully enhance productivity and output growth even at the expenses of some non-competitive arrangements or market rigidities. However, despite this theoretical basis and the related economic policy recommendations, a significant part of the empirical literature has focused on the analysis of what has become known as the "export-led growth hypothesis", and export promotion policy has been the central element in the design of policies for growth of many developing countries. Nevertheless, this is probably not surprising in view of the successful growth experienced by the newly industrialized East Asian countries in the 1960s, based on trade liberalization and export promotion (World Bank, 1993).9 Nevertheless, a number of authors remain sceptical about the role played by exports as a key factor in the growth of these countries.10 Thus, Rodrik (1995) argued that the rapid growth undergone by these economies was caused more by the acceleration of investment, the boom in trade being a consequence rather than a cause of that process.11 Given the comparative disadvantage in capital and technological goods of these countries, the investment boom required an increase in imports and, given the foreign exchange constraints, a corresponding increase in exports. For some authors, even countries with a strong 8. See for example Acemoglu, Aghion and Ziliboti (2006), Aghion and Howitt (1998, 2005), Grossman and Helpman (1991b) or Rivera-Batiz and Romer (1991). 9 A recent review of the literature that discusses the positive effects of trade liberalization can be seen in Greenaway and Kneller (2007). 10 For example, Thangavelu and Rajaguru (2004) found that there is no causal effect from exports to productivity growth for Hong Kong, Indonesia, Japan, Taiwan and Thailand. However, the same authors found significant causal effects from imports to productivity growth in India, Indonesia, Malaysia, Philippines, Singapore and Taiwan. Similary, Lawrence and Weinstein (2001) were unable to find support for the view defending export-led growth in Japan and in their study they suggested that an important channel of growth has been neglected in this case: imports. 11 See also Rodrik (1999) and Rodriguez and Rodrik (2001).. 4.
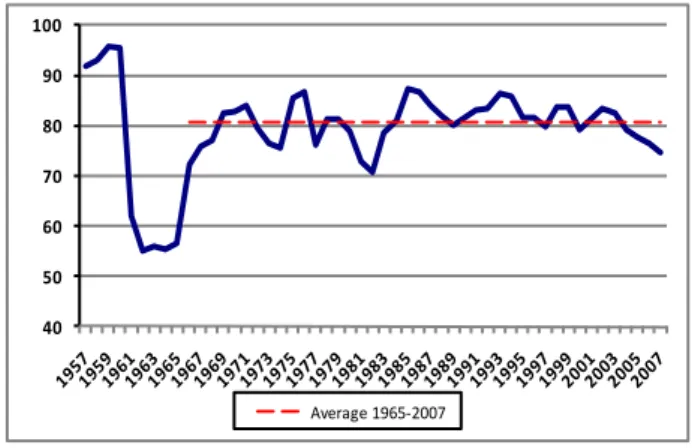
(6) export orientation have to rely on imported technology as a mechanism for developing the local technological capabilities in order to increase productivity and become competitive in the international markets.12 Our claim is that the history is not very different in the case of China and that, above all, imports of capital goods have been an additional source of growth. In fact, our empirical evidence indicates that there is a direct relationship between the relative proportion of foreign to domestic intermediate and capital goods used in the local production processes in China and its per capita GDP growth rate. Thus, instead of the cross-country approach taken by most empirical studies, which highlights the aspects that seem important to explain the average growth differences between countries, this paper focuses on just one single developing country, China, over the period 1965-2007.13 The approach used to conduct the analysis is multivariate time series estimation (the cointegrated VAR model). It is well known that China has developed its innovation strategy by combining imports of technology with domestic research and development.14 Imports of intermediate and capital goods have played a significant role and have shown different stages in the process of growth and development in China (Shi, 1998). However, the Great Leap Forward supposed a sudden break away from this policy, with a sharp drop in the share of the imports of capital goods in China's total imports (see Figure 1). Furthermore, after the failure of the Great Leap Forward, there was a change in the suppliers of these goods (from Russia to technologically more advanced countries like Japan and United States). Moreover, levels that would remain relatively stable throughout the period under consideration were only reached from 1965 or 1966 onwards. As shown in Figure 1, from 1965 to 2007 (the last year considered in this work), the imports of. 12. See Mody and Yilmaz (2002) and Busse and Groizard (2008). Nevertheless, there are also some studies that suggest that the relationship between imports and economic growth is weak (Harrison, 1996), or inexistent (Levine and Renelt, 1992). 13 This country case strategy has been followed by several authors, analyzing the economic policy implications for different developing countries. For example, Dawson (2006) for Bangladesh, Chadran and Munusamy (2009) for Malaysia, or Salehezadeh and Henneberry (2002) for Philippines, among others. 14 See Yao and Morgan (2008).. 5.
(7) intermediate and capital goods in China accounted for more than 80% of total imports, which gives an initial idea of the potential importance of this source of growth for the Chinese economy. To the best of our knowledge, there is no empirical evidence that analyses the importance of those imported goods as a source of long-run growth in the Chinese economy. Thus, the aim of this paper is twofold; first, it attempts to cover the aforementioned gap in the empirical literature on China’s economic growth, and second, it aims to add a further piece of evidence on the role played by capital goods imports in the design of economic development strategies. The structure of the paper is as follows. In section 2, we outline a basic model, which guides our empirical analysis and helps us in the interpretation of the results and to make the appropriate recommendations for economic policy. In section 3, we provide the empirical analysis with the data description and methodological issues, as well as the results. Conclusions and some policy implications are drawn in section 4.. Figure 1: Share of Imported Capital Goods over Total Imports (1957-2007) 100 90. 80 70. 60 50. 40. Average 1965-2007. Source: National Bureau of Statistics of China.. 2. Theoretical Considerations For the sake of brevity, in this section we outline the Schumpeterian theory of growth developed in Aghion and Howitt (1992, 1998), emphasizing not only on the role played by local innovation but also on the possibility that firms can benefit from technology transfer from. 6.
(8) abroad through imitation or adoption of foreign technologies.15 As we will see, this extension of growth models with quality-improving innovations provides us with a systematic analytical framework with which to analyse the role played by imports of capital and intermediate goods from technologically more advanced countries in the investment-based strategy of development pursued by China. Such models consider an economy with different industries. The output per worker at the industry level is given by a Cobb-Douglas production function, which depends on a productivity parameter, Ait, and a unique intermediate good used in this sector, Kit. It is easy to show that if all industries are ex ante identical, the aggregate per-worker output of this economy, Yt, depends on aggregate capital stock, Kt, and on the labour augmenting productivity factor, At, that is:. Yt At1 K t ,. 0 1. (1). where At is equal to the unweighted sum of the sector specific Ait’s. In this economy the long-run growth rate is given by the growth rate of At. Taking logs and differentiating from (1), the growth rate of Y, gt(Y), will be:. g t (Y ) (1 ) g t ( A) g t ( K ). (2). where gt(A) and gt(K) are the growth rates of productivity and capital stock respectively. To characterize the dynamics of capital stock we should take into account the consumption side of the economy. For the sake of simplicity, let us assume that the saving rate, s, is fixed and exogenously given,16 then the growth rate of the capital stock will be:. A sY g t ( K ) t s t Kt Kt . 1. (3). where, additionally, we are assuming that there is no depreciation.. 15. See, for example, section 3 of Aghion and Howitt (2005), Aghion and Howit (2006) and Acemoglu et al. (2006). In this section we follow the review of the Schumpeterian framework by Aghion and. Howitt (2006). 16. Alternatively, the consumption behaviour can be represented by a function of inter-temporal utility, but the assumption of an exogenously fixed saving rate is sufficient to perform a correct approximation of the data in the long run. For more details, see section 1.2 in Aghion and Howitt (1998).. 7.
(9) Thus, at each date t, given the initial stock of capital, the growth rate of capital depends on the rate of saving and on the labour-augmenting productivity level. Taking logs and differentiating (3) again, it is easy to see that in the steady state, the long-run stability of gt(K), would require that g t ( K ) g t ( A) . Then, making use of this condition together with (2), we can show that the equilibrium (steady-state) growth rate of this economy will be the same as the growth rate of productivity, that is:. g t (Y ) g t ( A). (4). Additionally, in Schumpeterian theory, the growth rate of At depends endogenously on the rate of innovation of the economy, which depends on the stock of past innovations and on the set of institutions and policies in use at each date t. In this type of models only the successful innovator firm, producing the most efficient version of each intermediate good (highest Ait), remains active and consequently produces and sells the intermediate good to the final industry. Each innovation improves the quality of the intermediate good, thus increasing the associate productivity from At to At+1 in the next period. There are two ways in which firms can improve the productivity of the economy: by bringing out new local innovations (leading-edge or indigenous innovations) or by imitating foreign technologies (implementation innovations). Both kinds of innovations can occur at different frequencies.17 A leading-edge local innovation improves the quality of the intermediate input on a scale of >1, that is, once the new intermediate good is put to use, the productivity parameter shifts from At to At. The magnitude of depends on the entrepreneur’s skills and the local institutional framework. Similarly to leading-edge innovations, the imitation of and adaptation to foreign technologies improves the productivity by catching up on the foreign productivity parameter At f At . Finally, if we consider that leading-edge innovation occurs with probability n and successful adoption of 17. The frequency depends on the appropriate mix of policies and institutions (property rights, tax laws, competition policy, government services, level and composition of human capital, macroeconomic conditions or credit market constraints). However, as we have already mentioned, the appropriate institutions that enhance productivity growth in each moment depend on the distance of the country to the frontier of knowledge. See Aghion and Howitt (2006) and Acemoglu et al. (2006).. 8.
(10) foreign technology with probability m, then the dynamics of the aggregate productivity will be expressed as:18. At 1 At n ( 1) At m ( At f At ). (5). The two terms on the right-hand side of (5) reflect the two dimensions that depend on the dynamics of productivity. The first approximates the innovation capacity of domestic entrepreneurs, while the latter reflects the ability to adopt or imitate foreign technology. The second term in equation (5) also indicates how relevant the technological gap is for the design of economics policies to growth in developing countries. It depends on the magnitude of the distance between the body of local knowledge and the state of world technology,. ( At f At ) , as well as the appropriate institutions and policies that stimulate investment and the adoption of foreign technologies (m). In the early stages of development, when the distance from the technological level of the country to the global frontier is high, this is probably the most important dimension of productivity improvements. Additionally, this fact implies a strong economic policy recommendation: openness to trade is not the same as export promotion, but should also include the design of policies and institutions that facilitate imports of intermediate and capital goods. However, as the countries approach the world technological frontier (. At At f ), the second term in expression (5) becomes zero, and the only source of growth turns out to be the domestic capacity to bring out leading-edge innovations, that is, economic growth relies more on domestic innovation policies.19 Finally, by rearranging (5) and making use of (4), the growth rate of the economy will be expressed as:. At f g t (Y ) n ( 1) m 1 At . (6). 18. Expression (5) is the same as the one reported by Aghion and Howitt (2006), p. 275. This suggests that during the growth process both strategies – indigenous and foreign innovation – should be complementary. See Fu et al. (2011). 19. 9.
(11) Expression (6) shows that the growth rate of the economy depends on domestic conditions, as well as on the capacity to catch up on foreign technology, which in turn depends on the domestic absorptive capacity and on the ratio between the level of domestic and foreign productivity. And since, in this kind of models, the only way to increase the level of productivity is to put new intermediate and capital goods to use, the magnitude of this term is related to the composition of investment. Thus, like Lee (1995), in the empirical analysis we approach this effect by considering the ratio between imported and domestically produced intermediate and capital goods. But, unlike Lee, where developed and developing countries grow at the same rate in the long run and the growth rate of income in developing countries could be higher only in the transitional dynamics, in our analysis we stress that the composition of investment could also improve the rate of economic growth in the long run. And what is more important, in Lee’s paper, the higher growth rate in the transitional dynamic path in the developing country is due to the effect of the ratio of imported to domestically produced intermediate and capital goods on the growth rate of capital stock (improving the efficiency of capital accumulation). Alternatively, in our analysis, we stress the role of foreign intermediate and capital goods as a source of long-run growth through other channels. The first of these channels is by improving the efficiency of domestic production processes due to technological progress embodied in these imported goods and the second is by accelerating technological catching-up through the domestic producers’ processes of learning from foreign suppliers. 3. The Empirical model 3.1 Data As stated earlier, our main goal is to analyse the role played by the ratio of imported to domestically-produced capital goods in income growth. To do this, we will focus on a particular study case, the Chinese experience in recent decades. However, in order to find any robust effect of this ratio on the growth rate of the Chinese economy, it is necessary to control the estimates with additional policy variables, as suggested by Levine and Renelt (1992). Thus, in accordance with most of the empirical literature on growth, our data set includes the following variables: the. 10.
(12) growth rate of per capita income, g(YPC); the growth rate of the population, g(N); the ratio of investment to GDP, (I/Y); the ratio of total imports to GDP, (M/Y); the ratio of government expenditure to GDP, (G/Y); the investment in human capital, (ΔHC), measured as the increases in the stock of human capital, approximated by per capita years of schooling; and the ratio of foreign capital to domestic capital goods, (FC/DC).20 All variables are in constant prices except those that are ratios.21 The main data source was the National Bureau of Statistics of China (NBS). We used annual data covering the period 1965-2007. The turbulent period of the 1950s and the economic consequences of the Great Leap Forward have therefore been deliberately avoided, since they produce abnormal values and make it difficult to perform an empirical analysis.22 Our key variable, FC/DC, was created following Hsu’s (1989) and Lee’s (1995) proposals. The starting point was to obtain the imported capital goods (FC) from Hsu (1989). Then, the data set built by this author was extended to cover the entire period of our analysis. Finally, the value of domestic capital goods (DC) was calculated by subtracting the value of imported capital goods (FC) from total investment, as in Lee (1995). The stock of human capital, in contrast, was taken from Wang and Yao (2003) and it was updated until 2007 with figures from NBS.23 Finally, as we are examining the Chinese economy, we cannot ignore the scepticism that exists about the quality of the Chinese data. Yet, the NBS has made continuous efforts to revise the data and to provide more accurate information in compliance with the international standards on macroeconomic aggregates.24 This is especially true for the revision that took place in 2005, which is the compilation that we use in the present work. This data set is more accurate than those from previous publications and the data have been revised for the whole period. In. 20. The simultaneous inclusion of (M/Y) and (FC/DC) will allows us to disentangle whether the effect of trade openness on growth is associated with increased trading volume (exports or imports) or if the positive effect is due to the particular composition of imports and investment. 21 We used the GDP deflator, 1952 base year. 22 See Chow (1993). 23 See Wang and Yao (2003) for the details in the construction of human capital stock. 24 See Chow (2006).. 11.
(13) addition, it is widely agreed that even though the data present some inaccuracies on certain levels, the long-run trends are approximately correct (Chow, 2004). 3.2 Specification issues and the VAR model approach One of the main concerns with the aforementioned variables in the empirical analysis is the subject of potentially endogenous regressors. We deal with this issue by applying the VAR model proposed by Johansen (1988, 1995) and Juselius (2007). This methodology takes into account the potential interdependence between the explanatory variables and economic growth, the main variables being considered endogenous at the outset in a joint estimation framework. This procedure prevents any spurious results coming from the endogeneity problem. Moreover, in the later stages of this method it makes it possible to distinguish between which variables are endogenous and which are weakly exogenous by carrying out weak exogeneity tests. Thus, the researcher does not impose any restrictions on the model and hence allows “the data to speak freely” (Hoover, Johansen and Juselius, 2008). Related to this, an additional advantage of this approach is that it is possible to test the direction of the causality of the variables in the model. Moreover, using cointegration techniques allow us to avoid any problems with the nonstationarity of the variables and to distinguish the long- and short-run effects. Notwithstanding these advantages, however, it does also raise some problems, especially those related with the trade-off between the power of the tests and the length of time series and the number of variables included.25 Thus, in our empirical analysis we use the following specification of the unrestricted VAR model:. X 'Z X t t D s t 1. k 1. i 1. k 1. i X t i . i 0. i Z t i . k 1. D i. i 0. st i. Dt t (7). t NIID (0, ) t 1....T 25. With this methodology, the power of the test tends to be greater as the number of included variables becomes lower and the length of the time series considered increases in size. This leads us to be quite restrictive as regards the number of variables considered in the model.. 12.
(14) where Xt is a vector which contains the endogenous variables of the model, Zt includes variables considered a priori as being weakly exogenous, t is the linear trend and Ds is a vector with shift dummies taking the form of (0,0,1,1,0) restricted to the cointegration space. α shows the direction and speed of adjustment to equilibrium, while are the coefficients of the cointegrating vectors. For each of the elements described above, except for the deterministic trend, there is a dynamic representation in the model. In addition, we include a constant term (µ) and additional permanent dummies, γDt, taking the form of (0,0,1,0,0), to ensure the stability of long-term relationships. Both the constant term and the permanent dummies are unrestricted to the cointegration space. Finally, we assumed that the initial values X-k +1, ... X0, are fixed. The more than likely non-stationarity of the variables needs to be tested with the unit root tests, since combining them produces a stationary relation if they are cointegrated. Furthermore, the reliability of the estimations is guaranteed by performing a set of diagnostic tests on the residuals and the specification of the model is determined by the weak exogeneity test. Finally, the number of long-run cointegrating vectors is indicated by the rank of the long-run matrix in equation 7. Results of these tests are reported in Tables 1-3. Although the ADF and Phillips-Perron tests are the most commonly used methods to test for the presence of unit roots, many researchers remain sceptical about the results from these standard unit root tests. It is well known that ADF-type tests have lower power and might provide misleading results and that Perron tests may undergo severe size distortions when applied to unit root processes subject to structural changes.26 Thus, in this paper, we use the unit root test with two (endogenously determined) structural breaks proposed by Lee and Strazicich (2003) that have a higher power to detect the unit roots than previous tests.27. 26. See Perron and Ng, 1996; Lee and Strazicich, 2001. For further details, see Lee and Strazicich (2003). For a detailed discussion of the unit root tests and their link with growth models, see Herrerias and Orts (2011). The stationarity test is implemented in CATS in RATS, which is specific software for performing the VAR model. 27. 13.
(15) Table 1A: Lee and Strazicich unit root tests (two structural breaks) Levels. 2 breaks Statistic Differences 2 breaks Statistic 1977 1979 -5.77 -10.85* g(YPC) Δg(YPC) 2002 2004 1987 1988 I/Y -4.91 -5.94* Δ( I/Y) 2004 1999 1984 1993 M/Y -5.77 -6.94* Δ( M/Y) 2001 2000 1978 1990 G/Y -5.09 -5.86** Δ(G/Y) 1997 2001 1985 1980 FC/DC -5.61 -11.3* Δ(FC/DC) 1997 1990 1983 1986 HC -5.23 -6.18 ΔHC 1998 1999 Note: *indicates the rejection of the null hypothesis at the 1% level of significance, ** at 5%. See Lee and Strazicich (2003) for the critical values.. Table 1B: Stationarity Test R DGF g(YPC) 22.181 1 7 [0.002] 2 6 16.855 [0.010] 3 5 11.87 [0.037] 4 4 13.747 [0.008] 5 3 7.483 [0.058]. g(N) 71.144 [0.000] 42.272 [0.000] 27.174 [0.000] 9.53 [0.049] 2.727 [0.436]. G/Y 68.519 [0.000] 39.294 [0.000] 31.046 [0.000] 13.223 [0.010] 3.094 [0.377]. FC/DC 75.278 [0.000] 46.299 [0.000] 29.623 [0.000] 17.941 [0.001] 5.441 [0.142]. M/Y 71.544 [0.000] 42.315 [0.000] 28.625 [0.000] 15.034 [0.005] 8.353 [0.039]. I/Y 60.823 [0.000] 32.577 [0.000] 22.602 [0.000] 7.782 [0.100] 2.548 [0.467]. Note: p-values in brackets. The statistic denotes the rejection of the null hypothesis of stationarity. From Table 1A we can observe that the growth rate of per capita income is non-stationary and has a unit root.28 The remaining variables, except the stock of human capital, are integrated of order one in levels. Finally, as the stock of human capital is integrated of order two, we transformed this variable into first differences in order to apply the VAR model. These results are corroborated with the information reported in Table 1B, where for the number of long-run relations selected, in accordance with the rank test, all our variables are non-stationary. 29. 28. This result of the non-stationarity of the growth rate of per capita income is more consistent with the endogenous models of growth than with the exogenous growth models. As stated by Jones (1995), one of the main arguments against endogenous growth is based on the stationarity of growth rates. 29 Residual analysis are available upon request from the authors.. 14.
(16) Once we have the well-specified model, we perform the weak exogeneity test and the rank test on the long-run matrix. We find that in this model the only endogenous variables are the growth rate of per capita income and the growth rate of population, the remaining variables being weakly exogenous (see Table 2).30 The weak exogeneity of a particular variable implies that it has influenced the long-run stochastic path of other variables in the system, while at the same time remaining uninfluenced by them. This type of test helps us to answer questions of enormous importance in economic policy analysis, and hence to assist us in elucidating which variable could be used as a policy instrument or is really endogenous to the system. In essence, the answer depends on the direction of the causality among the variables of interest. Table 2: Test of long-run weak exogeneity31 R DGF g(YPC) 29.227 1 1 [0.000] 2 2 49.406 [0.000] 3 3 65.728 [0.000] 4 4 69.247 [0.000] 5 5 74.615 [0.000]. g(N) 3.628 [0.057] 5.42 [0.067] 8.926 [0.030] 12.646 [0.013] 12.646 [0.027]. G/Y 0.31 [0.578] 0.615 [0.735] 12.533 [0.006] 12.534 [0.014] 16.849 [0.005]. FC/DC 0.68 [0.410] 1.388 [0.500] 9.727 [0.021] 19.792 [0.001] 25.564 [0.000]. M/Y 1.416 [0.234] 15.242 [0.000] 20.162 [0.000] 20.781 [0.000] 25.596 [0.000]. I/Y 2.435 [0.119] 18.719 [0.000] 32.378 [0.000] 32.378 [0.000] 39.388 [0.000]. Table 3: The rank test and root of companion matrix p-r r 2 0 1 1. Eig.Value Trace 0.867 110.799 0.396 22.179. Trace* 105.136 21.866. P-Value 0.000 0.301. P-Value* 0.000 0.318. Finally, we can test the number of long-run relationships (r) and common trends (p – r) by the LR test. The results are reported in Table 3. As you can see in this table,32 only a cointegrating relationship exists in this model.. 30. Weak exogeneity implies that the variable examined has a zero row in α in equation (1). Although the p-value of the growth rate of the population is slightly over 0.05, we have allowed it to be endogenous. In fact, we can check it in the dynamics of the model, where its coefficient of ecm is significant, thus implying that this variable is endogenous in this model. 32 Table 3 shows that when you examine the null hypothesis of r =1 it is not possible to reject it due to the fact that the p-value is 0.3. 31. 15.
(17) 3.3 Empirical results Non-stationary data raises two different identification problems, namely: identification of the long-run structure (i.e. the cointegration relations) and identification of the short-run structure (i.e. the equations of the system).33 The identification of the long-run structure requires the imposition of restrictions on the cointegrating relation that we found. In our case, the general specification for the normalized cointegrating relation found through the application of the LR test is as follows:34 X Z t 1. ' / 11 . g t (Y PC ) 12 / 11 g t ( N ) t 13 / 11 ( I / Y ) t 14 / 11HCt . (8). 15 / 11 ( FC / DC) t 16 / 11 ( M / Y ) t 17 / 11 (G / Y ) t. where 11 is the coefficient of gt(YPC) in the non-normalized cointegrated vector found. Now, we have the theoretical and the empirical framework for testing the predictions we are interested in. For instance, we can test whether capital accumulation (physical and human capital) has a long-run effect on the growth rate of the Chinese economy. This hypothesis is consistent with the AK-models developed by Romer (1986), Lucas (1988) and Rebelo (1991), as well as the subsequent generation of endogenous growth models developed by Romer (1990), Grossman and Helpman (1991b) or Aghion and Howitt (1992). These models suggested that investment, defined in a broad sense, has permanent effects on the growth rate of the economy. This hypothesis can be tested imposing the condition that 13/11 = 14/11 = 0 in (8). However, this hypothesis was rejected by the data with a p-value of 0.033. Hence, the first important conclusion is that policies aimed to stimulate capital accumulation (understood in a broad sense, that is, including physical and human capital) matters for long-run economic growth. The second hypothesis that we can formulate concerns whether Chinese growth is higher using more 33. For all aspects regarding the identification, see Johansen and Juselius (1994). For the sake of simplicity, in (8) we have omitted the deterministic components of the long-run relationship. In this specification we have included two shift dummies in 1967 and 1985, coinciding on the one hand with the Cultural Revolution and the economic consequences of the failure of Great Leap Forward, and on the other hand with the initial reform of the non-state sector. Besides, we included two permanent dummies in 1976 and 1989, coinciding with the end of the Cultural Revolution and with the economic slowdown produced by the economic and political difficulties between 1989 and 1990. 34. 16.
(18) foreign capital goods relative to domestic capital goods. Analogously, it implies that 15/11 = 0. The results indicate that the use of higher foreign capital goods relative to domestic capital goods has influenced positively the long-run growth in the Chinese economy, since this hypothesis is rejected with a p-value of 0.000. However, our model also includes the ratio of total imports to GDP. As Lee (1995) argued, if foreign trade affects growth through the importation of capital goods, the usual trade indicators such as exports to GDP or imports to GDP are not accurate measures for investigating the causal relation between trade and growth. This idea can be checked against by testing the hypothesis that 16/11 = 0. The results indicate that the main channel for encouraging economic growth in China has been the importation of foreign capital goods. This is because we cannot reject that the coefficient of imports relative to GDP is different from zero (p-value of 0.491). This result is quite reasonable because China’s economy, as other developing countries, does not have had in past decades a comparative advantage in the production of technologically advanced capital goods. Therefore, through international trade it can import those goods so that the production process can benefit from the lower relative price and hence be an important mechanism to stimulate productivity and growth. By eliminating the non-significant coefficients of the long-run relationship in this model, we can obtain the economic relation that was identified (t-statistic in brackets), that is: g (YPC ) 5.02 g ( N ) 0.54( I / Y ) 0.09HC 1.01( FC / DC) 0.418(G / Y ) 0.08Ds 67 [4.18]. [4.70]. [4.08]. [5.97]. [-5.01]. [-7.06]. (9) In the above equation, we can see that all coefficients show the expected sign and are significant.35 Our results suggest that the direction of the causality is unidirectional and runs from the ratio of foreign to domestic capital, population growth, physical and human capital accumulation and government expenditure to per capita GDP growth rate. This implies that. 35. The coefficient of adjustment in the long-run matrix towards equilibrium is negative and takes a value of -1.35 with a t-statistic of -15.62, thereby indicating that this economic relation is stationary. Moreover, we performed a set of tests to check the stability of the parameters and the results indicated that the coefficients were reasonably stable. The restrictions imposed were accepted by the data with a p-value of 0.483. The set of stability tests are available from the authors upon request.. 17.
(19) China’s growth is caused by the aforementioned factors and not by the possible reverse causation.36 Additionally, we found that the failure of the Great Leap Forward and the Cultural Revolution, which may be captured by the shift dummy in 1967 negatively influence the growth rate of income in China. These results are consistent with the hypothesis that China’s growth experience over the analysed period has followed an "investment-based strategy", in which the process of catching up with the world technological frontier has played a significant role. Thus, in line with the arguments proposed by Rodrik (1995) to explain the experience of the East Asian countries in the 1960s, investment and imports appear to have played a central role in the rapid growth undergone by the Chinese economy in the last few decades. However, in agreement with the Schumpeterian theory of growth outlined in section 2 – especially the versions developed by Acemoglou et al. (2006) and Aghion and Howitt (2006) – our results also indicate that investment composition has played a noteworthy role. In fact, besides the role played by capital accumulation, it can be seen that an increase in the proportion of imported capital goods over those produced domestically is accompanied by a higher rate of growth in China. This result is consistent with the empirical evidence that foreign capital, which usually has embodied technological progress from advanced countries, has been a central source of technological progress in developing countries. Finally, our results also indicate that the most important channel through which openness to trade has enhanced growth is probably having access to technologically advanced capital goods from more developed countries and not the increase in trade volume. On the other hand, as already stated, the identification of the short-run structure is greatly facilitated by keeping the properly identified cointegrating relations fixed at their estimated values. Similar to the previous process, the short-run structure is identified by imposing a restriction equal to zero on the non-significant coefficients until the most irreducible form is. 36. For imports this reverse causation could be relevant, since it has been detected a positive relationship between the increase in GDP per capita and the income elasticity of imports. See eg Lo et al (2007).. 18.
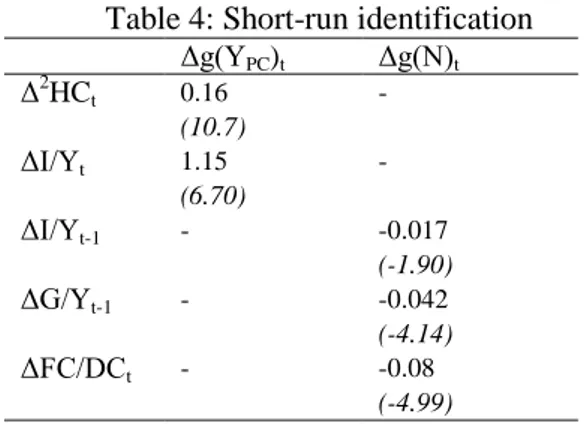
(20) reached. The results are reported in Table 4, where the restrictions where accepted by the data with a p-value of 0.0782. Table 4: Short-run identification Δg(YPC)t. Δg(N)t -. ΔI/Yt-1. 0.16 (10.7) 1.15 (6.70) -. ΔG/Yt-1. -. ΔFC/DCt. -. ECMt-1. -3.59 (-5.40). Δ2HCt ΔI/Yt. -0.017 (-1.90) -0.042 (-4.14) -0.08 (-4.99) 0.21 (5.64). Not surprisingly, the short-run effects are scarce in this model because our key determinants are more consistent with long-run effects. The most important feature of the dynamics of the model estimated is that reported by the parameters of the error correction mechanism (ECM), that is, the long-run relation expressed as a deviation away from the steady state. The table above shows that the acceleration of the growth rate is error correcting with the cointegrating relation specified in (9), due to the negative coefficient of the ECM. On the other hand, the coefficient of the ECM in the other equation, Δg(N), implies that improvements in the growth rate of income in the Chinese economy stimulate the rate at which China's population grows. An interesting result is that human capital and investment influence the rate of growth of income in both the short and the long run in China. 4. Conclusions and Policy Implications The focal point of this paper is to analyse the role played by capital goods imports in the long-run growth of developing countries and highlight the economic policies arising thereof. To do this we focus in a case study, the Chinese economy from 1965 to 2007, using as a methodological tool the cointegrated VAR model. Thus, we expect to add a further piece of empirical evidence on the role played by capital goods imports in the design of economic development strategies.. 19.
(21) Sustained long run growth of countries is only possible if the development strategy adopted is able to combine capital accumulation with efficiency and productivity gains. For developing countries, with relatively low investment in R&D and inefficient innovation process, to adopt policies aimed at increasing openness to trade, and more specifically the liberalization of imports of intermediate and capital goods, can be a suitable strategy to improve both the efficiency of capital accumulation, and the technological progress incorporate to productive processes. No wonder that even countries with a strong export orientation have to rely on imported technology as a mechanism for developing the local technological capabilities in order to increase productivity and become competitive in the international markets. In other words, openness to trade is not the same as export promotion, but should also include the design of policies and institutions that facilitate imports of intermediate and capital goods. This seems to be the case of China since the mid-60s. Thus, the main finding was that the rate of capital accumulation and the relative proportion of foreign over domestic capital goods used in the local production processes were directly related to the Chinese per capita GDP growth rate, over the period under consideration. These results are consistent with the hypothesis that the link between trade openness and long-run growth worked mainly through imports, and especially through the importation of capital goods. These imports allow for two types of benefits: first, they improve the efficiency of capital accumulation and, second, they become a source of technological catching-up. The first effect is the result of exploiting the comparative advantage through the importation of cheaper capital goods from more developed countries. The second, however, is due to technological progress embodied in the imported capital goods, which allow foreign technology to be incorporated into the productive activity, thus increasing the efficiency of domestic production and innovation processes. In short, the investment effort, together with the efficiency of capital accumulation and the composition of investment, has been key aspects in accounting for China’s growth in the last four decades. Furthermore, this evidence is in agreement with the point of view stressed by authors such as Acemoglu et al. (2006) or Aghion and Howitt (2006), who suggest that in the early stages of. 20.
(22) growth, government intervention to encourage an “investment-based strategy” (which emphasizes large investment efforts and the adoption of foreign technology) might be appropriate to successfully enhance productivity and output growth. And this is true even if this strategy has to be played at the expenses of some non-competitive arrangements or market rigidities. However, the same theoretical framework that allows us to articulate the above results also tells us that this strategy, which seems suitable in the early stages of development, could be responsible for slowing down growth when the economy becomes more advanced and gradually approaches the world technology frontier. Thus, as the economy reaches higher levels of development, it needs gradually replace the aforementioned anticompetitive practices by a more competitive environment which encourages leading-edge or local innovation. This change from an investment-based to an innovation-based strategy is essential to sustain growth and convergence as the economy achieves higher levels of development and approaches the technological frontier.37 Nevertheless, there is an inherent difficulty in switching to the innovation-based strategy. Groups that have benefited from the investment-based policy, and have gained economic power in this period, will strongly oppose a change in the growth strategy that harms their economic power, thereby hindering the necessary switch. Finally, although these results apparently disagree with the export-led growth literature (and to some extent this is true), export promotion could have been a central piece of the openness to trade policy, thus preventing the external constraint of the economy to stop this development strategy. However, our claim is that the main beneficial source of openness to growth came from imports and specifically from their capacity to improve the composition of investment through imported technology. But this is consistent with the observed strong Chinese export orientation, if we think that the export competitiveness of China could be supported, at least. 37. With the development, technological improvements from abroad become less relevant, while internal imbalances are exacerbated: possible overinvestment and limited role for consumption on economic development (see Qin et al, 2006). This change, from an investment-based to an innovation-based strategy, must be gradual and occur at a different pace in each sector, depending of the magnitude of the technological gap in each case. In this sense, recent evidence seems to confirm that this is the case of China (see Fu and Gong, 2011).. 21.
(23) partially, by imported technology as a source from which to develop the local technological capabilities. So, the main policy recommendation that emerges from our results for openness policies is not considered inadequate the export promotion policy, but not complement it with the design of policies and institutions that facilitate imports of intermediate and capital goods.. References Acemoglu, D., Aghion, Ph., and Zilibotti, F. (2006) Distance to Frontier, Selection, and Economic Growth. Journal of the European Economic Association. 4: 37-74. Aghion, Ph., and Howitt, P. (1992) A Model of Growth Through Creative Destruction. Econometrica, 60: 323-351. Aghion, Ph., and Howitt, P. (1998) Endogenous Growth Theory, MIT Press, Cambridge, MA. Aghion, Ph., and Howitt, P. (2005) Growth with Quality-Improving Innovations: An Integrated Framework. In Aghion, Ph. and Durlauf, S.N. (eds.) Handbook of Economic Growth. North-Holland, Amsterdam. Vol 1A, Chapter 2: 67-110. Aghion, Ph., and Howitt, P. (2006) Appropriate Growth Policy: A Unifying Framework. Journal of the European Economic Association. 2: 269-314. Busse, M. and Groizard, J.L. (2008) Technology Trade in Economic Development. World Economy. 31 (4): 569-592. Chadran, V.G.R., and Munusamy, I.A. (2009) Trade Openness and Manufacturing Growth in Malaysia. Journal of Policy Modeling, 31: 637-647. Chow, G. (1993) Capital Formation and Economic Growth in China. The Quarterly Journal of Economics 108: 809-842. Chow, G. (2004) Knowing China. Singapore: World Scientific Publishing Co. Chow, G. (2006) Are Chinese Statistics Reliable? Cesifo Economic Studies 52: 396-414. Coe, D.T, Helpman, E. and Hoffmaister, A.W. (1997) North-South R&D Spillovers. The Economic Journal 107: 134- 149. Dawson, P.J. (2006) The Export-Income Relationship and Trade Liberalisation in Bangladesh. Journal of Policy Modeling, 28: 889-896. De Long, J.B. and Summers, L.H. (1991) Equipment Investment and Economic Growth. The Quarterly Journal of Economics 106: 445-502 Fu, X., Pietrobelli, C. and Soete, L. (2011) The Role of Foreign Technology and Indigenous Innovation in the Emerging Economies: Technological Change and Catching-up. World development. 39: 1204-1212. Fu, X. and Gong, Y. (2011) Indigenous and Foreign Innovation Efforts and Drivers of Technological Upgrading: Evidence from China. World development. 39: 1213-1225. Eaton, J. and Kortum, S. (1996) Trade in Ideas: Patenting and Productivity in the OECD, Journal of International Economics 40: 251–78 Greenaway, D. and Kneller, R. (2007) Firm Heterogeneity, Exporting and Foreign Direct Investment, Economic Journal 117: 134-161 Grossman, G.M. and Helpman, E. (1991,a) Quality Ladders in the Theory of Growth. The Review of Economic Studies. 58: 43-61. Grossman, G.M. and Helpman, E. (1991,b) Innovation and Growth in the Global Economy Cambridge, Massachusetts, MIT Press.. 22.
(24) Harrison, A. (1996) Openness and growth: A time series, cross-country analysis for developing countries. Journal of Development Economics, 48: 419-447. Herrerias, MJ. and Orts, V. (2010) Equipment Investment, Output and Productivity in China. Empirical Economics 42: 181-207 Herrerias, M.J. and Orts, V. (2011) The Driving Forces behind China’s Growth. Economics of Transition 19: 79-124. Hoover, K., Johansen, S. and Juselius, K. (2008) Allowing the Data to Speak Freely: The Macroeconometrics of the Cointegrated Vector Autoregression. American Economic Review 98: 251-255 Hsu, J. (1989) China’s Foreign Trade Reforms. Impact on Growth and Stability. Cambridge University Press. Johansen, S. (1988) Statistical Analysis of Cointegration Vectors, Journal of Economic Dynamics and Control 12: 231-254 Johansen, S. and Juselius, K. (1994) Identification of the Long-run and the Short-run structure. An application to the ISLM model, Journal of Econometrics 63: 7-36 Johansen, S. 1995. Likelihood-Based Inference in Cointegrated Vector Auto-regressive Models. Advance Texts in Econometrics. Oxford University Press. Jones, C. I. (1995) Time Series Tests of Endogenous Growth Models, Quarterly Journal of Economics 110: 495-525 Juselius, K. (2007) The Cointegrated VAR Model: Econometric methodology and macroeconomics applications. Oxford University Press. Keller, W. (2004) International Technology Diffusion. Journal of Economic Literature. 42: 752-782. Lawrence, R.Z, and Weinstein, D.E. (2001) Trade and Growth: Import-Led or Export-Led: Evidence from Japan and Korea, in Stiglitz, J.E. and Yusuf, S. (eds.) Rethinking the East Asia Miracle, Oxford University Press. Lee, J. and Strazicich, M. (2001) Break Point Estimation and Spurious Rejections with Endogenous Unit Root Tests’. Oxford Bulletin of Economics and Statistics 63: 535–558. Lee, J. and Strazicich, M. (2003) Minimum Lagrange Multiplier Unit Root Test with Two Structural Breaks, The Review of Economics and Statistics 85: 1082-1089 Lee, J.W. (1995) Capital Goods Imports and Long-run Growth. Journal of Development Economics 48: 91-110. Levine, R. and Renelt, D. (1992). A Sensitive Analysis of Cross-country Growth Regressions, American Economic Review 82: 942-963. Lo, M., Sawyer, W.Ch. and Sprinkle, R.L. (2007) The Link betwen Economic Development and the Income Elasticity of Import Demand. Journal of Policy Modeling, 29: 133-140. Lucas, R. E. JR. (1988) On the Mechanics of Economic Development, Journal of Monetary Economics 22: 3-42. Mazumdar, J. (2001) Imported Machinery and Growth in LDCs. Journal of Development Economics 65: 209-224. Mody, A. and Yilmaz, K. (2002) Imported Machinery for Export Competitiveness. The World Bank Economic Review, 16: 23-48. Perron, P. and Ng, S. (1996) Useful Modifications to Unit Root Tests with Dependent Errors and their Local Asymptotic Properties. Review of Economic Studies 63 (3): 435–465. Qin, D., Cagas, M.A., Quising, P., and He, X-H. (2006) How much does Investment Drive Economic Growth in China? Journal of Policy Modeling, 28: 751-774.. 23.
(25) Rebelo, S. (1991) Long-Run Policy Analysis and Long-Run Growth, Journal of Political Economy 99: 500-521. Rivera-Batiz, L.A. and Romer, P.M. (1991) Economic Integration and Endogenous Growth. Quarterly Journal of Economics 106: 531-556. Rodriguez, F. and Rodrik, D. (2001) Trade Policy and Economic Growth: A Sceptic’s Guide to the Cross-national Evidence in B.S. Bernake and K. Rogoff (eds.) NBER Macroeconomics Annual 2000, The MIT press Cambridge. Rodrik, D. (1995) Getting Interventions Right: How South Korea and Taiwan Grew Rich. Economic Policy 10: 53-107. Rodrik, D. (1999) The New Global Economy and Developing Countries: Making Openness Work. Overseas Development Council, Policy Essay No.24, Washington D.C. Romer, P. (1986) Increasing Returns and Long-Run Growth, The Journal of Economics Perspectives 8: 3-22 Romer, P. (1990) Human Capital and Growth: Theory and Evidence, Carnegie-Rochester Conference Series on Public Policy 32: 251-286. Salehezadeh, Z., and Henneberry, S.R. (2002) The Economic Impact of Trade Liberalization and Factor Mobility: The case of the Philippines. Journal of Policy Modeling, 24: 483-489. Santos-Paulino, A.U. (2005) Trade Liberalization and Economic Performance: Theory and Evidence for Developing Countries. World Economy 28: 783-821. Shi, Y. (1998) Chinese firms and Technology in the Reform Era. Routledge Studies in the Growth Economies of Asia. Thangavelu, S.M. and Rajaguru, G. (2004) Is there an Export or Import-led Productivity Growth in Rapidly Developing Asian Countries? A Multivariate VAR Analysis, Applied Economics 36: 1083-1093. Wang, Y. and Yao, Y. (2003) Sources of China’s Economic Growth 1952-1999: Incorporating Human Capital Accumulation, China Economic Review 14: 32-52. World Bank (1993) The East Asian Miracle, a World Bank Policy Research Report, Oxford University Press. Yao, S. and Morgan, S. (2008) On the New Economic Policies Promoted by the 17th CCP Congress in China. World Economy. 31: 1129-1153.. 24.
(26)
Figure

Documento similar
The photometry of the 236 238 objects detected in the reference images was grouped into the reference catalog (Table 3) 5 , which contains the object identifier, the right
Different proxies for growth options ratio to the firm’s total value (GOR) (either MBAR (the market to book assets ratio), Q (Tobin’s Q), or RDsales (the ratio of R&D expenses
However, growth is not always good for a company, and firms should therefore always make sure that the real growth ratio is close to the sustainable growth ratio; otherwise, a
From the ILO EPlex indicators we have obtained, we cannot clearly see an inverse relationship between the employment protection and the
This expectation is based on the relationship between forecast errors of quarterly GDP growth and subsequent revisions to GDP-growth forecasts in the Funcas survey shown in Figure
This expectation is based on the relationship between forecast errors of quarterly GDP growth and subsequent revisions to GDP-growth forecasts in the Funcas survey shown in Figure
In addition, precise distance determinations to Local Group galaxies enable the calibration of cosmological distance determination methods, such as supernovae,
Government policy varies between nations and this guidance sets out the need for balanced decision-making about ways of working, and the ongoing safety considerations
