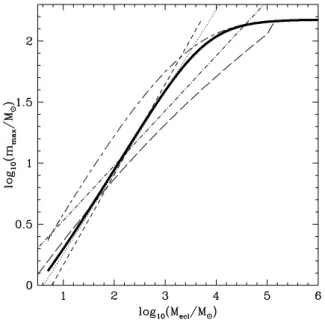
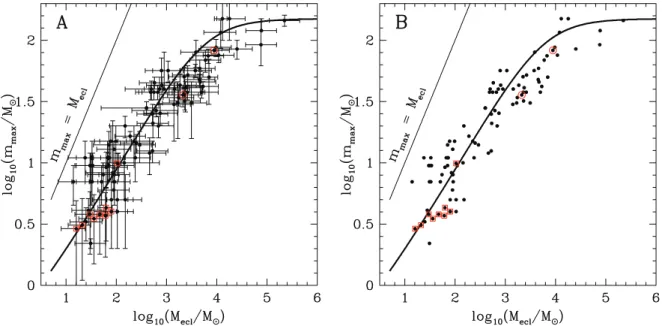
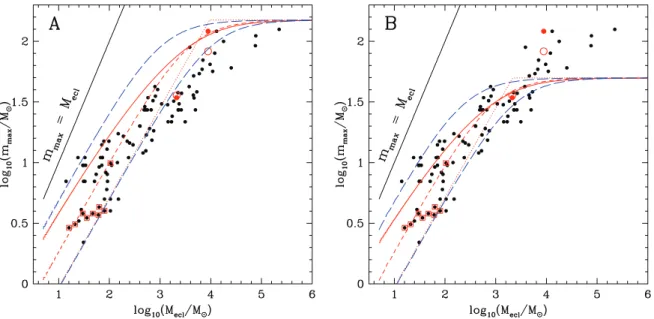
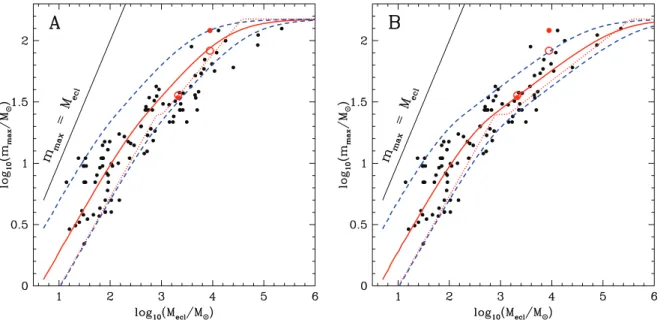
The relation between the most massive star and its parental star cluster mass
Texto completo
Figure


Documento similar
Best fit values of the relation between total mass and gas, star and baryon fraction of MUSIC-2 halos for all objects, massive clusters and groups of galaxies.. Best fit values of the
Even the most metal-deficient galaxies in the local universe formed from matter that was already preenriched by a previous star formation episode, and the determination of the
We aim at identifying the least massive population of the solar metallicity, young (120 Myr), nearby (133.5 pc) Pleiades star cluster with the ultimate goal of understanding
• Stellar kinematic signatures of intermediate mass black holes in nuclear stellar clusters (with T.. Compare star formation history deduced from fit to absorption line spectra
The present-day distance of a satellite from their parent has some bearing on the amount of star formation prior to the end of reionization, driven in part by the fact that more
A comparison between the radio and X-ray populations in Orion shows that the radio detections so far have been strongly biased to the brighter X-ray stars. This supports the
In summary, from the cluster analysis of individual bright knots and from the integrated photometry of the whole complex, there are clear indications that there is a complex
In the follow- ing analysis of the emission lines and their spatial extension, we focus on the highest resolution EFOSC2 data, observed in August 2008 with Grism 20 in an east-west
