TítuloIndexed left atrial size predicts all cause and cardiovascular mortality in patients undergoing aortic valve surgery
24
0
0
Texto completo
(2) Different left atrial (LA) measurements have been proposed as predictors of long-term outcome in the general population,1,2 but also in specific subgroups of patients, such as those with left ventricular dysfunction,3 myocardial infaction,4 or hyperthophic cardiomyodiopathy.5 However, little information is available in the literature on the relationship between indexed LA size and outcome among patients who are referred for aortic valve surgery (AVS). The enlargement of the left atrium has been identified as a marker of chronically increased left ventricle (LV) filling pressure and LV diastolic dysfunction.6 Increased nonindexed LA diameter has been described as a marker of diastolic dysfunction among patients with asymptomatic aortic stenosis, 7 as well as a factor of poor outcome in patients undergoing AVS. 8 However, little is known about the longterm prognostic value of indexed LA diameter in patients with chronic LV pressure or volume overload due to an aortic valve condition. The aim of this study is to determine the association between indexed LA diameter with all-cause mortality and cardiovascular mortality, as well as with stroke and the combined event cardiovascular death or stroke in a large cohort of patients with aortic valve diseases who underwent AVS.. MATERIALS AND METHODS Between January 2008 and March 2016, 2460 adult patients (age >18 years) underwent AVS at Complejo Hospitalario Universitario de A Coruña. For each patient, the first comprehensive transthoracic echocardiogram was selected. We excluded 400 patients for whom the LA indexed size was not reported and 49 patients for whom no follow-up data were available. Thus, 2011 patients were finally included. The study was approved by the local research ethics committee (Comité Etico de Investigación Clínica de Galicia) (Study Identification Number 2016/259). Clinical Data Demographic, clinical, and echocardiographic data were entered in our surgical database. The study was completed using linked clinical and administrative databases, as well as electronic medical records through the Department of Information Technology of Complejo Hospitalario Universitario de A Coruña. Data sources were linked using unique identifiers. A history of atrial fibrillation was defined as atrial fibrillation recorded at the time of the admission for AVS or any previously known episode of atrial fibrillation. Creatinine clearance was calculated using the Cockcroft–Gault formula. Extracardiac arteriopathy was defined as 1 or more of the following factors: claudication, carotid occlusion or more than 50% stenosis, amputation for arterial disease, and previous or planned intervention on the abdominal aorta, limb arteries, or carotid arteries. Chronic lung disease was defined as long-term use of bronchodilators or steroids for lung disease. Active endocarditis was considered when the patient was still receiving antibiotic treatment for endocarditis at the time of surgery. Postoperative standard anticoagulation with vitamin K antagonists (VKAs) and heparin was initiated after surgery in all patients receiving a mechanical prosthesis, patients with chronic or new-onset atrial fibrillation or atrial flutter, or patients with other less common indications to the appropriate target international normalized ratio, as recommended by current practice guidelines..
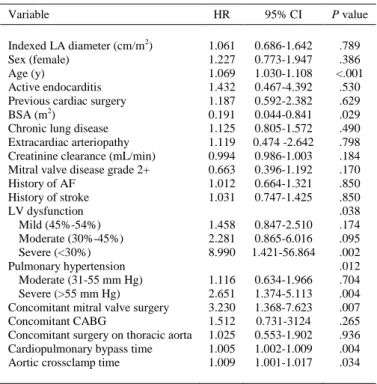
(3) Echocardiographic Data Echocardiograms were performed in the left lateral decubitus position using standard imaging planes, according to the recommendations of the American Society of Echocardiography.9 LA diameter was measured using M-mode or 2-dimensional echocardiography, from the posterior aortic wall to the posterior LA wall, in the parasternal long-axis view at the end-ventricular systole (ie, just before the mitral valve opening), as we have previously reported.10 LA size was indexed by dividing by body surface area (BSA) according to the recommendations of the American Society of Echocardiography.9 Although there are sex differences in LA size, these are nearly completely accounted for by variation in body size.9,11,12 LA enlargement was defined as an indexed LA diameter of 2.3 cm/m2 or greater; an indexed LA diameter below this value defined normal LA size. LA enlargement was further classified as mild (indexed LA diameter, 2.4-2.6 cm/m2), moderate (2.7-2.9 cm/m2), or severe (≥3 cm/m2) in accordance with the recommendations of the American Society of Echocardiography.9 Left ventricular ejection fraction (LVEF) was estimated using the Teichholz formula or Simpson’s rule. Normal LV function was defined as LVEF 55% or greater.9 Left ventricular systolic dysfunction was classified as mild (LVEF 45%-54%), moderate (30%-45%), or severe (<30%) in accordance with the recommendations of the American Society of Echocardiography.9 Pulmonary hypertension was classified according to the systolic pulmonary artery pressure classified as moderate (31-55 mm Hg) and severe (>55 mm Hg). Significant mitral valve disease was defined as more than mild mitral regurgitation or significant mitral valve stenosis. Follow-up and Outcome Measures Follow-up data were retrieved from healthcare databases, electronic medical records, and death certificates. The outcomes were stroke, cardiovascular mortality, the combined event, and all-cause mortality. Cardiovascular death was defined as death due to acute myocardial infarction, sudden cardiac death, heart failure, stroke, cardiovascular procedure, cardiovascular hemorrhage, and other cardiovascular causes (ie, nonstroke intracranial hemorrhage, nonprocedural or nontraumatic vascular rupture, or pulmonary hemorrhage from a pulmonary embolism) as recommended by the American College of Cardiology.13 Ischemic stroke was defined as codes 433.x1, 434.x1, and 436 of the International Classification of Diseases, Ninth Revision. Statistical Analysis The quantitative variables are expressed as mean and standard deviation or median and rank, when appropriate; the qualitative variables are expressed as an absolute value (n) and the percentage. For bivariate analysis, proportions were compared with contingency tables by means of the chisquare test. Student t test or Wilcoxon rank-sum test was used to compare means. One-way analysis of variance was used to determine potential differences in several quantitative variables among the different LA sizes. Survival was determined with Kaplan–Meier methodology. Differences in the probability of survival between groups were analyzed with the log-rank (Mantel–Cox) test. Binary logistic regression analysis was performed to study the potential impact of indexed LA diameter on operative mortality..
(4) Cox proportional hazards regression models were used to assess the associations between indexed LA diameter and outcomes. Adjusted hazard ratio (HR), 95% confidence intervals (CIs), and P values were derived. The assumption of proportionality of hazards was verified using log-minus-log survival plots. Separate analyses were performed using indexed LA diameter as a continuous variable or categorized according to the severity criteria of the American Society of Echocardiography. 9 The linearity assumption of the continuous variables in the model was evaluated by applying restricted cubic spline transformations to the continuous measures using 3 degrees of freedom. Fine-Gray proportional hazard regression for competing events (death) was used to assess the associations between indexed LA diameter and stroke, also adjusting for covariates. Multivariate Cox proportional hazards regression models were adjusted for the following covariables: age, sex, BSA, creatinine clearance, diabetes mellitus, arterial hypertension, dyslipidemia, previous stroke or transient ischemic attack, history of atrial fibrillation or atrial flutter, history of coronary artery disease, severity of left ventricular dysfunction, severity of pulmonary hypertension, type of aortic valve disease, chronic lung disease, extracardiac arteriopathy, active endocarditis, history of cardiac surgery, type of AVS, significant mitral valve disease, concomitant mitral valve intervention, concomitant tricuspid valve intervention, concomitant surgery on thoracic aorta, and concomitant coronary surgery. The study adheres to the STrengthening the Reporting of OBservational studies in Epidemiology initiative.14 The SPSS statistical program for Apple Macintosh version 22.0 (IBM Corporation, Armonk, NY) and R Statistical Software version 3.2.0 (R Foundation for Statistical Computing, Vienna, Austria) were used to perform data analysis.. RESULTS Clinical, Surgical, and Echocardiographic Characteristics The mean age of patients was 70.9 ± 10.8 years, and 1180 of them (58.7%) were men. The demographic and clinical characteristics are summarized in Table 1. The mean indexed LA diameter was 2.4 ± 0.5 cm/m2. According to the criteria of the American Society of Echocardiography, indexed LA diameter was normal in 1287 patients (64%), mildly enlarged in 249 patients (12.4%), moderately enlarged in 185 patients (9.2%), and severely enlarged in 290 patients (14.4%)..
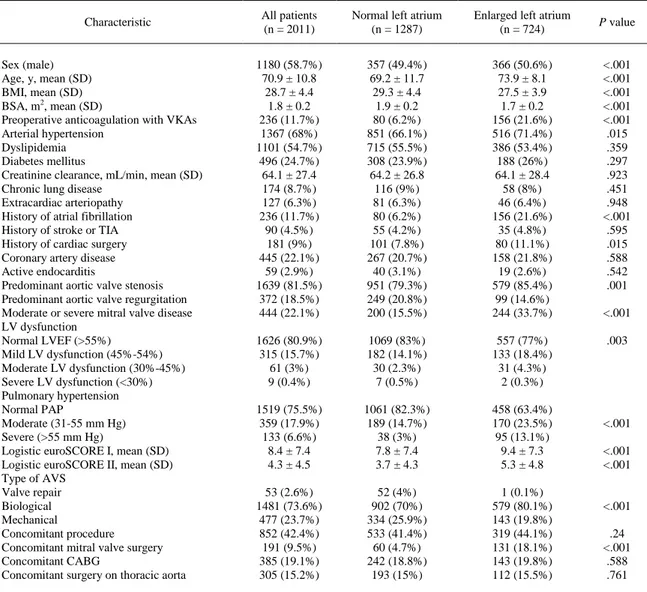
(5) TABLE 1. Demographics, clinical risk factors, and surgical data of both groups Characteristic. Sex (male) Age, y, mean (SD) BMI, mean (SD) BSA, m2, mean (SD) Preoperative anticoagulation with VKAs Arterial hypertension Dyslipidemia Diabetes mellitus Creatinine clearance, mL/min, mean (SD) Chronic lung disease Extracardiac arteriopathy History of atrial fibrillation History of stroke or TIA History of cardiac surgery Coronary artery disease Active endocarditis Predominant aortic valve stenosis Predominant aortic valve regurgitation Moderate or severe mitral valve disease LV dysfunction Normal LVEF (>55%) Mild LV dysfunction (45%-54%) Moderate LV dysfunction (30%-45%) Severe LV dysfunction (<30%) Pulmonary hypertension Normal PAP Moderate (31-55 mm Hg) Severe (>55 mm Hg) Logistic euroSCORE I, mean (SD) Logistic euroSCORE II, mean (SD) Type of AVS Valve repair Biological Mechanical Concomitant procedure Concomitant mitral valve surgery Concomitant CABG Concomitant surgery on thoracic aorta. All patients (n = 2011). Normal left atrium (n = 1287). Enlarged left atrium (n = 724). 1180 (58.7%) 70.9 ± 10.8 28.7 ± 4.4 1.8 ± 0.2 236 (11.7%) 1367 (68%) 1101 (54.7%) 496 (24.7%) 64.1 ± 27.4 174 (8.7%) 127 (6.3%) 236 (11.7%) 90 (4.5%) 181 (9%) 445 (22.1%) 59 (2.9%) 1639 (81.5%) 372 (18.5%) 444 (22.1%). 357 (49.4%) 69.2 ± 11.7 29.3 ± 4.4 1.9 ± 0.2 80 (6.2%) 851 (66.1%) 715 (55.5%) 308 (23.9%) 64.2 ± 26.8 116 (9%) 81 (6.3%) 80 (6.2%) 55 (4.2%) 101 (7.8%) 267 (20.7%) 40 (3.1%) 951 (79.3%) 249 (20.8%) 200 (15.5%). 366 (50.6%) 73.9 ± 8.1 27.5 ± 3.9 1.7 ± 0.2 156 (21.6%) 516 (71.4%) 386 (53.4%) 188 (26%) 64.1 ± 28.4 58 (8%) 46 (6.4%) 156 (21.6%) 35 (4.8%) 80 (11.1%) 158 (21.8%) 19 (2.6%) 579 (85.4%) 99 (14.6%) 244 (33.7%). <.001 <.001 <.001 <.001 <.001 .015 .359 .297 .923 .451 .948 <.001 .595 .015 .588 .542 .001. 1626 (80.9%) 315 (15.7%) 61 (3%) 9 (0.4%). 1069 (83%) 182 (14.1%) 30 (2.3%) 7 (0.5%). 557 (77%) 133 (18.4%) 31 (4.3%) 2 (0.3%). .003. 1519 (75.5%) 359 (17.9%) 133 (6.6%) 8.4 ± 7.4 4.3 ± 4.5. 1061 (82.3%) 189 (14.7%) 38 (3%) 7.8 ± 7.4 3.7 ± 4.3. 458 (63.4%) 170 (23.5%) 95 (13.1%) 9.4 ± 7.3 5.3 ± 4.8. 53 (2.6%) 1481 (73.6%) 477 (23.7%) 852 (42.4%) 191 (9.5%) 385 (19.1%) 305 (15.2%). 52 (4%) 902 (70%) 334 (25.9%) 533 (41.4%) 60 (4.7%) 242 (18.8%) 193 (15%). 1 (0.1%) 579 (80.1%) 143 (19.8%) 319 (44.1%) 131 (18.1%) 143 (19.8%) 112 (15.5%). P value. <.001. <.001 <.001 <.001. <.001 .24 <.001 .588 .761. SD, Standard deviation; BMI, body mass index; BSA, body surface area; VKA, vitamin K antagonist; TIA, transient ischemic attack; LV, left ventricle; LVEF, left ventricle ejection fraction; PAP, pulmonary artery pressure; euroSCORE, European System for Cardiac Operative Risk Evaluation; AVS, aortic valve surgery; CABG, coronary artery bypass grafting.. Patients with LA enlargement were significantly older, more frequently female with increased mean body mass index and BSA, and a higher rate of arterial hypertension and history of atrial fibrillation (Table 1). LA enlargement was associated with a higher rate of preoperative LV dysfunction (23% vs 17%, P = .003) and moderate to severe pulmonary hypertension (36.6% vs 17.7%, P<.001), as well as a higher rate of significant mitral valve disease and need for a mitral valve procedure (Table 1). Of note, an enlarged left atrium was significantly more prevalent in patients with aortic valve stenosis (579 patients, 37.8%) than in patients with aortic valve regurgitation (99 patients, 28.4%) (P = .001). Mean indexed LA diameter was significantly higher in the group of patients with atrial fibrillation (2.8 ± 0.5 cm/m2 vs 2.4 ± 0.4 cm/m2, P<.001). Standard anticoagulation with VKAs at the time of surgery was significantly more frequent in patients with an enlarged LA (n = 156, 21.6%) than in patients with a normal LA (n = 80, 6.2%) (Table 1) (P<.001). The indication for preoperative VKAs was atrial fibrillation in all these patients. Operative data are shown in Table 1..
(6) The mean European System for Cardiac Operative Risk Evaluation (euroSCORE) I and II were 8.4% ± 7.4% and 4.3% ± 4.6%, respectively. Patients with LA enlargement presented a significantly higher euroSCORE I and II (Table 1). A total of 181 patients (9%) had undergone a previous cardiac surgery. A history of cardiac surgery was more frequent among patients with LA enlargement (11.1% vs 7.8%, P = .015). An additional procedure at the time of the AVS was accomplished in 768 patients (n = 37.5%). The associated procedures are summarized in Table 1. Cardiopulmonary bypass and aortic crossclamping times were 98.8 ± 57.9 minutes and 76.3 ± 33.7 minutes, respectively. The median intensive care unit stay was 2 days (range, 1-92 days), and the median in-hospital stay was 7 days (range, 3-152 days). Overall in-hospital mortality was 5.5% (111 patients). Overall in-hospital mortality for isolated AVS was 4.5% (52 patients) and reached 6.9% (59 patients) in combined AVS. There were no statistically significant differences in overall in-hospital mortality between the enlarged LA and normal LA groups (6.6% vs 4.9%, P = .1), in isolated AVS in-hospital mortality (4.7% vs 4.4%, P = .76), and in combined AVS in-hospital mortality (9.1% vs 5.6%, P = .07). Indexed LA diameter also was excluded as an independent risk factor for in-hospital mortality in a binary logistic regression analysis (odds ratio, 1.061; 95% CI, 0686-1.642; P = .789) (Table E1). Left Atrial Size and Outcomes Follow-up consisted of 5942.4 patient-years, and the mean follow-up was 3.2 ± 2.1 years. After hospital discharge, there were 334 deaths and 97 strokes during follow-up. Causes of death are summarized in Table 2. After hospital discharge, the most common cause of late death was cardiac disease (106 patients, 23.8%) followed by infectious disease (80 patients, 18%) and cancer (33 patients, 7.4%) (Table 2). Cardiac cause of death was significantly more frequent among patients with LA enlargement (87 deaths, 39% vs 19 deaths, 8.6%, P <.001). When considering inside cardiovascular mortality all the other causes recommended by the American College of Cardiology, cardiovascular deaths accounted for 55.9% of overall late deaths (n = 249). Cardiovascular mortality also remained significantly more frequent in the group with an enlarged LA (153 deaths, 68.6% vs 96 deaths, 43.2%, P<.001). In 43 patients (9.7%) of the whole series, the cause of late death could not be determined. The 65.6% of patients with an unknown cause of death were aged more than 75 years..
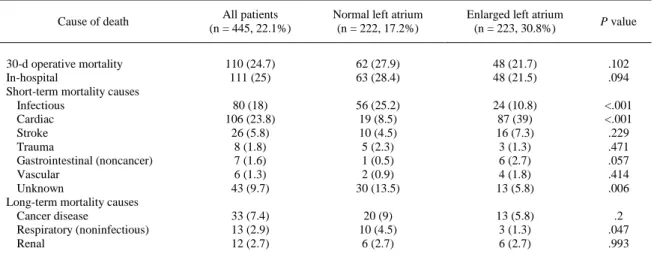
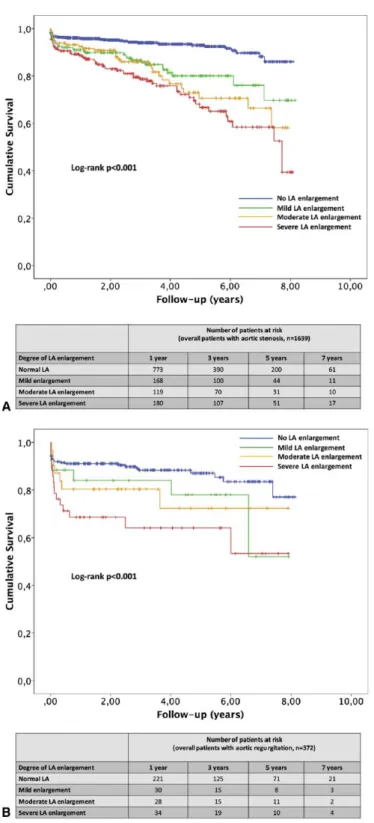
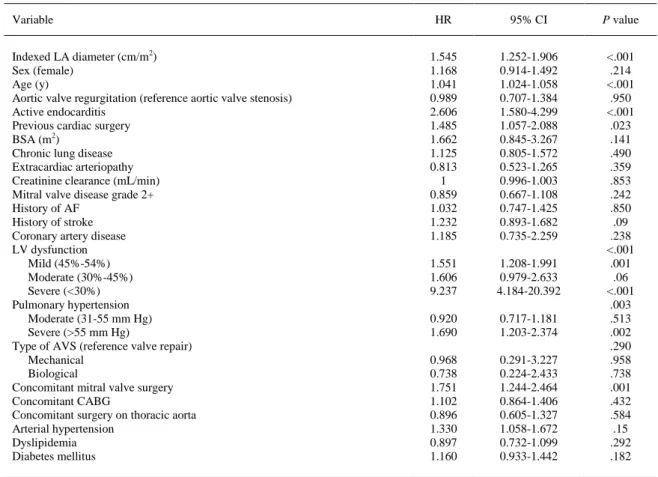
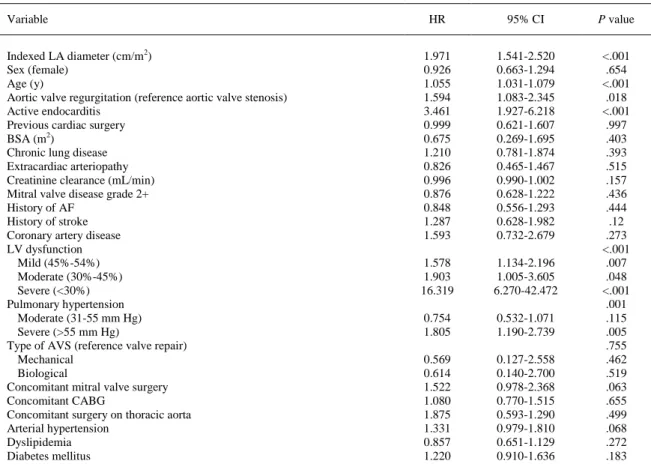
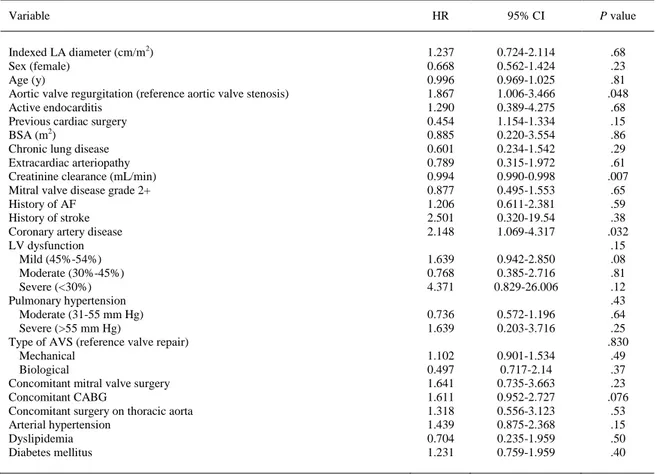
(7) TABLE 2. Causes of death (n = 445) during the follow-up period including in-hospital mortality (n = 111 patients) Cause of death. 30-d operative mortality In-hospital Short-term mortality causes Infectious Cardiac Stroke Trauma Gastrointestinal (noncancer) Vascular Unknown Long-term mortality causes Cancer disease Respiratory (noninfectious) Renal. All patients (n = 445, 22.1%). Normal left atrium (n = 222, 17.2%). Enlarged left atrium (n = 223, 30.8%). P value. 110 (24.7) 111 (25). 62 (27.9) 63 (28.4). 48 (21.7) 48 (21.5). .102 .094. 80 (18) 106 (23.8) 26 (5.8) 8 (1.8) 7 (1.6) 6 (1.3) 43 (9.7). 56 (25.2) 19 (8.5) 10 (4.5) 5 (2.3) 1 (0.5) 2 (0.9) 30 (13.5). 24 (10.8) 87 (39) 16 (7.3) 3 (1.3) 6 (2.7) 4 (1.8) 13 (5.8). <.001 <.001 .229 .471 .057 .414 .006. 33 (7.4) 13 (2.9) 12 (2.7). 20 (9) 10 (4.5) 6 (2.7). 13 (5.8) 3 (1.3) 6 (2.7). .2 .047 .993. Percentages represent the proportion of each cause of death over overall deaths for each group (all patients; normal left atrium and enlarged left atrium).. All-cause cumulative survival at 1 and 5 years was 94.6% and 91.6% among patients with normal LA size, 90% and 65.9% among patients with mild LA enlargement, 87.7% and 59.9% among patients with moderate LA enlargement, and 83.5% and 60.7% among patients with severe LA enlargement, respectively (P<.001) (Figure 1, A; Table E2). Cardiovascular cumulative survival at 1 and 5 years was 99.7% and 97.6% among patients with normal LA size, 96% and 86.8% among patients with mild LA enlargement, 95.9% and 77.9% among patients with moderate LA enlargement, and 96.1% and 77.4% among patients with severe LA enlargement, respectively (P<.001) (Figure 1, B; Table E2). In bivariate analysis, indexed LA diameter was significantly associated with all-cause mortality during follow-up (HR per 1-cm/m2 increment, 2.251; 95% CI, 1.892-2.677; P < .001). After covariable adjustment, multivariate Cox regression analysis showed indexed LA diameter as an independent predictor of all-cause mortality (adjusted HR per 1-cm/m2 increment, 1.545; 95% CI, 1.252-1.906; P<.001) (Table E3). Likewise, bivariate analysis suggested that indexed LA diameter was significantly associated with cardiovascular mortality during follow-up (HR per 1-cm/m2 increment, 1.871; 95% CI, 1.506-2.326; P<.001). After covariable adjustment, multivariate Cox regression analysis confirmed indexed LA diameter as an independent predictor of cardiovascular death (adjusted HR per 1-cm/m2 increment, 1.971; 95% CI, 1.541-2.520; P<.001) (Table E4). There were 97 ischemic stroke events (4.8%) during the follow-up period. Freedom from stroke survival at 1 and 5 years was 98.5% and 94% among patients with normal LA size, 98.2% and 90.9% among patients with mild LA enlargement, 98.2% and 91.4% among patients with moderate LA enlargement, and 96.4% and 91.3% among patients with severe LA enlargement, respectively (P = .226) (Figure 2, A). In bivariate analysis, indexed LA diameter was significantly associated with the risk of stroke during follow-up (HR per 1-cm/m2 increment, 1.507; 95% CI, 1.072-2.119; P = .018). However, competing risks regression could not confirm that indexed LA diameter was associated with a higher risk of stroke (HR per 1-cm increment, 1.237; 95% CI, 0.724-2.114; P = .68) (Table E5)..
(8) During the follow-up period, 313 patients (15.6%) had a stroke or a cardiovascular death, among whom 31 (1.5%) presented both events. Freedom from the combined event at 1 and 5 years was 93.3% and 87.2% among patients with normal indexed LA size, 89.3% and 74.5% among patients with mild LA enlargement, 89.9% and 68% among patients with moderate LA enlargement, and 84.2% and 64.5% among patients with severe LA enlargement, respectively (P<.001) (Figure 2, B). In bivariate analysis, indexed LA diameter was significantly associated with the risk of a combined event during follow-up (HR per 1-cm increment, 1.989; 95% CI, 1.685-2.347; P<.001). After covariable adjustment, multivariate Cox regression demonstrated indexed LA diameter as an independent risk factor for the combined event (HR per 1-cm/m2 increment, 1.673; 95% CI, 1.321-2.119; P<.001) (Table E6). Finally, a separate analysis was performed in patients according to the type of aortic valve lesion. Figure 3 depicts the cardiovascular cumulative survival in patients with aortic valve stenosis (Figure 3, A) and in patients with aortic valve regurgitation (Figure 3, B). In both subgroups, cardiovascular cumulative survival at 1 and 5 years was worse among patients with an enlarged LA. Indexed LA diameter was confirmed in an adjusted multivariate Cox regression analysis (Tables E7 and E8) as an independent predictor of cardiovascular death in patients with aortic valve stenosis (adjusted HR per 1-cm/m2 increment, 1.947; 95% CI, 1.454-2.607; P<.001) or regurgitation (adjusted HR per 1-cm/m2 increment, 1.925; 95% CI, 1.076-3.444; P = .027)..
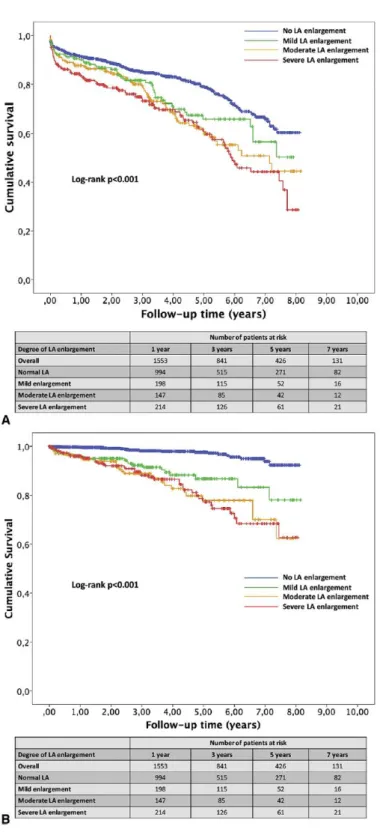
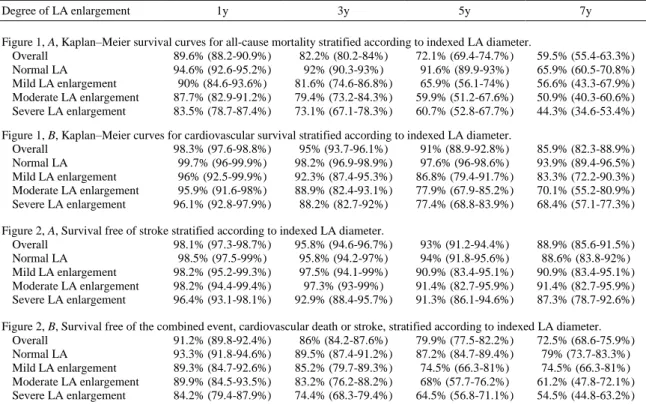
(9) FIGURE 1. A, Kaplan–Meier survival curves for all-cause mortality stratified according to indexed LA diameter (P<.001). B, Kaplan–Meier curves for cardiovascular survival stratified according to indexed LA diameter (P<.001). Normal indexed LA diameter less than 2.4 cm/m2; mild enlargement: 2.4 to 2.6 cm/m2; moderate enlargement: 2.7 to 2.9 cm/m2; severe enlargement: 3 cm/m2 or more, in accordance with the recommendations of the American Society of Echocardiography.7 Table E2 reports Kaplan– Meier survival at 1, 3, 5, and 7 years for each panel of each figure, including 95%confidence limits..
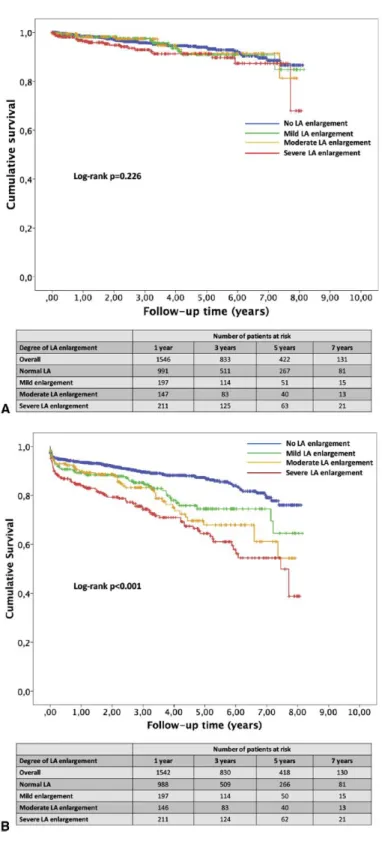
(10) FIGURE 2. A, Survival free of stroke stratified according to indexed LA diameter (P = .226). B, Survival free of the combined event, cardiovascular death or stroke, stratified according to indexed LA diameter (P<.001). Normal indexed LA diameter less than 2.4 cm/m2; mild enlargement: 2.4 to 2.6 cm/m2; moderate enlargement: 2.7 to 2.9 cm/m2; severe enlargement: 3 cm/m2 or more in accordance with the recommendations of the American Society of Echocardiography.7 Table E2 reports Kaplan–Meier survival at 1, 3, 5, and 7 years for each panel of each figure, including 95% confidence limits..
(11) FIGURE 3. A, Kaplan–Meier curves for cardiovascular survival in patients with aortic valve stenosis (n = 1639) stratified according to indexed LA diameter (P<.001). B, Kaplan–Meier curves for cardiovascular survival in patients with aortic valve regurgitation (n = 372) stratified according to indexed LA diameter (P<.001). Normal indexed LA diameter less than 2.4 cm/m 2; mild enlargement: 2.4 to 2.6 cm/m2; moderate enlargement: 2.7 to 2.9 cm/m2; severe enlargement: 3 cm/m2 or more in accordance with the recommendations of the American Society of Echocardiography.7 Table E2 reports Kaplan–Meier survival at 1, 3, 5, and 7 years for each panel of each figure, including 95% confidence limits..
(12) DISCUSSION Our study demonstrates that indexed LA measurement is a strong predictor of long-term outcomes in patients with aortic valve disease undergoing surgery. In a population of 2011 patients undergoing AVS, the presence of an enlarged LA preoperatively was associated with higher long-term all-cause and cardiovascular mortality, as well as with the combined event stroke and cardiovascular mortality. Beach and colleagues8 found that severe preoperative LA dilatation, expressed as nonindexed LA diameter, was predictive of a larger residual LA size and substantially reduced long-term survival after AVS in patients with aortic stenosis. To the best of our knowledge, this is the first study addressing the value of indexed LA diameter as a predictor of long-term results in this subset of patients who typically present an impaired diastolic LV function and chronically elevated LV filling pressures. Different LA measurements have been identified as predictors of stroke and death in the general population.1,2,15 LA size increases with persistently elevated LV filling pressure and has been correlated with the severity of aortic valve stenosis.16-18 Casaclang-Verzosa and colleagues7 demonstrated that nonindexed LA diameter was related to mortality in asymptomatic patients with severe AS. In our study, LA enlargement was significantly more prevalent among patients with aortic valve stenosis than those with regurgitation. LA enlargement also is a common echocardiographic finding in hypertensive patients.19-21 Cuspidi and colleagues19 related LA size and enlargement to LV mass and hypertrophy. Our findings are in line with those from other authors, and the group with LA enlargement presented a significantly higher rate of arterial hypertension. In both types of patients, the increase of LVend-diastolic pressure is associated with an increase in diastolic filling and a significant reduction of active and passive emptying contribution of left atrium to LV stroke volume.22 In hypertensive patients, strokes have been associated with larger LA sizes.21 In 2013, Shin and colleagues23 suggested that LA enlargement influenced most patients in all subtypes of ischemic stroke but was most prevalent in the cardioembolic stroke subtype. Although in our series, indexed LA size increased the risk of stroke in 50.7% per 1-cm/m2 enlargement in univariable analysis, multivariate competing risks regression could not confirm that association. However, when analyzing the combined event cardiovascular death or stroke, indexed LA size proved to be an independent risk factor in the multivariate analysis. In our series, we found that 15.6% of the patients had a cardiovascular death or a stroke, among whom 31 had both events. There was a 67.3% increase in the risk of cardiovascular death or stroke per each centimeter per square meter of increment in indexed LA diameter. More than 73% of the patients in this series received a biological AV prosthesis. This proportion was significantly higher among patients with an enlarged LA. The rationale behind this finding is that the group with LA enlargement was significantly older and therefore more prone to benefit from a biological prosthesis. Of note, the multivariate analysis did not confirm any specific surgical procedure over the aortic valve (repair, bioprosthesis, or mechanical prosthesis) as an independent predictor for long-term survival. Despite a higher expected operative mortality as determined by both euroSCORE I and II, observed in-hospital mortality was not significantly higher in the group with enlarged LA. Our results demonstrate that an enlarged LA poses a significant risk of all-cause mortality in patients undergoing AVS. We found a 54.5% higher risk of all-cause mortality per 1-cm/m2 increment in indexed LA diameter. By using the definition of cardiovascular death as recommended by the American College of Cardiology,13 we found 249 cardiovascular deaths in the whole series. Cardiovascular deaths accounted for 66.8% of late deaths in the group of LA enlargement, being significantly more frequent than in patients with normal LA.
(13) dimensions. Moreover, indexed LA size increased the risk of cardiovascular death in more than 97.1% per 1-cm/m2 increment. This finding emphasizes the paramount importance of an enlarged LA in patients with aortic valve diseases who undergo an AVS.. CONCLUSIONS Indexed LA measurements reflect the burden of elevated LV filling pressure in this critical subset of patients. Indexed LA diameters are strong predictors of long-term outcome of these patients; therefore, they may be useful to guide the best therapy for aortic valve diseases. These indexed measurements should become a routine laboratory measure in the preoperative evaluation of patients with aortic valve diseases (Video 1).. VIDEO 1. The more relevant findings of the study are summarized. Video available at: http://www.jtcvs.org.. Finally, future efforts should focus on assessing the postoperative change in indexed LA size and its potential value as a marker of the degree of relief of LV volume or pressure overload and therefore of the surgical result. Study Limitations This study presents the limitations inherent in any retrospective study. A total of 400 patients were excluded from the study because of the absence of echocardiographic data regarding LA dimension. Risk factors of excluded and included patients have been compared. There were no statistically significant differences between both groups (Table E9)..
(14) Although we performed a thorough search across several databases, the cause of late death could not be determined in 43 patients. On the other hand, as described by Lauer and colleagues,24 the ascertainment of the cause of death may be susceptible to bias and misclassification. Although we controlled for several important covariables, because this was an observational study, residual confounding may account for at least part of the observed differences in outcome. Some studies have pointed out that LA volume is a more reliable estimator of LA size than LA diameter9,25 and may be a more accurate predictor of cardiovascular events. 26 Nevertheless, indexed LA diameter is more readily available and more widely used in clinical practice. In addition, LA diameters, when indexed to BSA, account for the sex differences in LA size by variation in body size.9,11,12 Finally, enlargement of the LA mainly represents the chronic effect of elevated LV filling pressures on the LA. However, this study did not analyze the prognostic role of diastolic parameters, such as the mitral septallateral e´ and E/e´ ratio.9 Further studies are warranted to compare the prognostic role of LA enlargement with other parameters of LV diastolic function, such as the mitral septal-lateral e´ and E/e´ ratio. Conflict of Interest Statement Authors have nothing to disclose with regard to commercial support. The authors thank Teresa Seoane-Pillado, PhD, MSc, from the Clinical Epidemiology and Biostatistics Unit, who gave expert statistical advice.. References 1. 2. 3. 4. 5.. 6. 7.. 8.. 9.. 10.. Benjamin EJ, D’Agostino RB, Belanger AJ,Wolf PA, Levy D. Left atrial size and the risk of stroke and death. The Framingham Heart Study. Circulation. 1995;92:835-41. Bouzas-Mosquera A, Broullón FJ, Álvarez-García N, Méndez E, Peteiro J, Gándara-Sambade T, et al. Left atrial size and risk for all-cause mortality and ischemic stroke. CMAJ. 2011;183:E657-64. Sabharwal N, Cemin R, Rajan K, Hickman M, Lahiri A, Senior R. Usefulness of left atrial volume as a predictor of mortality in patients with ischemic cardiomyopathy. Am J Cardiol. 2004;94:760-3. Beinart R, Boyko V, Schwammenthal E, Kuperstein R, Sagie A, Hod H, et al. Long-term prognostic significance of left atrial volume in acute myocardial infarction. J Am Coll Cardiol. 2004;44:327-34. Nistri S, Olivotto I, Betocchi S, Losi MA, Valsecchi G, Pinamonti B, et al. Prognostic significance of left atrial size in patients with hypertrophic cardiomyopathy (from the Italian Registry for Hypertrophic Cardiomyopathy). Am J Cardiol. 2006;98:960-5. Douglas PS. The left atrium: a biomarker of chronic diastolic dysfunction and cardiovascular disease risk. J Am Coll Cardiol. 2003;42:1206-7. Casaclang-Verzosa G, Malouf JF, Scott CG, Juracan EM, Nishimura RA, Pellikka PA. Does left atrial size predict mortality in asymptomatic patients with severe aortic stenosis? Echocardiography. 2010;27:105-9. Beach JM, Mihaljevic T, Rajeswaran J, Marwick T, Edwards ST, Nowicki ER, et al. Ventricular hypertrophy and left atrial dilatation persist and are associated with reduced survival after valve replacement for aortic stenosis. J Thorac Cardiovasc Surg. 2014;147:362-9.e8. Lang RM, Bierig M, Devereux RB, Flachskampf FA, Foster E, Pellikka PA, et al; Chamber Quantification Writing Group; American Society of Echocardiography’s Guidelines and Standards Committee; EuropeanAssociation of Echocardiography. Recommendations for chamber quantification: a report from the American Society of Echocardiography’s Guidelines and Standards Committee and the Chamber Quantification Writing Group, developed in conjunction with the European Association of Echocardiography, a branch of the European Society of Cardiology. J Am Soc Echocardiogr. 2005;18:1440-63. Bouzas-Mosquera A, Broullón FJ, Álvarez-García N, Peteiro J, Mosquera VX, Castro-Beiras A. Association of left ventricular mass with all-cause mortality, myocardial infarction and stroke. PLoS One. 2012;7:e45570..
(15) 11.. 12. 13.. 14.. 15.. 16.. 17. 18.. 19.. 20. 21. 22.. 23.. 24. 25. 26.. Spencer KT, Mor-Avi V, Gorcsan J 3rd, DeMaria AN, Kimball TR, Monaghan MJ, et al. Effects of aging on left atrial reservoir, conduit, and booster pump function: a multi-institution acoustic quantification study. Heart. 2001;85:272-7. Pritchett AM, Jacobsen SJ, Mahoney DW, Rodeheffer RJ, Bailey KR, Redfield MM. Left atrial volume as an index of left atrial size: a population-based study. J Am Coll Cardiol. 2003;41:1036-43. Hicks KA, Tcheng JE, Bozkurt B, Chaitman BR, Cutlip DE, Farb A, et al. 2014 ACC/AHA Key Data Elements and Definitions for Cardiovascular Endpoint Events in Clinical Trials: A Report of the American College of Cardiology/American Heart Association Task Force on Clinical Data Standards (Writing Committee to Develop Cardiovascular Endpoints Data Standards). J Am Coll Cardiol. 2015;66:403-69. von Elm E, Altman DG, Egger M, Pocock SJ, Gotzsche PC, Vandenbroucke JP. Strengthening the Reporting of Observational Studies in Epidemiology (STROBE) statement: guidelines for reporting observational studies. Lancet. 2007;370:1453-7. Kizer JR, Bella JN, Palmieri V, Liu JE, Best LG, Lee ET, et al. Left atrial diameter as an independent predictor of first clinical cardiovascular events in middle-aged and elderly adults: the Strong Heart Study (SHS). Am Heart J. 2006;151:412-8. Dalsgaard M, Egstrup K,Wachtell K, Gerdts E, Cramariuc D, Kjaergaard J, et al. Left atrial volume in patients with asymptomatic aortic valve stenosis (the Simvastatin and Ezetimibe in Aortic Stenosis study). Am J Cardiol. 2008;101:1030-4. Cioffi G, Cramariuc D, Dalsgaard M, Davidsen ES, Egstrup K, de Simone G, et al. Left atrial systolic force in asymptomatic aortic stenosis. Echocardiography. 2011;28:968-77. Cioffi G, Cramariuc D, Dalsgaard M, Davidsen ES, Egstrup K, Rossebø AB, et al. Left atrial systolic force and outcome in asymptomatic mild to moderate aortic stenosis. Echocardiography. 2012;29:103844. Cuspidi C, Meani S, Fusi V, Valerio C, Catini E, Sala C, et al. Prevalence and correlates of left atrial enlargement in essential hypertension: role of ventricular geometry and the metabolic syndrome: the Evaluation of Target Organ Damage in Hypertension study. J Hypertens. 2005;23:875-82. Gerdts E. Left atrial enlargement: a prevalent marker of hypertensive heart disease. Blood Press. 2012;21:71-2. Piotrowski G, Banach M, Gerdts E, Mikhailidis DP, Hannam S, Gawor R, et al. Left atrial size in hypertension and stroke. J Hypertens. 2011;29:1988-93. Mattioli AV, Bonatti S, Monopoli D, Zennaro M, Mattioli G. Influence of regression of left ventricular hypertrophy on left atrial size and function in patients with moderate hypertension. Blood Press. 2005;14:273-8. Shin HY, Jeong IH, Kang CK, Shin DJ, Park HM, Park KH, et al. Relation between left atrial enlargement and stroke subtypes in acute ischemic stroke patients. J Cerebrovasc Endovasc Neurosurg. 2013;15:131-6. Lauer MS, Blackstone EH, Young JB, Topol EJ. Cause of death in clinical research: time for a reassessment? J Am Coll Cardiol. 1999;34:618-20. Lester SJ, Ryan EW, Schiller NB, Foster E. Best method in clinical practice and in research studies to determine left atrial size. Am J Cardiol. 1999;84:829-32. Tsang TS, Abhayaratna WP, Barnes ME, Miyasaka Y, Gersh BJ, Bailey KR, et al. Prediction of cardiovascular outcomes with left atrial size: is volume superior to area or diameter? J Am Coll Cardiol. 2006;47:1018-23..
(16) TABLE E1. Binary logistic regression model for in-hospital mortality Variable Indexed LA diameter (cm/m2) Sex (female) Age (y) Active endocarditis Previous cardiac surgery BSA (m2) Chronic lung disease Extracardiac arteriopathy Creatinine clearance (mL/min) Mitral valve disease grade 2+ History of AF History of stroke LV dysfunction Mild (45%-54%) Moderate (30%-45%) Severe (<30%) Pulmonary hypertension Moderate (31-55 mm Hg) Severe (>55 mm Hg) Concomitant mitral valve surgery Concomitant CABG Concomitant surgery on thoracic aorta Cardiopulmonary bypass time Aortic crossclamp time. HR. 95% CI. P value. 1.061 1.227 1.069 1.432 1.187 0.191 1.125 1.119 0.994 0.663 1.012 1.031. 0.686-1.642 0.773-1.947 1.030-1.108 0.467-4.392 0.592-2.382 0.044-0.841 0.805-1.572 0.474 -2.642 0.986-1.003 0.396-1.192 0.664-1.321 0.747-1.425. 1.458 2.281 8.990. 0.847-2.510 0.865-6.016 1.421-56.864. 1.116 2.651 3.230 1.512 1.025 1.005 1.009. 0.634-1.966 1.374-5.113 1.368-7.623 0.731-3124 0.553-1.902 1.002-1.009 1.001-1.017. .789 .386 <.001 .530 .629 .029 .490 .798 .184 .170 .850 .850 .038 .174 .095 .002 .012 .704 .004 .007 .265 .936 .004 .034. HR, Hazard ratio; CI, confidence interval; LA, left atrial; BSA, body surface area; AF, atrial fibrillation; LV, left ventricle; CABG, coronary artery bypass grafting..
(17) TABLE E2. Kaplan–Meier survival at 1, 3, 5, and 7 years for each panel of each figure, reporting 95% confidence limits in brackets Degree of LA enlargement. 1y. 3y. 5y. 7y. Figure 1, A, Kaplan–Meier survival curves for all-cause mortality stratified according to indexed LA diameter. Overall 89.6% (88.2-90.9%) 82.2% (80.2-84%) 72.1% (69.4-74.7%) Normal LA 94.6% (92.6-95.2%) 92% (90.3-93%) 91.6% (89.9-93%) Mild LA enlargement 90% (84.6-93.6%) 81.6% (74.6-86.8%) 65.9% (56.1-74%) Moderate LA enlargement 87.7% (82.9-91.2%) 79.4% (73.2-84.3%) 59.9% (51.2-67.6%) Severe LA enlargement 83.5% (78.7-87.4%) 73.1% (67.1-78.3%) 60.7% (52.8-67.7%). 59.5% (55.4-63.3%) 65.9% (60.5-70.8%) 56.6% (43.3-67.9%) 50.9% (40.3-60.6%) 44.3% (34.6-53.4%). Figure 1, B, Kaplan–Meier curves for cardiovascular survival stratified according to indexed LA diameter. Overall 98.3% (97.6-98.8%) 95% (93.7-96.1%) 91% (88.9-92.8%) Normal LA 99.7% (96-99.9%) 98.2% (96.9-98.9%) 97.6% (96-98.6%) Mild LA enlargement 96% (92.5-99.9%) 92.3% (87.4-95.3%) 86.8% (79.4-91.7%) Moderate LA enlargement 95.9% (91.6-98%) 88.9% (82.4-93.1%) 77.9% (67.9-85.2%) Severe LA enlargement 96.1% (92.8-97.9%) 88.2% (82.7-92%) 77.4% (68.8-83.9%). 85.9% (82.3-88.9%) 93.9% (89.4-96.5%) 83.3% (72.2-90.3%) 70.1% (55.2-80.9%) 68.4% (57.1-77.3%). Figure 2, A, Survival free of stroke stratified according to indexed LA diameter. Overall 98.1% (97.3-98.7%) 95.8% (94.6-96.7%) Normal LA 98.5% (97.5-99%) 95.8% (94.2-97%) Mild LA enlargement 98.2% (95.2-99.3%) 97.5% (94.1-99%) Moderate LA enlargement 98.2% (94.4-99.4%) 97.3% (93-99%) Severe LA enlargement 96.4% (93.1-98.1%) 92.9% (88.4-95.7%). 88.9% (85.6-91.5%) 88.6% (83.8-92%) 90.9% (83.4-95.1%) 91.4% (82.7-95.9%) 87.3% (78.7-92.6%). 93% (91.2-94.4%) 94% (91.8-95.6%) 90.9% (83.4-95.1%) 91.4% (82.7-95.9%) 91.3% (86.1-94.6%). Figure 2, B, Survival free of the combined event, cardiovascular death or stroke, stratified according to indexed LA diameter. Overall 91.2% (89.8-92.4%) 86% (84.2-87.6%) 79.9% (77.5-82.2%) 72.5% (68.6-75.9%) Normal LA 93.3% (91.8-94.6%) 89.5% (87.4-91.2%) 87.2% (84.7-89.4%) 79% (73.7-83.3%) Mild LA enlargement 89.3% (84.7-92.6%) 85.2% (79.7-89.3%) 74.5% (66.3-81%) 74.5% (66.3-81%) Moderate LA enlargement 89.9% (84.5-93.5%) 83.2% (76.2-88.2%) 68% (57.7-76.2%) 61.2% (47.8-72.1%) Severe LA enlargement 84.2% (79.4-87.9%) 74.4% (68.3-79.4%) 64.5% (56.8-71.1%) 54.5% (44.8-63.2%) Figure 3, A, Kaplan–Meier curves for cardiovascular survival in patients with aortic valve stenosis (n = 1639) stratified according to indexed LA diameter. Overall 93.8% (92.5-94.9%) 89.7% (87.9-91.3%) 84.2% (81.5-86.6%) 78.9% (74.6-82.6%) Normal LA 95.9% (94.4-97%) 94% (92.1-95.5%) 93% (90.6-94.8%) 88.2% (82.5-92.2%) Mild LA enlargement 91% (86.1-94.2%) 86.7% (80.7-91%) 80.1% (71.9-86.1%) 76.1% (64.1-84.5%) Moderate LA enlargement 92.4% (86.7-95.7%) 86% (78.5-91%) 70.6% (58.6-79.8%) 66.5% (52.1-77.4%) Severe LA enlargement 88.7% (83.7-92.2%) 78.7% (72-84%) 66.8% (57.4-74.5%) 58.4% (46.9-57.6%) Figure 3, B, Kaplan–Meier curves for cardiovascular survival in patients with aortic valve regurgitation (n = 372) stratified according to indexed LA diameter. Overall 86.9% (82.8-90%) 84.5% (79.9-88.1%) 82.3% (77.1-86.4%) 76.8% (69-82.8%) Normal LA 91.1% (86.8-94%) 88.4% (83.2-92%) 87.1% (81.2-91.2%) 83.5% (75.4-89.2%) Mild LA enlargement 80.4% (61.5-90.7%) 80.4% (61.5-90.7%) 72.4% (47.4-86.9%) 72.4% (47.4-86.9%) Moderate LA enlargement 84% (62.7-93.7%) 84% (62.7-93.7%) 78% (54.1-90.5%) 52% (9.7-83.3%) Severe LA enlargement 68.6% (52.1-80.5%) 64.1% (46.1-77.4%) 64.1% (46.1-77.4%) 53.4% (28.5-73%). LA, Left atrial..
(18) TABLE E3. Multivariate Cox proportional hazards model: Survival all-cause mortality Variable Indexed LA diameter (cm/m2) Sex (female) Age (y) Aortic valve regurgitation (reference aortic valve stenosis) Active endocarditis Previous cardiac surgery BSA (m2) Chronic lung disease Extracardiac arteriopathy Creatinine clearance (mL/min) Mitral valve disease grade 2+ History of AF History of stroke Coronary artery disease LV dysfunction Mild (45%-54%) Moderate (30%-45%) Severe (<30%) Pulmonary hypertension Moderate (31-55 mm Hg) Severe (>55 mm Hg) Type of AVS (reference valve repair) Mechanical Biological Concomitant mitral valve surgery Concomitant CABG Concomitant surgery on thoracic aorta Arterial hypertension Dyslipidemia Diabetes mellitus. HR. 95% CI. P value. 1.545 1.168 1.041 0.989 2.606 1.485 1.662 1.125 0.813 1 0.859 1.032 1.232 1.185. 1.252-1.906 0.914-1.492 1.024-1.058 0.707-1.384 1.580-4.299 1.057-2.088 0.845-3.267 0.805-1.572 0.523-1.265 0.996-1.003 0.667-1.108 0.747-1.425 0.893-1.682 0.735-2.259. 1.551 1.606 9.237. 1.208-1.991 0.979-2.633 4.184-20.392. 0.920 1.690. 0.717-1.181 1.203-2.374. 0.968 0.738 1.751 1.102 0.896 1.330 0.897 1.160. 0.291-3.227 0.224-2.433 1.244-2.464 0.864-1.406 0.605-1.327 1.058-1.672 0.732-1.099 0.933-1.442. <.001 .214 <.001 .950 <.001 .023 .141 .490 .359 .853 .242 .850 .09 .238 <.001 .001 .06 <.001 .003 .513 .002 .290 .958 .738 .001 .432 .584 .15 .292 .182. HR, Hazard ratio; CI, confidence interval; LA, left atrial; BSA, body surface area; AF, atrial fibrillation; LV, left ventricle; AVS, aortic valve surgery; CABG, coronary artery bypass grafting..
(19) TABLE E4. Cox proportional hazards model: Survival cardiovascular mortality Variable Indexed LA diameter (cm/m2) Sex (female) Age (y) Aortic valve regurgitation (reference aortic valve stenosis) Active endocarditis Previous cardiac surgery BSA (m2) Chronic lung disease Extracardiac arteriopathy Creatinine clearance (mL/min) Mitral valve disease grade 2+ History of AF History of stroke Coronary artery disease LV dysfunction Mild (45%-54%) Moderate (30%-45%) Severe (<30%) Pulmonary hypertension Moderate (31-55 mm Hg) Severe (>55 mm Hg) Type of AVS (reference valve repair) Mechanical Biological Concomitant mitral valve surgery Concomitant CABG Concomitant surgery on thoracic aorta Arterial hypertension Dyslipidemia Diabetes mellitus. HR. 95% CI. P value. 1.971 0.926 1.055 1.594 3.461 0.999 0.675 1.210 0.826 0.996 0.876 0.848 1.287 1.593. 1.541-2.520 0.663-1.294 1.031-1.079 1.083-2.345 1.927-6.218 0.621-1.607 0.269-1.695 0.781-1.874 0.465-1.467 0.990-1.002 0.628-1.222 0.556-1.293 0.628-1.982 0.732-2.679. 1.578 1.903 16.319. 1.134-2.196 1.005-3.605 6.270-42.472. 0.754 1.805. 0.532-1.071 1.190-2.739. 0.569 0.614 1.522 1.080 1.875 1.331 0.857 1.220. 0.127-2.558 0.140-2.700 0.978-2.368 0.770-1.515 0.593-1.290 0.979-1.810 0.651-1.129 0.910-1.636. <.001 .654 <.001 .018 <.001 .997 .403 .393 .515 .157 .436 .444 .12 .273 <.001 .007 .048 <.001 .001 .115 .005 .755 .462 .519 .063 .655 .499 .068 .272 .183. HR, Hazard ratio; CI, confidence interval; LA, left atrial; BSA, body surface area; AF, atrial fibrillation; LV, left ventricle; AVS, aortic valve surgery; CABG, coronary artery bypass grafting..
(20) TABLE E5. Fine-Gray proportional hazard regression for incidence of stroke accounting for competing events (death) Variable Indexed LA diameter (cm/m2) Sex (female) Age (y) Aortic valve regurgitation (reference aortic valve stenosis) Active endocarditis Previous cardiac surgery BSA (m2) Chronic lung disease Extracardiac arteriopathy Creatinine clearance (mL/min) Mitral valve disease grade 2+ History of AF History of stroke Coronary artery disease LV dysfunction Mild (45%-54%) Moderate (30%-45%) Severe (<30%) Pulmonary hypertension Moderate (31-55 mm Hg) Severe (>55 mm Hg) Type of AVS (reference valve repair) Mechanical Biological Concomitant mitral valve surgery Concomitant CABG Concomitant surgery on thoracic aorta Arterial hypertension Dyslipidemia Diabetes mellitus. HR. 95% CI. P value. 1.237 0.668 0.996 1.867 1.290 0.454 0.885 0.601 0.789 0.994 0.877 1.206 2.501 2.148. 0.724-2.114 0.562-1.424 0.969-1.025 1.006-3.466 0.389-4.275 1.154-1.334 0.220-3.554 0.234-1.542 0.315-1.972 0.990-0.998 0.495-1.553 0.611-2.381 0.320-19.54 1.069-4.317. 1.639 0.768 4.371. 0.942-2.850 0.385-2.716 0.829-26.006. 0.736 1.639. 0.572-1.196 0.203-3.716. 1.102 0.497 1.641 1.611 1.318 1.439 0.704 1.231. 0.901-1.534 0.717-2.14 0.735-3.663 0.952-2.727 0.556-3.123 0.875-2.368 0.235-1.959 0.759-1.959. .68 .23 .81 .048 .68 .15 .86 .29 .61 .007 .65 .59 .38 .032 .15 .08 .81 .12 .43 .64 .25 .830 .49 .37 .23 .076 .53 .15 .50 .40. HR, Hazard ratio; CI, confidence interval; LA, left atrial; BSA, body surface area; AF, atrial fibrillation; LV, left ventricle; AVS, aortic valve surgery; CABG, coronary artery bypass grafting..
(21) TABLE E6. Multivariate Cox proportional hazards model: Freedom from combined event (cardiovascular death or stroke) Variable Indexed LA diameter (cm/m2) Sex (female) Age (y) Aortic valve regurgitation (reference aortic valve stenosis) Active endocarditis Previous cardiac surgery BSA (m2) Chronic lung disease Extracardiac arteriopathy Creatinine clearance (mL/min) Mitral valve disease grade 2+ History of AF History of stroke Coronary artery disease LV dysfunction Mild (45%-54%) Moderate (30%-45%) Severe (<30%) Pulmonary hypertension Moderate (31-55 mm Hg) Severe (>55 mm Hg) Type of AVS (reference valve repair) Mechanical Biological Concomitant mitral valve surgery Concomitant CABG Concomitant surgery on thoracic aorta Arterial hypertension Dyslipidemia Diabetes mellitus. HR. 95% CI. P value. 1.673 0.966 1.038 1.461 3.414 1.042 0.513 0.141 0.826 0.998 0.812 0.809 1.329 1.461. 1.321-2.119 0.716-1.302 1.018-1.058 1.027-2.079 2.024-5.756 0.683-1.592 0.226-1.165 0.763-1.706 0.493-1.385 0.993-1.002 0.579-1.138 0.521-1.258 1.151-2.373 0.732-1.581. 1.503 1.498 13.229. 1.112-2.033 0.796-2.819 5.538-31.600. 0.759 1.744. 0.554-1.039 1.185-2.567. 1.906 0.772 1.754 1.138 0.868 1.297 0.992 1.175. 0.717-3.596 0.172-2.084 1.134-2.713 0.815-1.587 0.530-1.421 0.958-1.755 0.755-1.303 0.880-2.713. <.001 .819 .001 .035 <.001 .848 .111 .520 .469 .368 .226 .347 .031 .19 <.001 .008 .210 <.001 .01 .086 .005 .722 .421 .462 .012 .448 .573 .093 .954 .273. HR, Hazard ratio; CI, confidence interval; LA, left atrial; BSA, body surface area; AF, atrial fibrillation; LV, left ventricle; AVS, aortic valve surgery; CABG, coronary artery bypass grafting..
(22) TABLE E7. Cox proportional hazards model: Survival cardiovascular mortality in the subgroup of patients with aortic valve stenosis (n = 1639) Variable Indexed LA diameter (cm/m2) Sex (female) Age (y) Active endocarditis Previous cardiac surgery BSA (m2) Chronic lung disease Extracardiac arteriopathy Creatinine clearance (mL/min) Mitral valve disease grade 2+ History of AF History of stroke Coronary artery disease LV dysfunction Mild (45%-54%) Moderate (30%-45%) Severe (<30%) Pulmonary hypertension Moderate (31-55 mm Hg) Severe (>55 mm Hg) Type of AVS (reference valve repair) Mechanical Biological Concomitant mitral valve surgery Concomitant CABG Concomitant surgery on thoracic aorta Arterial hypertension Dyslipidemia Diabetes mellitus. HR. 95% CI. P value. 1.947 0.677 1.052 6.027 0.914 0.388 1.147 1.572 0.428 1.006 1.053 1.256 1.009. 1.454-2.607 0.463-0.990 1.024-1.082 0.823-44.139 0.526-1.588 0.135-1.114 0.682-1.928 0.933-2.650 0.992-1.003 0.698-1.449 0.669-1.659 0.625-1.922 0.695-1.465. 1.419 1.702 14.264. 0.957-2.103 0.840-3.447 5.354-38.000. 0.979 1.981. 0.665-1.443 1.209-3.246. 0.719 0.811 1.088 1.091 1.881 1.351 0.754 1.320. 0.323-4.287 0.143-1.998 0.608-1.949 0.799-1.815 0.598-1.791 0.946-1.931 0.550-1.035 0.952-1.832. <.001 .044 <.001 .077 .749 .079 .605 .089 .428 .976 .822 .211 .961 <.001 .082 .14 <.001 .017 .915 .007 .994 .911 .877 .776 .961 .974 .098 .081 .089. HR, Hazard ratio; CI, confidence interval; LA, left atrial; BSA, body surface area; AF, atrial fibrillation; LV, left ventricle; AVS, aortic valve surgery; CABG, coronary artery bypass grafting..
(23) TABLE E8. Cox proportional hazards model: Survival cardiovascular mortality in the subgroup of patients with aortic valve regurgitation (n = 372) Variable Indexed LA diameter (cm/m2) Sex (female) Age (y) Active endocarditis Previous cardiac surgery BSA (m2) Chronic lung disease Extracardiac arteriopathy Creatinine clearance (mL/min) Mitral valve disease grade 2+ History of AF History of stroke Coronary artery disease LV dysfunction Mild (45%-54%) Moderate (30%-45%) Severe (<30%) Pulmonary hypertension Moderate (31-55 mm Hg) Severe (>55 mm Hg) Type of AVS (reference valve repair) Mechanical Biological Concomitant mitral valve surgery Concomitant CABG Concomitant surgery on thoracic aorta Arterial hypertension Dyslipidemia Diabetes mellitus. HR. 95% CI. P value. 2.101 0.455 1.052 5.034 1.342 5.675 0.914 1.020 0.999 2.116 2.469 1.331 1.018. 1.167-3.782 0.210-0.983 1.008-1.098 1.231-21.989 0.490-3.675 0.669-48.142 0.377-2.218 0.222-4.678 0.990-1.008 0.943-4.747 0.730-8.352 0.321-1.999 0.420-2.468. 17.025 24.124 37.206. 0-NA 0-NA 0-NA. 0.262 0.007. 0.299-1.388 0.100-0.699. 1.076 1.023 0.333 1.077 1.504 0.871 1.038 0.856. 0.211-5.481 0.219-4.784 0.148-0.750 0.739-2.338 0.760-2.977 0.465-1.632 0.582-1.851 0.401-1.829. .013 .045 .019 .006 .566 .111 .843 .98 .782 .069 .146 .331 .968 .605 .970 .966 .961 .024 .915 .007 .991 .929 .977 .008 .861 .241 .667 .901 .689. HR, Hazard ratio; CI, confidence interval; LA, left atrial; BSA, body surface area; AF, atrial fibrillation; LV, left ventricle; NA, not available; AVS, aortic valve surgery; CABG, coronary artery bypass grafting..
(24) TABLE E9. Demographics, clinical risk factors, and surgical data of the excluded (n = 400) and included (n = 2011) populations Characteristic. Sex (male) Age, y, mean (SD) BMI, mean (SD) BSA, m2, mean (SD) Preoperative anticoagulation with VKAs Arterial hypertension Dyslipidemia Diabetes mellitus Creatinine clearance, mL/min, mean (SD) Chronic lung disease Extracardiac arteriopathy History of atrial fibrillation History of stroke or TIA History of cardiac surgery Coronary artery disease Active endocarditis Predominant aortic valve stenosis Predominant aortic valve regurgitation Moderate or severe mitral valve disease LV dysfunction Normal LVEF (>55%) Mild LV dysfunction (45%-54%) Moderate LV dysfunction (30%-45%) Severe LV dysfunction (<30%) Pulmonary hypertension Normal PAP Moderate (31-55 mm Hg) Severe (>55 mm Hg) Logistic euroSCORE I, mean (SD) Logistic euroSCORE II, mean (SD) Type of AVS Valve repair Biological Mechanical Emergency surgery (<24 h) Concomitant procedure Concomitant mitral valve surgery Concomitant CABG Concomitant surgery on thoracic aorta. Excluded patients (n = 400). Included patients (n = 2011). 238 (59.5%) 69.8 ± 11.1 29.1 ± 4.6 1.8 ± 0.1 40 (10%) 281 (70.2%) 210 (52.5%) 100 (25%) 63.5 ± 25.9 42 (10.5%) 27 (6.7%) 38 (9.5%) 11 (2.7%) 40 (10%) 92 (23%) 12 (3%) 316 (79%) 84 (21%) 96 (24%). 1180 (58.7%) 70.9 ± 10.8 28.7 V 4.4 1.8 ± 0.2 236 (11.7%) 1367 (68%) 1101 (54.7%) 496 (24.7%) 64.1 ± 27.4 174 (8.7%) 127 (6.3%) 236 (11.7%) 90 (4.5%) 181 (9%) 445 (22.1%) 59 (2.9%) 1639 (81.5%) 372 (18.5%) 444 (22.1%). .76 .064 .099 .999 .319 .371 .409 .887 .686 .237 .745 .198 .116 .527 .751 .943 .273. 307 (76.8%) 76 (19%) 14 (3.5%) 3 (0.7%). 1626 (80.9%) 315 (15.7%) 61 (3%) 9 (0.4%). .28. 293 (73.2%) 68 (17%) 39 (9.8%) 8.5 ± 7.5 4.4 ± 4.3. 1519 (75.5%) 359 (17.9%) 133 (6.6%) 8.4 ± 7.4 4.3 ± 4.5. 7 (1.8%) 312 (78%) 81 (20.2%) 14 (3.5%) 165 (41.4%) 45 (11.2%) 79 (19.8%) 47 (11.7%). 53 (2.6%) 1481 (73.6%) 477 (23.7%) 45 (2.2%) 852 (42.4%) 191 (9.5%) 385 (19.1%) 305 (15.2%). P value. .4. .083 .805 .682. .162 .135 .41 .324 .779 .191. SD, Standard deviation; BMI, body mass index; BSA, body surface area; VKA, vitamin K antagonist; TIA, transient ischemic attack; LV, left ventricle; LVEF, left ventricular ejection fraction; PAP, pulmonary artery pressure; euroSCORE, European System for Cardiac Operative Risk Evaluation; AVS, aortic valve surgery; CABG, coronary artery bypass grafting..
(25)
Figure
+7
Documento similar
young and middle-aged men is particularly associated with factors that increase mortality risk. Another further reason could be due to the fact that the younger group of men
CVD – level of mortality due to cardiovascular diseases, HS – level of mortality due to hypertension, MI – level of mortality due to acute myocardial infarction, IHD – level
Thus, the potential for reducing the relative inequalities in premature mortality depends largely on lowering the prevalence of tobacco consumption in the groups with the lowest
Canagliflozin and Renal Outcomes in Type 2 Diabetes and Nephropathy (CREDENCE), Dapagliflozin on Renal Outcomes and Cardiovascular Mortality in Patients with Chronic Kidney
As lym- phopenia is a risk factor for LRTID and mortality in CARV infections in SCT-recipients and SARS-CoV-2 appears to cause or be associated with lymphopenia, patients with
Although recent reviews point out the association between increased sclerostin levels and large carotid intima media thickness, severe vas- cular calcification, and high
Boxplot graphs showing the frequencies of innate and adaptative cell subsets from peripheral blood (blue) and valvular infiltrate (orange). Frequencies were calculated from the
Age-dependent hazard ratios for all-cause mortality for nursing-home residents with no, mild and severe urinary incontinence compared with those without incontinence in the city
