Physiological, neuromuscular and perceived exertion responses in badminton games
10
0
0
Texto completo
(2) International Journal of Racket Sports Science 1 (1). Phomsoupha, M. et al. González-Millán, Salinero, & Abián, 2012). This is close to the values found in tennis where the racket is also held strongly (Ohguni, Aoki, Sato, Imada, & Funane, 2009). Lower-limb power production reveals a mean value about 32 W/kg for national players during a counter-movement jump (Abián-Vicén et al., 2012). Moreover, several actions, like jumping, changing of direction or split stepping necessitate a pre-stretch of the extensor muscles of the lower-limb. For instance, the split step corresponds to a small bounce synchronized with the opponent’s stroke and initiates the movement. This action requires the efficiency of the stretch-shortening cycle (SSC), which could be assessed by measuring the leg stiffness (LS). This variable has been fully highlighted in tennis (Maquirriain, 2013), with values ranged between 20 kN.m-1 to 35 kN.m-1, but has never been recorded during a badminton match, despite a comparable neuromuscular constraints of the lower-limb. These data reveal the high intensity of game, but up to now, few studies have investigated the fatigue state of badminton players during a game. Only one study has compared several physiological and biomechanical variables before and after the match (Abián-Vicén et al., 2012), but only as secondary variables in order to understand the process of dehydration. The psychological cost of fatigue is generally assessed with the ratings of perceived exertion (RPE) (Borg, Ljunggren, & Ceci, 1985) allowing a global view on central fatigue (that related to the stress on the participants’ heart and lungs) and peripheral fatigue (that related to the stress on the limbs and joints). To obtain an accurate assessment of exertion, it seems necessary to process a continued recording of physiological, neuromuscular and psychological variables during a match. Based on this theoretical background, the aim of this paper is: (a) to examine changes in game characteristics, physiological, neuromuscular, and perceived exertion variables during a prolonged badminton game; and (b) to assess the link between these variables and variables derived from a notational and temporal analysis.. Introduction Badminton is an extremely demanding sport that requires changes of direction (Heller, 2010), generates high power for explosive shots, rapid movements (Phomsoupha & Laffaye, 2015) and extended matches (Lees, 2003). Competitive matches last between 40 min (Cabello, Padial, Lees & Rivas, 2004) and one hour (Phomsoupha & Laffaye, 2015), with approximately 80% of rallies lasting less than 10 s (Faude et al., 2007). Several studies have reported on the temporal structure of a match by measuring variables such rally duration (RD, time elapsed from the serve until the shuttle hit the ground or the net), recovery time (RT, time elapsed from the shuttle hit the ground or the net until the racket hit the shuttle for the following serve), effective playing time (EPT, the sum of the rally times divided by the match duration multiplied by a hundred) and shot frequency (SF, the number of shots divided by the effective playing time). A recent review of literature (Phomsoupha & Laffaye, 2015) refer to a typical badminton match as having 7.7 s of RD, 15.4 s of RT, 32.1% of EPT and 1.02 s-1 of SF. Furthermore, the total duration and shot frequency of a badminton game considerably increased since the Olympic Games of 1992, suggesting an increase of the intensity of the game (Laffaye, Phomsoupha, & Dor, 2015). From a physiological point of view, badminton is an intermittent activity with high-intensity short rallies with RT twice the length of the RD, requiring energy from both the aerobic (60-70%) and the anaerobic (30 %) systems. Further, male players’ average maximal heart rate is 191.0 beats/min, which is over 90% of their maximal heart rate (%HRmax) with the maximum blood lactate concentration being around 7.0 mmol/L (Phomsoupha & Laffaye, 2015). To sustain such an intensity and produce powerful shots, players have to produce a high level of force from upper-limb joints in order to hold the racket and to stroke the shuttlecock at high velocity, and from lowerlimb joints to move quickly, to lunge and to jump. Only one study has reported the hand-grip strength of skilled badminton players and this was found to be between 450 and 500 N (Abián-Vicén, Del Coso,. 17.
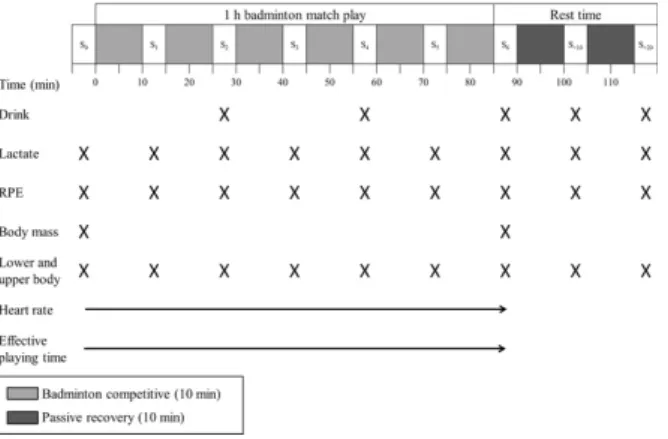
(3) International Journal of Racket Sports Science 1 (1). Phomsoupha, M. et al. (d) SF. The notational structure of each rally was performed on: (e) type of stroke (clear, drop, smash, net and, lob); (f) type of service (short and long); and, (g) way the point was won (direct point, forced error and, unforced error). Physiological variables. To establish blood lactate (BLa) concentration, blood was collected from the fingertip of the arm not holding the racket, using a Lactate Pro portable device (Arkray®, Japan). Heart rate (HR) was registered using short range radio telemetry (RS400; Finland). Vertical jumps. All vertical jumps were recorded using an accelerometric system at a frequency of 500 Hz (Myotest©, Switzerland), in three ways: (a) squat jump (SJ); (b) countermovement jump (CMJ); (c) with rebounds during a hopping-in-place jumping test with five repeated jumps maximizing jump height and reducing ground contact time for optimizing leg stiffness (LS). During each jump, the participants maintained their hands on their hips and perform two jumps. The performance was calculated from flight time by the device (Choukou, Laffaye, & Taiar, 2014). Vertical force and power were assessed from vertical velocity, by calculating the integration of data (Cavagna, 1975). LS was calculated by the formula of Dalleau, Belli, Viale, Lacour, & Bourdin (2004). Hand-Grip (HG) and Finger-Grip Force (FG). The procedure for obtaining maximum HG and FG strength was that recommended by the American Society of Hand Therapists. Subjects were instructed to sit straight back, with the racket arm elbow angle at 90° and the forearm in a neutral position, then apply maximum isometric effort for 3 s to the dynamometer (Camry EH-101©, US). Psychological variables. Each participant was requested to reveal CPE and PPE according to the 6-20 Borg scale every 10 min (Borg et al., 1985). CPE was related to the stress on the participants’ heart and lungs while PPE concerned the stress on the limbs and joints.. Material and Methods Participants Twelve male elite single players (age: 25.34 ± 3.22 years; height: 179.43 ± 4.21 cm; body mass: 79.76 ± 12.48 kg; body fat: 17.12 ± 6.33%; muscle composition: 42.72 ± 2.18%; training practice: 7.18 ± 3.23 hours/week) with international and national experience participated in this study. They were fully informed about the protocol before participating in this study and they signed an informed consent form. Ethical approval was granted by the university Human Ethics Committee and followed principles of the Declaration of Helsinki.. Design & Procedures The match was a one-hour simulated badminton match. Players were permitted an interval of no more than 10 s between each rally during the game. The experimentation was conducted with brief breaks to collect and record blood samples, jumps and RPE every 10 min, and at 10 and 20 min after (Figure 1). A camera was also placed at back of the court to record the entire match as described by Laffaye et al. (2015). One week before, a shuttle run test (Leger & Lambert, 1982) was conducted to determine maximum oxygen uptake (57.44 ± 5.35 mL/kg/min) and maximum heart rate (187.76 ± 5.14 beats/min).. Figure 1. Experimental Set-up.. Statistical Analysis The statistical design was a repeated measure analysis of variance on the recorded variables. Statistical significance was accepted at p < 0.05 and was followed by up with post-hoc comparisons. Game characteristic variables. The temporal pattern of the game was recorded with a video camera (HDRXR260VE; Japan). Based on this recording, an investigator collected: (a) RD ; (b) RT; (c) EPT; and,. 18.
(4) International Journal of Racket Sports Science 1 (1). Phomsoupha, M. et al.. between each session using Bonferroni adjustments as appropriate and power (β). Eta squared (ηp) were used to determine the effect sizes. Lastly, Spearman’s correlation coefficients were calculated to determine the relationships between selected variables (Statistica 10 software, StatSoft Inc., Tulsa, US).. P = 0.059; ηp = 0.016), whereas RT increased by +9% (F5, 1220 = 0.0372, P = 0.864; ηp = 0.058) and SF decreased with service (-7%, F5, 1220 = 7.473, P < 0.001; ηp = 0.153) and without service (-9%, F5, 1220 = 3.701, P = 0.012). A strong correlation was found between RD and RT (r = 0.742; P < 0.001), a moderate correlation between SF and RD (r = 0.504; P < 0.001) and a strong and negative correlation between RT and SF (r = -0.881; P < 0.001). The distributions of each stroke were insignificant (Table 1). There was a strong correlation between SF and HR (r = 0.884; P < 0.001).. Results Mean RD, RT and, EPT were 5.81 ± 0.32 s, 8.04 ± 0.35 s and 41.54 ± 1.43%, respectively. No effect was found on the game characteristics of RD (F5, 1220 = 0.893, P = 0.485; ηp = 0.029) nor EPT (F5, 25 = 2.247,. Table 1. Temporal and notational variables during each test session at S1: 10th min; S2: 20th min; S3: 30th min; S4: 40th min; S5: 50th min and S6: 60th min of badminton playing exercises.. Measure Duration of rallies (s) Recovery time (s). S1 M ± SD 5.80 ± 0.25 7.68 ± 0.24 5 ; 6. S2 M ± SD 6.28 ± 0.36 7.82 ± 0.26 5 ; 6. S3 M ± SD 5.98 ± 0.28 7.81 ± 0.22 5 ; 6. S4 M ± SD 5.91 ± 0.38 8.03 ± 0.26. S5 M ± SD 5.56 ± 0.26 8.31 ± 0.17 1 ; 2 ;. S6 M ± SD 5.53 ± 0.27 8.43 ± 0.37 1 ; 2 ; 3. P 0.484. β 0.323. ηp 0.171. 0.003. 0.942. 0.487. 0.059. 0.676. 0.331. < 0.001. 0.999. 0.651. 0.012. 0.863. 0.425. 0.0732. 0.134. 0.0471. 0.152. 0.263. 0.518. 0.102. 0.175. 3. Effective playing time (s) Stroke frequency with service (s-1) Stroke frequency without service (s-1) Clear (%). 251.83 ± 6.18 1.06 ± 0.04 3 ; 4 ; 5. 258.83 ± 7.42 1.03 ± 0.05 5 ; 6. ;6. 1.03 ± 0.02 5 ; 6. 253.34 ± 7.76 1.02 ± 0.06 1 ; 5 ;. 251.66 ± 7.72 1.01 ± 0.04 1. 6. 1.01 ± 0.05 5 ; 6. 1.01 ± 0.08 5 ; 6. 1.00 ± 0.07 6. 236.51 ± 5.91 0.99 ± 0.04 1 ; 2 ;. 241.53 ± 6.58 0.97 ± 0.02 1 ; 2 ; 3. 3. ;4. 0.97 ± 0.08 1 ; 2 ;. 0.96 ± 0.08 1 ; 2 ; 3. 3. ;4. 16.43 ± 17.72 ± 16.32 ± 18.02 ± 17.74 ± 16.63 ± 0.857 0.21 0.96 0.65 0.81 1.26 0.51 Drop (%) 15.34 ± 16.91 ± 15.96 ± 16.81 ± 16.77 ± 16.10 ± 0.794 0.61 1.43 2.47 2.32 1.68 1.83 Smash (%) 15.95 ± 14.20 ± 14.02 ± 14.81 ± 14.49 ± 17.14 ± 0.654 0.46 0.81 0.74 0.71 0.64 0.67 Net (%) 27.63 ± 26.54 ± 29.51 ± 27.94 ± 27.71 ± 28.59 ± 0.728 0.23 1.08 0.93 1.16 1.13 0.84 Values are mean and standard deviation. Significant difference at the post hoc test with n.. 19.
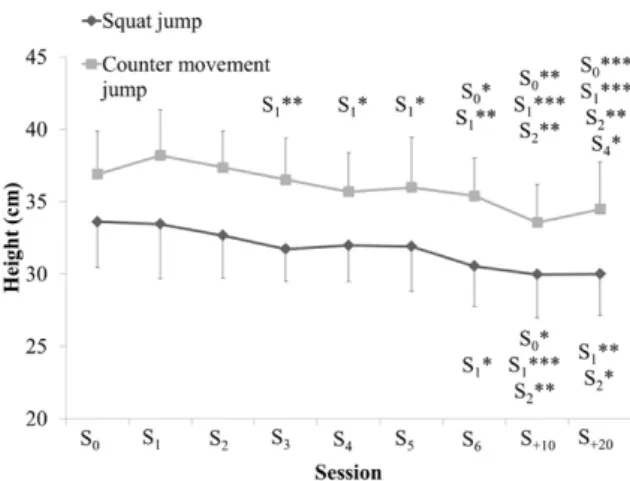
(5) International Journal of Racket Sports Science 1 (1). Phomsoupha, M. et al.. During the match, the mean HR was 168.3 ± 13.2 beats/min, corresponding to 85%HRmax. Blood lactate increased from an initial value of 1.62 ± 0.43 mmol/l to 6.87 ± 6.33 after 10 min of play (F8, 88 = 3.904, P < 0.001; ηp = 0.262), showing a slow decline after session 2 (figure 2).. Figure 3. Squat and countermovement jump height recorded after each badminton session. Values are mean and standard deviation. A significant difference at the post hoc test with S0 is indicated by *: P < 0.05; **: P < 0.01; ***: P < 0.001. FG strength did not change (F8, 88 = 1.006; P = 0.439) whereas HG strength showed a decrease (-15%, F8, 88 = 3.337; P = 0.002; ηp = 0.233) (figure 4), especially after 60 minutes of the game. There was a strong correlation between FG and HG strength (r = 0.877; P < 0.001). The CPE increases (F8, 88 = 30.480; P < 0.001; ηp = 0.813) and PPE (F8, 88 = 17.367; P < 0.001; ηp = 0.713) during the entire match (figure 5).. Figure 2. Blood lactate concentration recorded after each badminton session. Values are mean and standard deviation. A significant difference at the post hoc test with S0 is indicated by *: P < 0.05; **: P < 0.01; ***: P < 0.001. Height decreased in both SJ (-13% , F8, 88 = 3.0281, P < 0.001; ηp = 0.226) and CMJ (-12% , F8, 88 = 2.609, P = 0.014; ηp = 0.224) (figure 3). Mean height in SJ was lower than CMJ (P < 0.001, 31.82 v 36.03 cm respectively). The peak power in SJ decreased (-5.87%, F8, 88 = 2.379, P = 0.024; ηp = 0.209) and CMJ as well (-3.34%, F8, 88 = 3.679, P < 0.001; ηp = 0.290). Moreover, the mean values of relative peak power revealed a higher (P < 0.001) value during CMJ (47.21 W/kg) than during SJ (43.73 W/kg). There was a link between the power decrease in SJ and CMJ (r = 0.872, P < 0.001). LS showed an insignificant decrease, despite a -10% loss (F8, 88 = 0.556; P = 0.808).. Figure 4. Hand- and finger-grip strength recorded after each badminton session. Values are mean and standard deviation. A significant difference at the post hoc test with S0 is indicated by *: P < 0.05; **: P < 0.01; ***: P < 0.001.. 20.
(6) International Journal of Racket Sports Science 1 (1). Phomsoupha, M. et al. shuttlecock is kept in the air, and ranges from 0.92 s-1 (Faude et al., 2007) to 1.3 s-1 during the 2012 Olympics final (Laffaye et al., 2015). The link between SF and RT could reveal that a rally with high SF is the consequence of a high-intensity action of high muscular constraints and requires a longer RT. The mean value of SF is ~1.0 s-1, which is close to the value (1.021 s-1) found in elite players by Phomsoupha & Laffaye (2015). The kinds of stroke used and the distribution in the way the point is won were similar in all sessions, meaning that the players continued to use the same tactics regardless of the fatigue. The only variable that decreased with fatigue was SF (-7%). In our study, the value decreased significantly from 1.06 to 0.97 s-1, suggesting that the fatigue induced by the game impacted negatively on SF. Indeed, SF depends on either a change in the choice of serve or an increase in the duration of shuttlecock flight. To assess the impact on the serve on SF, we performed a complementary analysis by removing the serve from the recorded data. SF decreased in the same way from 1.03 to 0.96 s-1 (-9.3%), revealing that if the long serve is overused at the end of the match to gain about 1.5 s at each serve, it is not the main explanation of the SF decrease. So, this could be explained by two factors: a higher shuttlecock trajectory, and a decrease in shuttlecock velocity, suggesting that the game characteristics of badminton strongly impact the energy required. The large number of powerful movements such as clears and smashes (n = 1246 and n = 925 respectively) increases the energy cost dramatically.. Figure 5. Central (CPE) and peripheral (PPE) perceived exertion rating recorded after each badminton session. Values are mean and standard deviation. A significant difference at the post hoc test with S0 is indicated by *: P < 0.05; **: P < 0.01; ***: P < 0.001. A polynomial function is used for each R2.. Discussion Game characteristics The temporal characteristics in our experiment are in line with knowledge on the intermittent nature of the exercise performed (Wonisch, Hofmann, Schwaberger, von Duvillard, & Klein, 2003). Indeed, mean RD is about 7.6 s (Phomsoupha & Laffaye, 2015). However, RT (~8 s) is only half that measured during real matches (~15 s) and consequently, EPT (42%) was longer than reported in the literature with an average value of about 32.1%. This could be easily be explained by the advice given to the players to take as little RT as possible in order to fatigue their opponent. Despite this advice, the way RT was kept low was affected by the duration of the previous rally as revealed by the correlation (r = 0.554). Such a link between RD and RT has been previously observed with values ranging from r = 0.38 during the Olympics men's singles final (Laffaye et al., 2015) to r = 0.87 (Cabello & González-Badillo, 2003) during an international tournament, revealing the need to handle the metabolic and cardio-respiratory variables under relative fatigue threshold before engaging a new rally. The surprising result is the high correlation between RT and SF (r = -0.881), showing that the time needed to rest was related more to the intensity of the rally than the duration. SF depends on the time the. Physiological responses Temporal characteristics showed that repeated highintensity short rallies (5.8 ± 0.3 s) with numerous recovery periods (8.0 ± 0.3 s) lead to substantial mean BLa concentrations of 5.7 ± 0.8 mmol/l with concomitant high HR values (168.6 ± 12.2 beats/min). This is in line with the literature with mean value of 4.4 mmol/l for BLa concentration and about 170-180 beats/min for average HR (Phomsoupha & Laffaye, 2015). This corresponds to about 85%HRmax, which is slightly lower than values found in the literature, which is often over 90%HRmax (Phomsoupha & Laffaye,. 21.
(7) International Journal of Racket Sports Science 1 (1). Phomsoupha, M. et al.. 2015) in real conditions. Interestingly, the results indicated high heart rate values (~85%HRmax) throughout match play, probably induce the players’ endurance capacities (57.4 ± 5.3 ml/kg/min), which may contribute to efficient BLa removal (Messonnier et al., 2001), faster reoxygenation of myoglobin, and, greater resynthesis of muscle phosphorylcreatine (Tomlin & Wenger, 2001). These physiological adaptations help to conserve the performance with muscle fatigue. In addition, the positive relationship between HR and SF values (r = 0.884) supports the hypothesis that the ability to regenerate phosphorylcreatine depends on oxidative processes and would be the main mechanisms maintaining neuromuscular performance. Lower-limb neuromuscular responses The peak power values found during SJ and CMJ (45.1 and 48.8 W/kg, respectively) are comparable to those found in a prolonged tennis match (Girard, Lattier, Micallef, & Millet, 2006) with 44.4 and 45.4 W/kg for SJ and CMJ respectively, but are higher than those found in a badminton match with elite players (about 30 W/kg) (Abián-Vicén et al., 2012). This difference could be explained by the methodological approaches, with the present study using the same formula and device as Girard et al. (2006) which overestimates the values when compared with a force plate, which was used in the study by Abián-Vicén et al. (2012). CMJ jump heights (~36 cm) is slightly lower than those found in national Spanish players (~39 cm in CMJ), probably due to the use of the arm movement in the aforementioned study. Moreover, SJ and CMJ power decreases during the game (-5.87% and -3.34%, respectively). This decrease could be explained by a high number of jumps (n = 925) and eccentric movements to the net (n = 3170), which could induce damage in the muscular structure (Cress, Peters, & Chandler, 1992). In contrast, AbiánVicén et al. (2012) did not find a significant decrease in the lower-limb force production during a 35 min of play whereas it lasted one hour in the present study. This suggests that muscle fatigue in the intermittent effort pattern of a badminton match occurs after ~50 minutes of play, which often happens, as shown from the analysis of the SuperSeries between 2007 and 2014.. Indeed, 39% of all the matches exceed 45 min in men’s single. This could be explained by the short RT between rallies (~8 s), which seems insufficient to recover adenosine triphosphate (ATP) and phosphocreatine (Glaister, 2005). Indeed, RT is a major determinant of high-intensity intermittent exercise to limit fatigue. Explosive lower-limb strength is not affected by a prolonged tennis game, in which the recovery duration between points represents 79% of the total duration (Girard et al., 2006), whereas it is affected in badminton with a 59% recovery duration in the present study. This suggests the key role of RT on ATP and phosphocreatine recovery. Concerning LS, the mean value found at the beginning of the experimentation (60.8 kN/m) was higher than those found in the tennis literature, with values ranging from 18.2 kN/m to 34.8 kN/m in heterogeneous samples (Maquirriain, 2013). Part of the difference could be explained by the method used to measure stiffness; the other studies used either a force plate or ergo jump and Myotest systems have been shown to slightly overestimate (by about +8 kN/m) the LS value (Choukou et al., 2014). This high value may be explained by the increasing number of jump smashes, which solicits high visco-elastic properties of the lower-limb muscles; as well as the split step, which allows badminton players to behave like a spring by bouncing before moving in a chosen direction. Furthermore, to perform powerful strokes, kinematic analysis reveals that elite players use jumps to increase shuttlecock velocity (Cohen, DarboisTexier, Quéré, & Clanet, 2015). This suggests that players adapt their spit step to receive shuttlecock at high velocity by reducing ground contact time and increasing LS. LS remained unchanged with fatigue until the end of the match, despite a slight insignificant decrease (10%). Such an insignificant decrease with fatigue has been noticed previously during sprint repetition (Choukou, Laffaye, & Heugas-De Panafieu, 2012) and prolonged tennis matches (Girard et al., 2006). The correlation observed between the decline in SJ and CMJ power with LS (r = 0.782 and r = 0.613, respectively) reveals that the ability to maintain a high level of force and power output is regulated by LS. This was. 22.
(8) International Journal of Racket Sports Science 1 (1). Phomsoupha, M. et al.. previously considered as neuromuscular adaptation to fatigue (Choukou et al., 2012). The insignificant decrease in LS in correlation with a significant decreased in lower-limb power suggests that the central nervous systems modified the control pattern to maintain constant stiffness as previously shown in various motor tasks such as repeated sprint (Choukou et al., 2012) and to regulate movement reorganization under fatigue. Leg properties can be modified by stiffness regulation during SSC tasks, whereas the high number of motor units required jumping high during a SJ or a CMJ declines with fatigue.. the elbow due to repetitive high-velocity arm movements (Kafkas et al., 2014) or the high number of maximal isometric contractions during powerful strokes (≈2171 representing 30.4% of strokes). This decrease in isometric strength could impact negatively on the way the racket is squeezed and consequently the hitting force (Kibler, Wilkes, & Sciascia, 2013). Shuttlecock velocity probably decreases and could be a plausible explanation for the decrease in SF. Indeed, we found a moderate but insignificant correlation between HG and SF decrease (r = 0.543), suggesting that the ability to squeeze the racket contributes moderately to stroke efficiency.. Upper-limb neuromuscular responses. RPE response. The value in our study of 44.2 ± 9.3 kg is close to that found in the study of Abián-Vicén et al. (2012) in male badminton (about 47 kg) and tennis players (between 46.5 and 61 kg) (Kafkas, Şahin Kafkas, Durmus, & Açak, 2014). This tends to prove that a threshold of grip strength is necessary to squeeze the racket using an isometric contraction during the stroke. During the game, the player has to squeeze the racket strongly for clears and smashes (≈2171 times). During the match, HG strength increases to its maximal value after 10 minutes and decreases by 44.5% throughout the match. In the study of AbiánVicén et al. (2012), HG value showed no difference before and after the game. This difference could be explained by two reasons. Firstly, the first test was done before the match, which is not the highest value measured during the match. Indeed, the best value occurs 10 minutes after the beginning of the match and not before it. This curious phenomenon could be explained by insufficient warm-up (Girard et al., 2006) or an increase in muscle temperature through an increased transmission rate of nerve impulses and decreased viscous resistance (Bishop, 2003). Secondly, our match lasted one hour, whereas in the previous study, the match was played under official conditions, which means the match duration was 35 min in men’s singles. HG strength decreased after 50 min. This suggests that players are able to maintain a high level of isometric strength for the duration of a classic match time pattern of less than 35 min. This decrease could be explained by either pain on the lateral epicondyle of. Changes in RPE during a badminton match have never been investigated. CPE and PPE gradually increase throughout the match, whereas HR remains stable at high intensity. Such a dissociation has been observed previously during a prolonged tennis match (Girard et al., 2006), suggesting that cardiovascular stress is not the only contributor to RPE. Millet and Lepers (2004) suggest that the exercise induced muscle damage, and that eccentric contractions in particular contribute to RPE increase due to high leg muscle soreness. Indeed, studies have suggested that local muscle soreness due to eccentric contractions induce a stimulatory effect on ventilation increasing the perceived exertion (Davies, Rowlands, & Eston, 2009). The intense braking phase of the dominant leg during the net stroke can increase stress on the Achilles tendon by up to 6-12 times the player’s body weight (Lee & Yoo, 2012) and up to five times for the knee patellar tendon (~3170 times during the game). Another explanation for the increase in RPE despite a constant HR value is related to a high level of mental resources used for self-regulation (self-control) affect (Muraven & Baumeister, 2000). Implementation of high skilled cognitive activity such as optimal game tactics combined with high energy expenditure probably induced a significant level of self-control which can be defined by the way people regulate their thoughts, behaviour, negative affect and perception like fatigue (Muraven & Baumeister, 2000). Moreover, self-control has limited resources and is. 23.
(9) International Journal of Racket Sports Science 1 (1). Phomsoupha, M. et al.. impaired by prior exertion reducing the capability for further self-control strain (Baumeister, Bratslavsky, Muraven, & Tice, 1998). By this way, the combination of cognitive and energetic demand through a match very probably impaired these limited mental resources and created difficulties to inhibit perceived exertion during the match. This impairment also known as egodepletion state is very likely involved in the RPE augmentation along the match. Prolonged periods of demanding cognitive activity also probably produced mental fatigue (MF) to the player (Marcora, Staiano, & Manning, 2009). During the match, MF increased and stroke production appeared much more difficult. MF influenced the perception of physical fatigue and should modify the perception of RPE throughout the match. Therefore, PPE and CPE increased while HR and neuromuscular variables remained unchanged.. Borg, G., Ljunggren, G., & Ceci, R. (1985). The increase of perceived exertion, aches and pain in the legs, heart rate and blood lactate during exercise on a bicycle ergometer. European Journal of Applied Physiology and Occupational Physiology, 54(4), 343–349. Cabello, D., Padial, P., Lees, A., & Rivas, F. (2004). Temporal and physiological characteristics of elite women’s and men’s singles badminton. International Journal of Applied Sports Sciences, 16(2), 1–26. Cabello, M. D., & González-Badillo, J. J. (2003). Analysis of the characteristics of competitive badminton. British Journal of Sports Medicine, 37(1), 62– 66. Cavagna, G. A. (1975). Force platforms as ergometers. Journal of Applied Physiology, 39(1), 174– 179. Choukou, M. A., Laffaye, G., & Heugas-De Panafieu, A. M. (2012). Sprinter’s motor signature does not change with fatigue. European Journal of Applied Physiology, 112(4), 1557–1568. Choukou, M. A., Laffaye, G., & Taiar, R. (2014). Reliability and validity of an accelerometric system for jumping performance. Biology of Sport, 31(1), 55–62. Cohen, C., Darbois-Texier, B., Quéré, D., & Clanet, C. (2015). The physics of badminton. New Journal of Physics, 17(6), 1–17. Cress, N. M., Peters, K. S., & Chandler, J. M. (1992). Eccentric and concentric force-velocity relationships of the quadriceps femoris muscle. Journal of Orthopaedic & Sports Physical Therapy, 16(2), 82–86. Dalleau, G., Belli, A., Viale, F., Lacour, J. R., & Bourdin, M. (2004). A simple method for field measurements of leg stiffness in hopping. International Journal of Sports Medicine, 25(3), 170–176. Davies, R. C., Rowlands, A. V, & Eston, R. G. (2009). Effect of exercise-induced muscle damage on ventilatory and perceived exertion responses to moderate and severe intensity cycle exercise. European Journal of Applied Physiology, 107(1), 9–11. Faude, O., Meyer, T., Rosenberger, F., Fries, M., Huber, G., & Kindermann, W. (2007). Physiological characteristics of badminton match play. European Journal of Applied Physiology, 100(4), 479–485. Girard, O., Lattier, G., Micallef, J. P., & Millet, G. P. (2006). Changes in exercise characteristics, maximal. Conclusions Players have a capacity to conserve a high intensity of performance despite a general fatigue state during 50 min before it declined. The metabolic fatigue is impacted more by the intensity of the stroke than the duration of the rallies. The rate of perceived exertion seems to be a combination of attentional and neuromuscular fatigue rather than metabolic fatigue. Consequently, in future studies, both researchers and trainers should consider the fatigue state as a means to increase players’ abilities.. References Abián-Vicén, J., Del Coso, J., González-Millán, C., Salinero, J. J., & Abián, P. (2012). Analysis of dehydration and strength in elite badminton players. PloS One, 7(5), 1–8. Baumeister, R. F., Bratslavsky, E., Muraven, M., & Tice, D. M. (1998). Ego depletion: is the active self a limited resource? Journal of Personallty and Social Psychology, 74(5), 1252–1265. Bishop, D. (2003). Warm up I: potential mechanisms and the effects of passive warm up on exercise performance. Sports Medicine, 33(6), 439–454.. 24.
(10) International Journal of Racket Sports Science 1 (1). Phomsoupha, M. et al.. voluntary contraction, and explosive strength during prolonged tennis playing. British Journal of Sports Medicine, 40(6), 521–526. Glaister, M. (2005). Multiple sprint work : physiological responses, mechanisms of fatigue and the influence of aerobic fitness. Sports Medicine, 35(9), 757– 777. Heller, J. (2010). Physiological profiles of elite badminton players aspects of age and gender. British Journal of Sports Medicine, 44(i17), 1–13. Kafkas, M. E., Şahin Kafkas, A., Durmus, B., & Açak, M. (2014). Effects of a tennis tournament on players’ hand grip strength, pressure pain threshold and visual analogue scale. Medicina Dello Sport, 67(4), 569–579. Kibler, W. B., Wilkes, T., & Sciascia, A. (2013). Mechanics and pathomechanics in the overhead athlete. Clinical Journal of Sport Medicine, 32(4), 637– 651. Laffaye, G., Phomsoupha, M., & Dor, F. (2015). Changes in the game characteristics of a badminton match: a longitudinal study through the Olympic Game finals analysis in men’s singles. Journal of Sports Science and Medicine, 14, 584–590. Lee, J. H., & Yoo, W. G. (2012). Treatment of chronic Achilles tendon pain by Kinesio taping in an amateur badminton player. Physical Therapy in Sport, 13(2), 115–119. Lees, A. (2003). Science and the major racket sports: a review. Journal of Sports Sciences, 21(9), 707–732. Leger, L., & Lambert, J. (1982). The multistage 20 m shuttle run test for aerobic fitness. Journal os Sports Sciences, 6, 93-101. Maquirriain, J. (2013). The interaction between the tennis court and the player: how does surface affect leg stiffness? Sports Biomechanics, 12(1), 48–53. Marcora, S. M., Staiano, W., & Manning, V. (2009). Mental fatigue impairs physical performance in humans. Journal of Applied Physiology, 106(3), 857–864. Messonnier, L., Freund, H., Féasson, L., Prieur, F., Castells, J., Denis, C., … Lacour, J. R. (2001). Blood lactate exchange and removal abilities after relative high-intensity exercise: effects of training in normoxia and hypoxia. European Journal of Applied Physiology, 84(5), 403–412.. Millet, G. Y., & Lepers, R. (2004). Alterations of neuromuscular function after prolonged running, cycling and skiing exercises. Sports Medicine, 34(2), 105–116. Muraven, M., & Baumeister, R. F. (2000). Selfregulation and depletion of limited resources: does self-control resemble a muscle? Psychological Bulletin, 126(2), 247–259. Ohguni, M., Aoki, M., Sato, H., Imada, K., & Funane, S. (2009). The effect of grip size on the hitting force during a soft tennis forehand stroke. The American Orthopaedic Society for Sports Medicine, 1(4), 321–325. Phomsoupha, M., & Laffaye, G. (2015). The science of badminton: game characteristics, anthropometry, physiology, visual fitness and biomechanics. Sports Medicine, 45(4), 473–495. Tomlin, D. L., & Wenger, H. A. (2001). The relationship between aerobic fitness and recovery from high intensity intermittent exercise. Sports Medicine, 31(1), 1–11. Wonisch, M., Hofmann, P., Schwaberger, G., von Duvillard, S. P., & Klein, W. (2003). Validation of a field test for the non-invasive determination of badminton specific aerobic performance. British Journal of Sports Medicine, 37(2), 115–118.. Acknowledgements, funding or conflicts of interests We thank Frédéric Dor for precious help for the duration time of different matches’ frequency during SuperSeries 2007 to 2014 for all categories.. 25.
(11)
Figure
Documento similar
In comparison with demand games (see Mitzkewitz and Nagel, 1993), payoffs in the blind-offer games are of course lower for pies 2, 4, and 6, since in demand games the proposers ask
As compared to high metallicity disc H II regions, CNSFR show values of the O 23 and the N2 parameters whose distributions are shifted to lower and higher values, respectively,
For a short explanation of why the committee made these recommendations and how they might affect practice, see the rationale and impact section on identifying children and young
The expansionary monetary policy measures have had a negative impact on net interest margins both via the reduction in interest rates and –less powerfully- the flattening of the
Jointly estimate this entry game with several outcome equations (fees/rates, credit limits) for bank accounts, credit cards and lines of credit. Use simulation methods to
In our sample, 2890 deals were issued by less reputable underwriters (i.e. a weighted syndication underwriting reputation share below the share of the 7 th largest underwriter
Ozone treatments only increased leaf K concentration, did not change the total nitrogen and phosphorus extracted by plants, but decreased the total potassium extracted.. In
Acute supplementation with 6 mg·kg -1 of caffeine improved perfor- mance in a Wingate test (i.e., W peak , T_W peak and W mean ), and in- creased pre-exercise jump ability
