TítuloMathematical modeling and numerical simulation of tumor angiogenesis
276
0
0
Texto completo
(2) II.
(3) Abstract. Cancer is nowadays the second leading cause of death in the world. Cancer starts with a single cell that has accumulated several mutations usually over a long period of time. One of the main characteristics of this cell is its ability to replicate unbounded producing, in most occasions, a mass of densely packed daughter cells that form a solid tumor. Cancerous cells depend on nutrients and oxygen supplied by pre-existent blood vessels to proliferate. This supply is not enough to maintain the growth and most tumors remain small and benign due to this constraint. Occasionally, however, some cells develop the ability to promote the growth of new capillaries towards them. This process is called tumor-induced angiogenesis and through it tumors acquire a constant supply of nutrients and oxygen and access to the whole body through the circulatory system. Tumors that are able to trigger angiogenesis become malignant as they can grow unbounded and metastasize. Malignant tumors can grow large enough to damage the functionality of the host organ and, eventually, lead to death. A few decades ago, scientists have proposed that blocking angiogenesis could be an effective treatment against cancer. This therapy, known as antiangiogenic therapy, has shown promising results in pre-clinical trials, but has not translated into the expected results in the clinic. A new emerging paradigm in Medicine, namely, Predictive Medicine, is expected to change the Oncology field and may be the tool to understand the problems with this therapy. Predictive Medicine is based on mathematical modeling and computation and has been so far successfully applied to several areas of Medicine. In the Oncology field it has only been started, but has already produced sound advances. In particular, in tumor-induced angiogenesis numerous researchers have proposed mathematical models to address the problem of antiangiogenic therapies, although there is still a need for improvement to attain this goal. Angiogenesis is a complex multiscale process that involves several key mechanisms, many of them not yet accounted for in the models. In addition, most III.
(4) models are simulated in two-dimensional simple geometries, while angiogenesis is a three-dimensional process and occurs in tissues with non-trivial geometries. In this thesis we develop mathematical models of tumor-induced angiogenesis that include key biological mechanisms and we simulate these models in relevant experimental setups and in three-dimensional, subject-specific geometries. To achieve our modeling and simulation goals, we develop adequate numerical algorithms. Every model in this thesis is hybrid and involves coupling averaged continuous theories and cellular-scale discrete agents. In addition, the models are grounded on the phase-field method which requires solving higher-order partial differential equations. To overcome these problems we developed a seamless coupling between the continuous variables and the discrete elements to permit an efficient numerical treatment of the coupled problem. For the resolution of the high-order partial differential equations involved in the formulation we used isogeometric analysis, which in addition provides accuracy, robustness, and the geometric flexibility that we require to perform simulations in real geometries. This manuscript presents three new mathematical models for tumor-induced angiogenesis. In the first one we started with a previous model to which we added a conceptual model for haptotaxis, one of the main mechanisms that governs capillary growth. The extended model permitted us to assess the role of haptotaxis in tumor angiogenesis. Furthermore, we developed for the first time a simulation of one of the most widely used in vivo assays, the mouse corneal micropocket angiogenesis assay, using a three-dimensional, subject-specific geometry. The results are in agreement with the experiments and predict well-known vascular structures in three dimensions. In addition, they suggest that, for mathematical models to achieve the topological complexity observed in in vivo angiogenesis experiments, two-dimensional simulations may not be enough. The second model focuses on the long-term dynamics of tumor-induced angiogenesis, that is, on the regression and regrowth events occurring after the first growth of blood vessels. The model was simulated both in a two-dimensional replication of the mouse corneal micropocket assay and in a reproduction of an in vivo experimental setup. Our simulations predict plasticity and dynamic evolution of angiogenesis at long time spans and are in quantitative agreement with experiments. Finally, we developed a fully continuum theory for fluid flow at the tissue scale, which we coupled with our model for tumor angiogenesis. The model shows how fluid flow alters tumor-induced vascular patterns through convection, which has been overlooked in mathematical modeling. Our model predicts a substantial impact of convection in angiogenesis and an increased malignancy of small solid tumors. IV.
(5) Contents. Abstract . . . . Contents . . . . List of figures . List of tables . List of symbols. . . . . .. . . . . .. . . . . .. . . . . .. . . . . .. . . . . .. . . . . .. . . . . .. . . . . .. . . . . .. . . . . .. . . . . .. . . . . .. . . . . .. . . . . .. . . . . .. . . . . .. 1 Introduction 1.1 Motivation and research objective . . . . . . . . . . . . . . . 1.2 Context . . . . . . . . . . . . . . . . . . . . . . . . . . . . . 1.2.1 Biology background . . . . . . . . . . . . . . . . . . 1.2.2 Mathematical models of tumor-induced angiogenesis 1.2.3 Isogeometric analysis . . . . . . . . . . . . . . . . . . 1.3 Thesis overview . . . . . . . . . . . . . . . . . . . . . . . . .. . . . . . .. . . . . . .. . . . . . .. 1 . 1 . 9 . 9 . 28 . 39 . 46. 2 A mathematical model of tumor-induced angiogenesis 2.1 Introduction . . . . . . . . . . . . . . . . . . . . . . . . . 2.2 The tumor angiogenesis model . . . . . . . . . . . . . . 2.2.1 The spatial domain of the continuous problem . 2.2.2 The spatial domain of the discrete model . . . . 2.2.3 The coupled discrete/continuous model . . . . . 2.2.4 The discrete component . . . . . . . . . . . . . . 2.2.5 The boundary value problem . . . . . . . . . . . 2.2.6 Parameters . . . . . . . . . . . . . . . . . . . . . 2.3 Numerical method . . . . . . . . . . . . . . . . . . . . . 2.3.1 The discrete component . . . . . . . . . . . . . . 2.3.2 The continuous equations . . . . . . . . . . . . . 2.3.3 Code development and implementation . . . . .. . . . . . . . . . . . .. . . . . . . . . . . . .. . . . . . . . . . . . .. . . . . . . . . . . . .. V. . . . . .. . . . . .. . . . . .. . . . . .. . . . . .. . . . . .. . . . . .. . . . . .. . . . . .. . . . . .. . . . . .. . . . . .. . . . . .. . . . . .. . . . . .. . . . . . . . . . . . .. . . . . . . . . . . . .. III V IX XIII XV. 47 47 49 50 50 52 53 55 56 57 57 60 65.
(6) 2.4. 2.5 2.6. Results and discussion . . . . . . . . . . . . . . . . . . . . . . . . . 2.4.1 Numerical example . . . . . . . . . . . . . . . . . . . . . . . 2.4.2 Parametric study of the model . . . . . . . . . . . . . . . . 2.4.3 Influence of the hypoxic cell distribution and initial capillaries Conclusions . . . . . . . . . . . . . . . . . . . . . . . . . . . . . . . Supporting information . . . . . . . . . . . . . . . . . . . . . . . .. 3 Tip endothelial cells guided by chemotatic and 3.1 Haptotaxis . . . . . . . . . . . . . . . . . . . . 3.2 The mathematical model . . . . . . . . . . . . . 3.2.1 The continuous problem . . . . . . . . . 3.2.2 The discrete agents . . . . . . . . . . . . 3.2.3 The continuum/discrete coupling . . . . 3.2.4 Parameters . . . . . . . . . . . . . . . . 3.3 Numerical method . . . . . . . . . . . . . . . . 3.3.1 The tip endothelial cell motion . . . . . 3.3.2 The coupling methodology . . . . . . . . 3.3.3 The continuous equations . . . . . . . . 3.4 Results and discussion . . . . . . . . . . . . . . 3.5 Conclusions . . . . . . . . . . . . . . . . . . . . 3.6 Supporting information . . . . . . . . . . . . .. haptotactic . . . . . . . . . . . . . . . . . . . . . . . . . . . . . . . . . . . . . . . . . . . . . . . . . . . . . . . . . . . . . . . . . . . . . . . . . . . . . . . . . . . . . . . . . . . . . . . . . . . . . . . .. cues . . . . . . . . . . . . . . . . . . . . . . . . . . . . . . . . . . . . . . .. 68 69 70 74 76 78 79 79 81 81 82 86 86 87 88 89 90 91 99 99. 4 Mouse corneal micropocket angiogenesis assay 101 4.1 The assay . . . . . . . . . . . . . . . . . . . . . . . . . . . . . . . . 102 4.2 Three-dimensional angiogenesis . . . . . . . . . . . . . . . . . . . . 106 4.2.1 Angiogenesis triggered by a cluster of hypoxic cells . . . . . 106 4.2.2 Angiogenesis triggered by randomly distributed hypoxic cells110 4.2.3 Importance of haptotaxis . . . . . . . . . . . . . . . . . . . 111 4.2.4 Discussion . . . . . . . . . . . . . . . . . . . . . . . . . . . . 113 4.3 Subject-specific computational mesh . . . . . . . . . . . . . . . . . 113 4.3.1 The geometry . . . . . . . . . . . . . . . . . . . . . . . . . . 113 4.3.2 The mesh . . . . . . . . . . . . . . . . . . . . . . . . . . . . 114 4.4 Angiogenesis in the mouse cornea . . . . . . . . . . . . . . . . . . . 117 4.4.1 Numerical tests . . . . . . . . . . . . . . . . . . . . . . . . . 118 4.4.2 Numerical simulations of the mouse corneal micropocket angiogenesis assay . . . . . . . . . . . . . . . . . . . . . . . 121 4.5 Conclusions . . . . . . . . . . . . . . . . . . . . . . . . . . . . . . . 129 4.6 Supporting information . . . . . . . . . . . . . . . . . . . . . . . . 130 5 Growth, regression, and regrowth 133 5.1 Stimuli dependency of tumor-induced vasculature . . . . . . . . . . 134 5.2 The mathematical model . . . . . . . . . . . . . . . . . . . . . . . . 136 VI.
(7) 5.3 5.4. 5.5 5.6. Numerical methods . . . . . . . Results and discussion . . . . . 5.4.1 Intuition of the model . 5.4.2 Vascular growth . . . . 5.4.3 Regression and regrowth Conclusions . . . . . . . . . . . Supporting information . . . .. . . . . . . .. . . . . . . .. . . . . . . .. . . . . . . .. . . . . . . .. . . . . . . .. . . . . . . .. . . . . . . .. . . . . . . .. . . . . . . .. . . . . . . .. . . . . . . .. . . . . . . .. . . . . . . .. . . . . . . .. . . . . . . .. . . . . . . .. . . . . . . .. . . . . . . .. . . . . . . .. 141 143 143 144 146 148 150. 6 Convection-driven vascular patterns 151 6.1 Blood flow in the micro-circulatory system . . . . . . . . . . . . . . 151 6.2 The mathematical model . . . . . . . . . . . . . . . . . . . . . . . . 153 6.2.1 The fluid flow model . . . . . . . . . . . . . . . . . . . . . . 154 6.2.2 The angiogenesis model . . . . . . . . . . . . . . . . . . . . 156 6.2.3 Parameters . . . . . . . . . . . . . . . . . . . . . . . . . . . 158 6.3 Numerical method . . . . . . . . . . . . . . . . . . . . . . . . . . . 160 6.3.1 The continuous equations . . . . . . . . . . . . . . . . . . . 160 6.3.2 The discrete component and the discrete–continuum coupling164 6.3.3 Numerical scheme . . . . . . . . . . . . . . . . . . . . . . . 164 6.4 Results . . . . . . . . . . . . . . . . . . . . . . . . . . . . . . . . . . 166 6.4.1 Vascular patterning with TAF convection . . . . . . . . . . 166 6.4.2 Study on capillary types and tumor sizes . . . . . . . . . . 169 6.4.3 Intratumoral pressure . . . . . . . . . . . . . . . . . . . . . 172 6.5 Conclusions . . . . . . . . . . . . . . . . . . . . . . . . . . . . . . . 176 6.6 Supporting information . . . . . . . . . . . . . . . . . . . . . . . . 176 7 Summary, conclusions, and further work 177 7.1 Summary . . . . . . . . . . . . . . . . . . . . . . . . . . . . . . . . 177 7.2 General conclusions . . . . . . . . . . . . . . . . . . . . . . . . . . . 179 7.3 Ongoing and further work . . . . . . . . . . . . . . . . . . . . . . . 181 A List of publications. 185. B The Hallmarks of Cancer. 189. C Molecular mechanisms of angiogenesis. 197. D Angiogenesis assays. 205. E Extended summary in Spanish. 209. F Extended summary in Galician. 219. Bibliography. 229 VII.
(8) VIII.
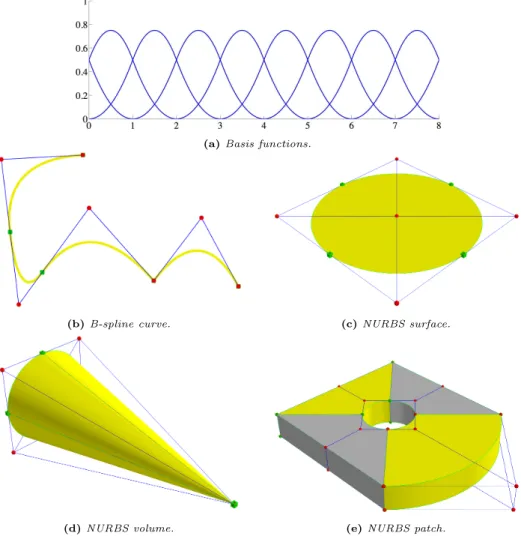
(9) List of Figures. 1.1 1.2 1.3 1.4 1.5 1.6 1.7 1.8 1.9 1.10 1.11 1.12 1.13 1.14 1.15 1.16 1.17 1.18. Leading cases of deaths . . . . . . . . . . . . . . . Cancer incidence . . . . . . . . . . . . . . . . . . . Exogenous cancer risk factors . . . . . . . . . . . . The angiogenesis switch . . . . . . . . . . . . . . . Cancer incidence as a function of age . . . . . . . . Section of an avascular tumor . . . . . . . . . . . . Invasion and metastasis . . . . . . . . . . . . . . . Tumor stroma . . . . . . . . . . . . . . . . . . . . . The circulatory system . . . . . . . . . . . . . . . . New capillary formation in response to wounding . Mechanisms of tumor neovascularization . . . . . . The angiogenic process . . . . . . . . . . . . . . . . Physiological versus tumor vessels . . . . . . . . . New approaches to antiangiogenic therapies . . . . Continuous models of tumor-induced angiogenesis . Discrete models of tumor-induced angiogenesis . . A hybrid model of tumor-induced angiogenesis . . Basis functions, B-splines, and NURBS . . . . . . .. . . . . . . . . . . . . . . . . . .. . . . . . . . . . . . . . . . . . .. . . . . . . . . . . . . . . . . . .. . . . . . . . . . . . . . . . . . .. . . . . . . . . . . . . . . . . . .. 2 3 5 7 10 11 13 15 18 20 21 23 25 27 33 35 37 43. 2.1 2.2 2.3 2.4 2.5 2.6 2.7. Conceptual scheme of the tumor angiogenesis process . . . . Representation of the spatial domains involved in the model Limiting function and velocity modulus . . . . . . . . . . . Energy functional and proliferation function . . . . . . . . . Template functions . . . . . . . . . . . . . . . . . . . . . . . Flowchart of the numerical method . . . . . . . . . . . . . . Initial conditions . . . . . . . . . . . . . . . . . . . . . . . .. . . . . . . .. . . . . . . .. . . . . . . .. . . . . . . .. 48 51 54 56 60 66 69. IX. . . . . . . . . . . . . . . . . . .. . . . . . . . . . . . . . . . . . .. . . . . . . . . . . . . . . . . . .. . . . . . . . . . . . . . . . . . ..
(10) 2.8 2.9 2.10 2.11 2.12. Time evolution . . . . . . . . . . . . . . . . . . . . . . . . . . Evolution of the time-step size . . . . . . . . . . . . . . . . . Parametric study of the model . . . . . . . . . . . . . . . . . Numerical examples with randomly distributed hypoxic cells . Numerical simulations with different initial conditions . . . .. 3.1 3.2 3.3 3.4 3.5. Chemotaxis and haptotaxis . . . . . . . . . . . . . . . . . . . . . . Turning probability function . . . . . . . . . . . . . . . . . . . . . . Formation of a vascular network driven by tumor induced angiogenesis Comparison of two simulations without and with haptotaxis . . . . Study of rotational diffusivity and turning coefficient values . . . .. 4.1 4.2 4.3 4.4 4.5 4.6. Characterization of the cornea . . . . . . . . . . . . . . . . . . . . 103 Pellet preparation . . . . . . . . . . . . . . . . . . . . . . . . . . . 104 Protocol of the mouse corneal micropocket angiogenesis assay . . . 105 Examples of the mouse corneal micropocket angiogenesis assay . . 106 Three-dimensional angiogenesis from two parent capillaries . . . . 108 Growth of a three-dimensional vascular network promoted by hypoxic cells mimicking a multifocal tumor . . . . . . . . . . . . . . . 109 Three-dimensional angiogenesis promoted by different number of hypoxic cells . . . . . . . . . . . . . . . . . . . . . . . . . . . . . . . 111 Influence of haptotaxis in angiogenesis in three dimensions . . . . . 112 Geometry of the cornea . . . . . . . . . . . . . . . . . . . . . . . . 114 Construction of the subject-specific computational mesh . . . . . . 116 Numerical tests using a thrice smaller cornea geometry . . . . . . . 119 Numerical test using the cornea geometry reduced by a factor of 2/3120 Initial conditions of the mouse corneal micropocket angiogenesis assay . . . . . . . . . . . . . . . . . . . . . . . . . . . . . . . . . . . 122 Simulation of the mouse corneal micropocket angiogenesis assay in the absence of haptotaxis . . . . . . . . . . . . . . . . . . . . . . . 123 In vivo and in silico mouse corneal micropocket angiogenesis assays125 Time evolution of a simulation of the mouse corneal micropocket angiogenesis assay . . . . . . . . . . . . . . . . . . . . . . . . . . . 126. 4.7 4.8 4.9 4.10 4.11 4.13 4.14 4.15 4.16 4.17 5.1 5.2 5.3 5.4 5.5 5.6 5.7 5.8. . . . . .. . . . . .. Growth, regression, and regrowth in vivo . . . . . . . . . . . . . Filopodia . . . . . . . . . . . . . . . . . . . . . . . . . . . . . . . Conceptualization of tip endothelial cells . . . . . . . . . . . . . . Chemical energy and tilting function . . . . . . . . . . . . . . . . Intuition of the model . . . . . . . . . . . . . . . . . . . . . . . . Corneal neovascularization . . . . . . . . . . . . . . . . . . . . . . Tumor angiogenesis simulation: growth, regression, and regrowth Evolution of the relative vascular density . . . . . . . . . . . . . . X. . . . . .. . . . . . . . .. 71 72 73 75 77 80 85 93 95 98. 135 136 139 141 145 147 149 150.
(11) 6.1 6.2 6.3 6.4 6.5 6.6 6.7. Transvascular fluid flow . . . . . . . . . . . . . . . Hydraulic conductivity . . . . . . . . . . . . . . . . Staggering numerical schemes . . . . . . . . . . . . Non-convective versus convective vascular patterns Study of convection under common pressure setups Convection-increased angiogenesis . . . . . . . . . Influence of intratumoral pressure . . . . . . . . . .. . . . . . . .. . . . . . . .. . . . . . . .. . . . . . . .. . . . . . . .. . . . . . . .. . . . . . . .. . . . . . . .. . . . . . . .. 153 155 165 167 171 173 175. 7.1 7.2 7.3. Mechanotaxis . . . . . . . . . . . . . . . . . . . . . . . . . . . . . . 181 Quantification of a tumor induced vasculature . . . . . . . . . . . . 182 Coupling angiogenesis and tumor growth . . . . . . . . . . . . . . . 183. B.1 The hallmarks of cancer and the enabling characteristics . . . . . . 191. XI.
(12) XII.
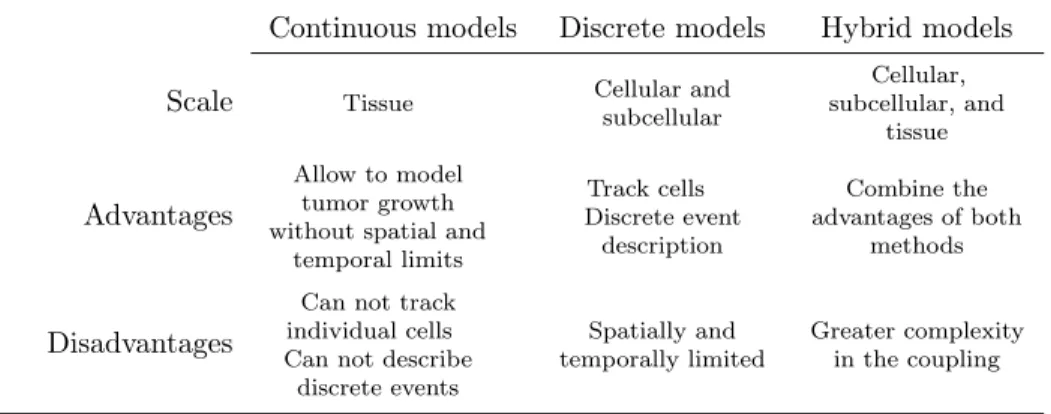
(13) List of Tables. 1.1. Characteristics of continuous, discrete, and hybrid models . . . . . 29. 2.1. In vivo and in silico values of the parameters of the model . . . . . 58. 3.1 3.2. Dimensionless parameters of the continuous equations . . . . . . . 87 Parameters related to the movement of the tip endothelial cells. . . 88. 4.1. Parameter re-calibration for the mouse corneal micropocket angiogenesis assay . . . . . . . . . . . . . . . . . . . . . . . . . . . . . . 121. 5.1. Parameters of the model in dimensionless units. . . . . . . . . . . . 142. 6.1. Values of the parameters grouped by the different sub-models given in dimensionless units. . . . . . . . . . . . . . . . . . . . . . . . . . 159. C.1 Tumor angiogenic growth factors . . . . . . . . . . . . . . . . . . . 198 D.1 Advantages and disadvantages of in vivo angiogenesis assays . . . . 206. XIII.
(14) XIV.
(15) List of Symbols. Abbreviations ATP. Adenosine 5’-triphosphate. CAD. Computer-aided design. CAM Chorioallantoic membrane Dll-4. Delta-like ligand 4. ECM. Extracellular matrix. EMT. Epithelial-to-mesenchymal transition. FEA. Finite element analysis. FGF. Fibroblast growth factor. HYC. Hypoxic cell. IGA. Isogeometric analysis. MET. Mesenchymal-to-epithelial transition. MMP Matrix metalloproteinases MPI. Message passing interface XV.
(16) NURBS Non-uniform rational B-splines SEC. Stalk endothelial cell. SUPG Streamline upwind/Petrov–Galerkin method TAF. Tumor angiogenic factor. TEC. Tip endothelial cell. VEGF Vascular endothelial growth factor VMS. Variational multiscale method. Main variables of the mathematical models c. Capillary order parameter. f. Tumor angiogenic factor. p. Fluid pressure. Main constants of the mathematical models α. Proliferative/apoptotic phenotype switch. β. Proliferative/apoptotic phenotype switch. χ. Chemotatic constant. δ. Turning angle. δ4. Dll-4 diffusion length. δnox. Nutrient and oxygen diffusion length. λ. Interface width. Bd. TAF natural decay. Bp. TAF proliferation rate. Bu. TAF uptake rate. cact. Order parameter condition for de/activation XVI.
(17) D. TAF diffusion. Dr. Rotational diffusivity. dv. Turning coefficient. fp. TAF condition for highest proliferation. fact. TAF condition for de/activation. fHYC. TAF production. Gact. TAF gradient condition for de/activation. GM. TAF gradient for highest velocity. M. Mobility. RHYC HYC radius RTEC TEC radius. XVII.
(18) XVIII.
(19) Chapter. 1. Introduction 1.1. Motivation and research objective. Motivation Cancer facts Cancer is the second cause of death in the world, just behind cardiovascular diseases (see figure 1.1). According to the last estimation from the World Health Organization performed in 2012 (Ferlay et al., 2012), approximately 8.2 million of people died from cancer, that is, 15% of all deaths worldwide. Furthermore, there have been 14.1 million estimated new cases that year. And, although 32.5 million people diagnosed with cancer from 2008 were alive at the end of 2012, an estimated 169,3 million years of healthy life were lost globally because of cancer in 2008. Despite the amount of funding and research in the field, these figures increase year after year, probably boosted by the growth and aging of the population. The global fight against cancer is hindered by the different cancer burden and cancer types among regions, as highlighted by figures 1.1 and 1.2. Figure 1.1 shows how the number of people that die from cancer varies greatly between different income countries (using the World Bank income classification World Bank, 2014). Population aging and lifestyle —including smoking, diet, and physical activity— are among the main reasons of cancer deaths in the high and upper-middle income countries, while insufficient access to treatments and late diagnosis are the causes for high cancer mortality in lower-middle income countries. The high burden of 1.
(20) 1 · Introduction Key. Thousands of deaths. Cardiovascular diseases Malignant neoplasms Infectious and parasitic diseases Respiratory disesases Respiratory infections Neonatal conditions. 15000. 10000. 5000. 0. Global. Low income countries. Lower-middle income countries. Upper-middle income countries. High income countries. World Bank income group. Figure 1.1. Leading cases of deaths by cause worldwide and by World Bank income group. After heart diseases, cancer is the leading death cause globally and in the upper-middle and high income countries. (Data source: Latest estimates by the World Health Organization Ferlay et al., 2012). infections and parasitic diseases in low income countries explain their lower cancer mortality. Figure 1.2 shows both the age-standardized cancer death rate per one thousand people and the top three cancer killers per region, separated by gender. This figure also highlights the non uniform distribution of cancer around the world, not only in its incidence by country, but also in the regional mortality of different cancer types. Among all cancer types, lung cancer, which is the most common cancer in men, causes most cancer deaths worldwide; almost a fifth. It is one of the top cancer killers in every region shown in figure 1.2, except in the Sub-Saharan Africa. Breast, colorectal, and prostate cancer are also among the most deadly ones. All these facts highlight the importance of a community of interdisciplinary researchers coming from all the branches of Science equipped with all kind of tools to fight cancer. And among these tools, Knowledge has proven to be the more powerful. History has shown that the more we know about cancer, the better we are able to fight it. Cancer through History Cancer is not a recent illness, but a disease affecting human beings since thousands of years ago. The first known description of cancer, which was in particular about breast cancer, comes from an Egyptian papyrus 2.
(21) 9%. 9%. 9%. 10%. 10%. 10% 8%. 12%. 19%. 5%. 19%. 23%. Sub-Saharan Africa. 8%. 9%. 21%. 6%. 7%. 21%. Middle East and North Africa. Male. 10%. 13%. 20%. 10%. 16%. 16%. Oceania. Breast Lung Colorectal Prostate Liver Stomach Cervical Kaposi's sarcoma. Key. 10%. 13%. 13% Female. 10%. 15% 13%. 25% 15%. 17%. Asia. 13%. 12%. 26%. Europe. Figure 1.2. Cancer incidence. Age-standardized cancer death rate per one thousand people by country (world map) and top three cancer killers in males and females per region (pie charts). (Adapted from May, 2014). 15%. 16%. 15%. Latin America and the Caribbean. >116.0 99.7–116 89.8–99.6 73.3–89.7 <73.3. Key. 26%. 15%. 28%. North America. 1.1 · Motivation and research objective. 3.
(22) 1 · Introduction which is a copy of an older book dating back to 3000 BC. This document explains how tumors were treated by cauterization with a tool called fire drill, although it is also written they knew there was no treatment for this disease. The Egyptian culture attributed the disease to gods will. The Greek civilization also knew about cancer. In fact the word we use now, cancer, is the Latin translation of the Greek karkinos, which means crab —because it resembled the shape of a crab—, and it is ascribed to Hippocrates. This physician, called the Father of Medicine, believed that the body was composed of four fluids: blood, phlegm, yellow bile, and black bile. He thought that an excess of black bile anywhere in the body caused cancer. And for more than 1400 years this was the general belief. It is not until the paradigm shift that came with the development of the Scientific Method in the Renaissance period that this theory was questioned again. Autopsies started to be performed and with them the study of cancer, Oncology, began. Now that bodies were analyzed looking for the causes of death, new theories began to replace the previous ones. In the Eighteenth century, John Hunter suggested surgery as a treatment for certain sorts of cancer: Those that had not yet invaded the neighboring tissues. Afterwards, the development of anesthesia involved advances in surgery that allowed improvements in the resection of certain tumors. The use of the modern microscope in the 19th century meant a big step in the study of cancer. For more detailed information about cancer History see (Olszewski, 2010; Sudhakar, 2009). How cancer is understood nowadays At present, we understand cancer as a group of diseases —more than a hundred— that share common characteristics: The uncontrolled proliferation of cells and their ability to invade other tissues and continue there with their abnormal proliferation. Each cancer is different from the others in many aspects and they are usually named after the host tissue in which they develop at first, as in breast cancer, prostate cancer, or lung cancer. Cancer is originated by a single abnormal cell (Weinberg, 1998) that acquires through mutations, that is changes in their DNA, malignant characteristics. This process, called carcinogenesis, is complex and may take years or decades to complete. In fact, there is not full knowledge of the reason for all mutations and that is why we usually refer to risk factors rather than mutations themselves when speaking about cancer causes. These factors may be divided into exogenous and endogenous. 75-80% of cancers develop due to the former and they can be either physical, chemical, or biological. As shown in figure 1.3, the exogenous factors with higher impact are tobacco use, obesity and overweight, and pathogen infections. Many authors estimate that 30% of cancer deaths could be prevented by reducing these factors through healthy life styles. On the other hand, the endogenous factors represent only 5-7% of the whole and are produced by hereditary 4.
(23) 1.1 · Motivation and research objective Relative contribution to cancer incidence. 30. 20. 10. D O ie cc t up ex a po tio su na re l s Al co ho Re l pr od ra UV f uc a t di at lig cto ive io ht rs n /Io ex n i En pos zin u g vi ro re po nm llu en t t Pr ant al es s cr ip dr tio ug n s. O. To b. ac co. us e ve O rw be ei sit g y Pa ht th og en s U nk no w n Ph in y ac s tiv ica ity l. 0. Risk factors. Figure 1.3. Exogenous cancer risk factors. The two risk factors that most contribute to cancer incidence, tobacco and overweight, could be reduced to a minimum just with healthy habits. (Adapted from American Asociation for Cancer Research, 2015). alterations in the DNA sequence. The mechanisms by which cancer occurs in the remaining cases are not accurately known (Ames et al., 1995). In addition, one of the most important factors is aging (Torre et al., 2015), as explained latter in this document. The consequence of carcinogenesis is usually the creation of solid masses or tumors, formed by cancerous cells that multiply rapidly, even ignoring the anti-growth signals sent by the own body. Tumors grow and develop going through a set of increasingly-malignant stages. Remarkably, tumors can gain the ability to invade nearby tissues or to colonize and create secondary tumors in distant organs using the vasculature as a means of transport. It is at this point, when the tumors are more malignant, that cancer is more lethal. However, there is not a single reason why cancer kills, but it depends on the type of cancer. One reason is the loss of function of a vital organ (or organs) due to the uncontrolled and abnormal growth of the tumor (or tumors). For instance, in lung cancer, eventually, there may be not enough healthy tissue to absorb oxygen or in colorectal cancer, the lumen of the digestive system may get blocked. Also, the fine tuned regulation of some chemical in the body may be unbalanced by a tumor located in the organ that produces them, for example, the liver. Or the amount of calcium in the blood may be risen by bone cancer causing unconsciousness and eventually death. 5.
(24) 1 · Introduction In most types of cancer, luckily, from carcinogenesis until cancer becomes a real thread to life, cancerous cells have to overcome several natural barriers that prevent tumor growth. Continuous research has deepened the knowledge in such barriers and, nowadays, they are understood as opportunities to treatments that delay or halt tumor growth. For example, tumors can not grow beyond a certain size until cancerous cells gain the ability to promote angiogenesis, that is, the creation of new blood vessels from the pre-existent ones. The role of angiogenesis in cancer Certain types of cancer form solid tumors of aberrant, mutated cells. These cells, that proliferate in a high-rate manner, aggregate in solid masses that grow at the expense of the resources of the surroundings. At this stage of tumor growth (called the avascular stage), cancerous cells depend on diffusion mechanisms to obtain nutrients. However, when the tumor has grown up to a certain size, not larger than 2 mm radius in experiments (Folkman, 1971), its global growth stops. This occurs due to the scarceness of nourishment and oxygen that does not even cover the demands for maintaining the basic cell processes in the core of the mass. Tumors may stay dormant in this stage for years and only grow further if cancerous cells acquire the ability to induce angiogenesis. In order to promote vessel growth, tumor cells, and even malign-induced, non-cancerous cells from the tumor micro-environment, release chemical signals, called tumor angiogenic factors (TAFs), that alter the phenotype of the endothelial cells that line nearby capillaries. As a result, new capillaries grow towards the tumor and provide nourishment to cancerous cells. Thus, angiogenesis enables a boost in tumor development, the so-called angiogenic switch (see figure 1.4), moving the tumor to the vascular phase and endowing cancerous cells with nutrients and oxygen to grow without limits and with new ways of migration to other tissues or organs of the body. The realization of the key role of angiogenesis has leaded to the development of antiangiogenic therapies. Although this will be explained later in the document, we advance here that these therapies have not achieved the expected results yet. Arguably, an emerging paradigm in Medicine called predictive medicine will change radically cancer investigation and may be the tool to unravel the problems with antiangiogenic therapy. Predictive medicine Cancer is a disease with a high morbidity and mortality rate, thus it is hardly surprising that many people devote their efforts and work to deepen the knowledge we currently have on cancer, comprehending better the mechanisms involved and thereby being able to better diagnose and create new treatments. This research, as well as the clinical practice, is usually developed 6.
(25) 1.1 · Motivation and research objective. Vascular tumor. Ne Nascent capillary. ex is. Tumor angiogenic factors. ePr. ca pil lary. se l. el. New vasculature. Pre -ex is. ss. ten t. ve. w. nt te. es. Avascular tumor. v. Figure 1.4. The angiogenesis switch. Tumors are able promote angiogenesis, the growth of new vessels from pre-existing ones, through signaling. The nutrient from the new capillaries triggers a virtually unbounded tumor growth and the possibility to metastasize using the circulatory system.(Adapted from Bergers and Benjamin, 2003). by groups composed by physicians and biologists. They follow the diagnostic paradigm, which is heavily based on the experience of the physicians with previous patients and on statistical data of the effect of the treatments on large groups of individuals. In the last decades, however, a new paradigm has been proposed: predictive medicine. Its aim is to predict the emergence, development, and consequences of a disease, as well as to enhance current treatments and propose new ones. Predictive medicine is based on mathematical modeling and computation. This new approach has been successfully applied to cardiovascular diseases (Taylor and Figueroa, 2009) and orthopedics (Taylor and Prendergast, 2015), and it has recently started to be applied to Oncology (Chauviere et al., 2010; Gatenby and Maini, 2003; Sanga et al., 2007). Objectives This thesis continues the research developed by the Group of Numerical Methods in Engineering (GMNI) of the Universidade da Coruña in the field of computational mechanics, in particular, it is the first to explore the sub-field of computational biomechanics. It is also the first developed under the project Modeling and Simulation of Cancer Growth (MuSIC), whose objective is to introduce predictive models for cancer growth with the aim of shifting the traditional diagnostic paradigm of 7.
(26) 1 · Introduction cancer treatment towards a predictive, patient-specific one. In parallel with the MuSIC project, the objective of this thesis is to develop mathematical models of tumor-induced angiogenesis that include key biological mechanisms and to perform isogeometric-based numerical simulations in relevant experimental setups and three-dimensional, subject-specific geometries. The objectives of this thesis may be divided into three categories: • Modeling: The goal is to develop novel mathematical models of tumorinduced angiogenesis that include key biological mechanisms, namely, the migration of tip endothelial cells following different cues, the ability of capillaries to regress and regrow depending on exterior stimuli, and the role of interstitial fluid convection in pattern formation. These models involve continuous fields governed by high-order partial differential equations and discrete elements. • Simulation: Most of the mathematical models found in the literature are simulated in simple, two-dimensional geometries. In fact, we also plan to perform in silico simulations of the above models in two dimensions that replicate relevant in vivo angiogenic configurations to facilitate the study of the model. However, angiogenesis is a three-dimensional process and occurs in tissues or organs with non-trivial geometries. Hence, the second objective of this thesis is to go one step beyond and perform three-dimensional simulations in real geometries that will permit the comparison with experiments. In particular, our goal is to develop a tumor-induced angiogenesis simulation of one of the most widely used in vivo assays, the mouse corneal micropocket angiogenesis assay, using a three-dimensional, subject-specific geometry. To the best knowledge of the author, this simulation will allow for the first time the comparison between a simulation and an experiment in a three-dimensional real geometry. • Computational: The third objective is to develop numerical algorithms capable of performing the above simulations efficiently. First, we need to develop a mathematical framework that seamlessly integrates the discrete agents as part of one of the continuous fields. We also need to use a recently introduced technology, isogeometric analysis, able to handle the higher order terms of the partial differential equations in two- and three-dimensional complex geometries. Furthermore, the algorithms need to be robust, to overcome the stiffness in space and time that derives from the use of two scales, and to run efficiently in parallel. 8.
(27) 1.2 · Context. 1.2 1.2.1. Context Biology background. The objectives of this thesis are deeply grounded on the biology of angiogenesis, the mathematical modeling of tumor angiogenesis, and the numerical methods to simulate the models. Therefore, this section is devoted to give a general context in these three aspects. It starts with a biology background to explain how cancer grows and spreads and how tumors promote angiogenesis; continues with the state of the art of mathematical modeling of tumor-induced angiogenesis; and finalizes with an explanation of the numerical method used to solve the models, namely, isogeometric analysis. Cancer growth and spread Carcinogenesis As said above, carcinogenesis, also called tumorigenesis, is the process whereby normal cells acquire the capabilities to become cancerous cells. These capabilities are usually gained through mutations, but also by nonmutational changes in mechanisms regulating gene expression —those exerting the transcriptional control; for example whether a gene should be transcribed or not or the transcription velocity needed under certain circumstances. However, in the rest of the document, we will refer to both of them just as mutations for the sake of clarity. There are many genes known to be involved in carcinogenesis and, surely, many more still unknown. These genes can be classified in oncogenes and tumor suppressor genes. The former ones refer to those whose upregulated expression trigger processes which lead to cancer development. On the other hand, tumor suppressor genes are those that must be removed from the genotype or downregulated to switch normal cells into malignant. The first step towards cancer development starts when a cell undergoes a mutation in one of these genes and for any reason the machinery which was supposed to eliminate this cell through the apoptotic program fails in its function. This occurs because the mentioned machinery is not hundred percent efficient. Notwithstanding, this fact does not mean all cells that evade this natural barrier to defective cells lead to cancer formation. Most of the cells that elude the machinery either have minor or neuter changes in chromosomes —mutations in genes that do not jeopardize cell integrity1 — or the alterations are so severe that the cell is not 1 The mutated genes may be the target of future mutations. For example, one of these changes might be a replication of a gene. It would be a neuter mutation, but in the future, if mutated another time, it would not imply inviability for function loss, because its previous role would be maintained by the other gene (the copy).. 9.
(28) 1 · Introduction Cancer incidence rates per 100000 population. Male rate 3000. Global rate Female rate. 2000. 1000. 0. 4. 85 +. -8. -7. 9 80. 4 -7. 75. 9 70. 4. -6. -6. 65. 9 60. 4. -5. -5. 55. 9 50. 4. -4. -4. 45. 9 40. 34. 9. -3 35. 30 -. 4. -2 25. 9 -1. -2 20. 4 -1. 15. 9 10. 5-. 0-. 4. Age. Figure 1.5. Cancer incidence as a function of age. The incidence increases drastically with age, both in women and men, illustrating that many mutations accumulated along the years are necessary to develop cancer. (Data source: Cancer Research UK, 2015). viable and it is doomed to die. However, in the rare cases a mutation results in a viable cell with altered functions or characteristics it may suppose a step towards evolution or a step towards a disease like cancer. The order of magnitude of the number of mutations that an individual may suffer through its lifespan is 1010 (Alberts et al., 2007). The probability that one of these mutations affects the machinery that controls cell cycle is so high that, if only one mutation were required to develop cancer, we would be non-viable organisms. However, carcinogenesis is a multi-step process that usually takes a long time —years or decades— to be fully completed because normal cells only acquire a malignant phenotype through the accumulation of several mutations (Loeb et al., 2003). For example, an individual who has been exposed to exogenous risk factors may develop clinically detectable cancer 20 years after2 . In fact, many cancers never develop, because carcinogenesis starts late in the life of an individual, who may die first due to other reasons. It is remarkable that as life expectancy has elongated in the last centuries, cancer incidence has increased, demonstrating thus that aging is a cancer risk factor. Figure 1.5 evidences this fact. For these reasons, Hanahan and Weinberg in the superb series of papers Hanahan and Weinberg (2000, 2011) highlighted that one of the main enabling characteristics to develop cancer is genome instability and mutation of cells. They also added to these characteristics the ability of tumors to promote inflammation and the aid from the recruited cells of the tumor micro-environment. The aim of these papers was to collect all the capabilities that cells must (at least) acquire through 2 Cancers. 10. originated form endogenous factors usually take less time to develop..
(29) 1.2 · Context. Proliferative rim. Hypoxic zone. Necrotic core 100 μm. Figure 1.6. Section of an avascular tumor. A non-invasive avascular tumor reaches a stable configuration with three main distinguished regions: The proliferative rim, the hypoxic zone, and the necrotic core. (Adapted from Yu et al., 2004). mutations to become malignant. They called them The Hallmarks of Cancer and are the following: Sustaining proliferative signaling, evading growth suppressors, resisting cell death, enabling replicative immortality, inducing angiogenesis, activating invasion and metastasis, reprogramming of energy metabolism, and evading immune destruction. A brief description of them may be found in appendix B. The stages of tumor growth As a result of carcinogenesis, there is a viable mutated cell, often called the renegade cell (Weinberg, 1998), which has acquired partially or totally one or more hallmarks. The cell and its daughters proliferate generating clonal expansions that inherit the hallmarks. The same process may be repeated triggered by carcinogenic agents leading to increased malignant subgroups of cells, each of them with different gathered traits. Thus, a heterogeneous mass of aberrant cells originates a tumor. Tumor growth may be understood as a multistage process. For many tumors, the first of these stages is avascular growth. At this stage, the tumor relies on diffusion mechanisms to get nutrients and to remove the waste products of the cell activity through nearby blood and lymph vessels. However, as the tumor grows, diffusion mechanisms become insufficient to maintain the high proliferation rate of tumor cells. At this point, the tumor usually resembles a spheroid where those cells located far from the vessels, that is towards the center of the spheroid, enter nonproliferative hypoxic states or die from anoxia, starvation, or metabolic poisoning. 11.
(30) 1 · Introduction As a consequence, solid avascular tumors present a characteristic cell-layered configuration, as shown in figure 1.6. The outermost cells form a thin layer (2 to 3 cells wide), called the proliferative rim, where tumor cells have access to nutrient delivered by pre-existent, extratumoral capillaries. This layer envelops the so-called hypoxic zone, where the amount of nourishment is above a deadly threshold, but it is not enough for cell proliferation. Those cells in the hypoxic zone enter a quiescent state, only altered when the levels of nutrients vary. Finally, if the tumor is big enough, there is no means for the cells at its core to obtain nutrients. These cells necrose3 and form a necrotic core. Contrary to apoptosis, necrosis generates toxic wastes and, because there is no means to remove the wastes, the toxicity promotes malignancy or necrosis in the surrounding cells. Hence, diffusion-limited growth imposes a threshold in the maximum diameter of an avascular tumor (usually between 1 and 2 mm), for which the cell subdivision rate at the proliferative rim is balanced with cell death rate at the necrotic core (Folkman, 1971). The tumor may be years or decades immersed in the avascular stage (Folkman and Kalluri, 1984) without causing any harm to the host tissue. Eventually, a tumor cell may find a way to access nutrients and to eliminate wastes. One of these ways (first hypothesized by Folkman, 1971) is to create its own blood supply through a process called angiogenesis: the creation of new capillaries from pre-existing ones. The genomic instability of tumor cells may lead to daughter cells that have gained the ability to control the balance of angiogenic factors (one of the above-mentioned hallmarks), for example under hypoxic conditions. As a consequence, the tumor may overcome the size-limited avascular growth and enter the so-called vascular stage. This step, usually called the angiogenesis switch (Bergers and Benjamin, 2003; Folkman and Kalluri, 1984), is often related to a malignant state of the tumor, as cell proliferation is no longer limited and cells may enter the bloodstream and migrate to any part of the body, attaining the tumor invasive-metastatic stage. Due to this key role played by angiogenesis in tumor growth, we anticipate here that controlling angiogenesis is the aim of some cancer treatments: the antiangiogenic therapies. Another way through which tumors get access to nutrients is by co-opting the pre-existing vessels, that is, cancerous cells migrate towards vessels and proliferate around them. Usually, the high pressure that the cells exert produces the collapse of the vessel, returning thus the tumor to an avascular stage. Invasion and metastasis is usually the last step of tumor growth and typically the cause of death. It is also the most complex one, as cancer cells must survive in alien environments from where they were originated and for long times in many cases. To achieve this stage, as shown in figure 1.7, cells undergo the so called 3 Necrosis:. It is the premature death of cells caused by external factors. In contrast to apoptosis, which is a naturally occurring cause of cellular death, necrosis is almost always detrimental.. 12.
(31) 1.2 · Context Cells grow as a benign tumor Basal in epithelium lamina. Break through basal lamina. Invade capillary. Connective tissue. Travel through bloodstream (less than 1 to 100 cells will survive to form metastasis). Capillary. Adhere to blood vessel wall in liver. Escape from blood vessel (extravasation). Proliferate to form metastasis in liver. Figure 1.7. Invasion and metastasis. Tumor cells may achieve the ability to break through the basal lamina that envelopes all the tissues and colonize the adjacent ones. They may also enter the blood flow and spread to distant tissues, generating secondary tumors or metastases. (Reproduced from Alberts et al., 2007). invasion-metastasis cascade (Fidler, 2003; Talmadge and Fidler, 2010), which consists of the following steps: • Intravasation: Cancer cells enter the blood and lymphatic vessels. • Dissemination: The circulatory system transports cancer cells passively throughout the organism. Cancer cells may stay dormant in the blood stream for long times without producing any harm. • Extravasation: Cancer cells escape from the vessels into the other distant tissues. • Micro-metastasis: Once outside the vessels, cancer cells form small nodules. • Colonization: Micro-metastasis can only grow further to form macroscopic tumors if they are able to survive and proliferate in their new emplacement. To do so they sequester or enslave the cells that form their new tumor 13.
(32) 1 · Introduction micro-environment. Tumor stroma One of the changes in the way cancer is understood nowadays is to consider tumors composed, not just by the cancerous cells, but also by their micro-environments. If a tumor spreads beyond the vascular steady phase it is due to the recruitment of the neighboring cells which are present in the extracellular matrix (ECM). These cells are not malignant per se, but tumors use them for their own purposes, commonly attracting and controlling them through signaling. Generally, the tumor-recruited cells are referred to as tumor stroma, because they are part of the supporting normal tissues. As shown in figure 1.8, the tumor stroma is composed, at least, by the following elements: • Cancer cells: They do not form a homogeneous group, since every lineage is doted with different traits (the aforementioned hallmarks and characteristics). For example, figure 1.8 not only shows cancer cells, but also invasive and stem cancer cells. • Cells associated to newly formed blood and lymph vessels: These are essentially the endothelial cells that line the vessels acting as the blood or lymph physical barrier and the coverage cells that enwrap the endothelial cells and provide structural support to the vessels. Both types of cells are recruited by tumors to satisfy their nutrient needs. • Activated fibroblasts or cancer-associated fibroblasts: In this category, two types of fibroblasts are included, namely, reprogrammed variants of normal fibroblastic cells and myofibroblasts. It has been demonstrated that tumors use them to enhance proliferation, angiogenesis, invasion, and metastasis. • Inflammatory infiltrates: They develop several roles in cancer, being the most prominent their labor in cleaning death cells and debris. The realization of the key role played by the tumor stroma in cancer development has implied a big step in understanding this disease. What is more, the core of some new cancer therapies derived from the regulation of the cancer stroma. For example, as explained below, antiangiogenic therapy aims to control the development of vessels that form part of the malignant stroma. Also, some treatment fails may be attributed to the reductionist view of targeting only cancer cells or only a sub-type of them. The main treatments Currently, there are several treatments, which can be grouped as follows: 14.
(33) 1.2 · Context Cancer stem cell. Cancer-associated broblast. Cancer cell. Endothelial cell. Pericyte. Immune in ammatory cells. Local & bone-marrow derived stromal stem & progenitor cells Invasive cancer cell. Figure 1.8. Tumor stroma. Cancer cells recruit other cells from their micro-environment to form the tumor stroma. This stroma includes cancer cells, cells associated to newly formed vessels, activated fibroblasts, and inflammatory infiltrates. (Reproduced from Hanahan and Weinberg, 2011). • Surgery: It is the removal of the tumor (and some surrounding tissue) using surgical procedures. This treatment is used for small tumors and, despite its invasiveness, it has the advantage of being highly localized, minimizing side effects. However, as the contours of the tumor are not well defined, there can always remain cancerous cells in the tissue which are very likely to regrow. • Radiation therapy: This treatment is based on the fact that many of the cancer cells have reduced their ability to repair DNA. Therefore, when exposed to radiation, the DNA is altered, cells cannot repair it, and they die. This treatment is relatively localized, but affects a significant number of healthy cells. • Chemotherapy: It uses one of the features that distinguish cancer cells from normal cells: Their high proliferation rate. Chemotherapy usually interrupts one or more of the phases of the cell cycle or alters its external conditions, so that proliferating cells fail to reproduce and die. It is a nonlocalized treatment, thus it can affect any cell in the body, specially those that multiply rapidly as the cells of nails and hair. • Immunotherapy: It consists of stimulating the immune system to recognize cancer cells, hence, letting the body itself be the one that removes them. The most common side effects are skin reactions caused by the injections, flu-like symptoms, or allergic reactions. 15.
(34) 1 · Introduction • Targeted therapies: Those therapies that focus on specific proteins by binding to the surface cell receptors, disrupting pathways, or interrupting somehow specific processes that occur especially or to a greater extent in cancer cells. The drugs for some targets are hard to develop and many of them can cause side effects. In addition, cancer cells can become resistant to such drugs. • Hormone therapy: Slows or stops the growth of cancer that uses hormones to grow in some type of cancer, as prostate or breast cancer. The side effects of these therapies are related to the particular hormone that is blocked or interfered. • Antiangiogenic therapy: They prevent the formation of new vessels required for tumor growth. The importance of angiogenesis in processes like wound healing, heart and kidney functions, fetal development, and reproduction lead to side effects that include problems when bleeding, clots in vessels, hypertension, and protein in the urine. • Other treatments: Biological response modifiers, vaccines, stem cell transplant, and complementary and alternative medicines. Usually these treatments are not used exclusively, but combined. For example, radiation as adjuvant therapy4 to surgery to eliminate those cells that otherwise could be left by the surgeon; neo-adjuvant5 chemotherapy before radiation to make cancer cells more sensitive to radiation; or concomitant radiation and chemotherapy, to ensure the elimination of all cancer cells. Further information about cancer treatments can be found in (Camidge and Jodrell, 2005; Fentiman, 2005; Jackson and Porte, 2005; Kiltie, 2005). Despite all the effort made in research, all of these treatments are far from being definitive, but palliative in many cases, and some of them entail many side effects. Besides, the therapy chosen for an individual is based on the physicians experience with previous patients and on the mean treatment response in the clinical phases of the treatment, that is, the diagnostic paradigm. However, an individual may be highly responsive to a therapy rejected a priori according to those criteria, or vice versa. That is why a shift towards the new medical model patient-specific, predictive medicine is gaining momentum in the last decade. Its aim is to provide the physicians with another tool to help them assign a treatment to a patient, based on predictive mathematical models which are fed with data from the specific patient that will be treated. This model has been successfully applied to 4 An adjuvant therapy is a therapy given in addition to the primary, main, or initial one to maximize its effectiveness. 5 A neo-adjuvant therapy is the one given as a first step to shrink the tumor before the main treatment.. 16.
(35) 1.2 · Context other medical disorders, as in cardiovascular disease, and it is only starting to be developed for cancer. As shown later in this chapter, the mathematical oncology community is doing a lot of effort to develop mathematical models for cancer growth and spread and, in particular, in blood vessel growth and angiogenesis to model the angiogenic switch and its consequences. Blood vessel growth. Angiogenesis The circulatory system One of the most important systems in the body is the circulatory system, since its main function is to deliver and collect the vast majority of molecules that sustain cell life. It serves as a means of oxygen and nutrient delivery, waste products’ disposal from the cell cycle, long distance signaling transport, such as hormones and immune surveillance. In addition, it plays a central role in organogenesis. The circulatory system is often seen as composed by the cardiovascular system and the lymphatic system. The major components of the former are the blood, a fluid chiefly consisting of platelets, blood cells, and plasma; the heart, a muscle responsible for pumping blood; and the blood vessels, the ducts that span the body and through which blood flows. The lymphatic system is also formed by a fluid, the lymph, and by vessels, the lymphatic vessels. Its role is more related to the immune system. All cells in our body, apart from rare exceptions such as corneal cells, rely on the circulatory system for survival. Thus, it is necessary for the system to span the whole body. This is only achieved through a strict double tree-like hierarchy (figure 1.9). Heart-pumped blood is transported through large-caliber, high-pressurized arteries to the main parts of the body. The blood is then distributed by progressively smaller vessels, namely, medium arteries and arterioles, until it reaches the capillary beds. There, the tree-like hierarchy is replaced by a lattice-like structure of capillaries, prioritizing thus delivery over transport. It is in the capillaries, the thinner tubes of the circulatory system, where most of the molecular and cellular exchange is performed. The molecules leak out (extravasate) and enter (intravasate) through the permeable walls of these vessels. Once a molecule is outside them, it reaches the cells mainly by diffusion (Alberts et al., 2007). This process limits the molecules scope to 100 to 200 micrometers away from the extravasation point. Therefore, every cell should be at that maximum distance from a capillary; otherwise it would enter in a hypoxia state. Put in other words, the vessel network has to be dense enough to allow access to every single cell. The waste and other byproducts of these cells are collected by venules that start the second tree-like hierarchy (with the opposite direction to the former). Venules discharge into medium-caliber veins, that in turn flow into large veins. Note that a great proportion of the waste products as well as immune cells return through 17.
(36) 1 · Introduction Tunica externa. Internal elastic membrane. Tunica intima. Endothelium Tunica media. Tunica media. Tunica intima. Tunica externa Endothelium. Tunica externa. Tunica externa Tunica media. Tunica media. Tunica intima. Tunica intima. Endothelium. Endothelium Smooth muscle cells (tunica media) Tunica externa. Endothelium. Endothelium Basement membrane Pores Endothelial cells Endothelial cells Basement membrane. Figure 1.9. The circulatory system. (Reproduced from Marieb, 2003). the lymphatic system. The vessels of the circulatory system are formed by different layers, whose number and purpose varies with the caliber and function of the vessel (see figure 1.9). The innermost layer, the endothelium, is formed by the main component of the vascular system, as well as of the lymphatic system: the endothelial cells. These cells line the blood vessels forming a tube, the lumen, and are usually at a quiescent state. Blood vessels are enveloped by pericytes whose main function is to stabilize endothelial cells, but also collaborate in other activities such as regulating the permeability in certain organs (eg. blood-brain barrier). Pericytes and endothelial cells share a common basement membrane and the three of them (and occasionally smooth muscle cells) are the main components of capillaries. Greater vessels are formed 18.
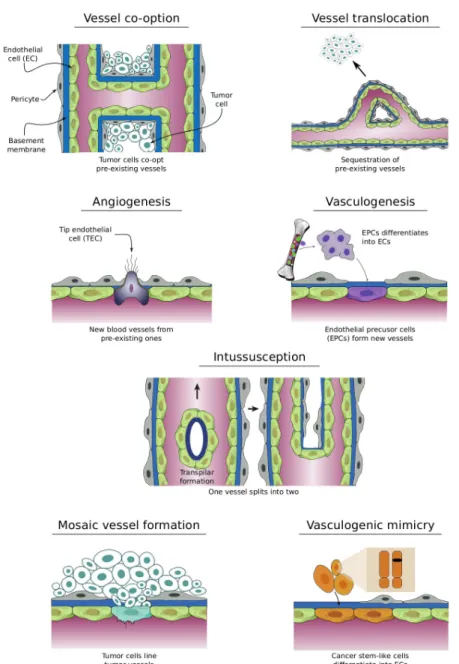
(37) 1.2 · Context by increasing number of layers that provide them with support to accommodate the dynamic loads of the flowing blood. Mechanisms of vessel growth Functions carried out by the circulatory system are essential to sustain life, therefore the generation and maintenance of such an intricate and complex system is vital. It is during embryogenesis when the blood and the blood vessel network develops. First, through a process known as vasculogenesis, endothelial cell precursors6 migrate from the bone marrow towards the corresponding emplacement and differentiate into endothelial or blood cells, forming a plexus. Afterwards, the vascular bed is extended and remodeled via several mechanisms such as angiogenesis (Carmeliet, 2005) and intussusception or splitting angiogenesis (Kurz et al., 2003). Then, in adult life, physiological vasculogenesis, angiogenesis, or intussusception appear at very specific, tightly regulated events and only for a short time span, usually days or weeks. Examples of such events are the female reproductive cycle or tissue repair, as in the wound healing process shown in figure 1.10. Due to the importance of the vascular system, it is not surprising that defective maintenance of blood vessels or deregulation of its growth are associated with a number of diseases. When there is an inadequate vessel maintenance or a downregulated growth, the absence of blood vessels may affect the tissue repairing program, as in ischemic chronic wounds in diseases such as stroke, obesity-associated disorders, or myocardial infarction. On the other hand, an abnormal remodeling or upregulated growth, may promote inflammatory diseases, age-related macular degeneration, or cancer, to name but a few. For a longer list of diseases related to blood vessel maintenance and formation, the reader is referred to Carmeliet and Jain (2000). In particular, in cancer, tumors gain access to the vasculature using several mechanisms (see figure 1.11): • Using existing blood vessels: – Vessel co-option: Cancer cells engulf existing blood vessels (Leenders et al., 2002). – Vessel translocation: Vessels are attracted towards the tumor location (Kilarski et al., 2009). • Creating new blood vessels: – Angiogenesis: It is the formation of new blood vessels from the preexisting ones. – Postnatal vasculogenesis: It is the formation of new blood vessels 6 Endothelial. bone marrow.. precursor cells: They are one of the three types of stem cells to be found in. 19.
(38) 1 · Introduction. 60 hours after wounding. Control 100 m. 100 m. Figure 1.10. New capillary formation in response to wounding. In the left panel an image of the control situation is shown. The right one illustrates the blood vessel configuration sixty hours after wounding.(Reproduced from Alberts et al., 2007). through the migration from bone-marrow and differentiation of endothelial precursor cells. – Intussuception or splitting angiogenesis: It is the splitting of one vessel into two through the formation of a transluminal pillar and its extension (Burri et al., 2004; Kurz et al., 2003). – Mosaic vessel formation: It is the incorporation of cancer cells among the endothelial cells of the vessel walls. – Vasculogenic mimicry: It is the transdifferentiation of cancer cells into endothelial cells. As it might be expected, tumors may exploit several of these mechanisms along their growth, even at the same time. However, among all of them, angiogenesis is assumed to account for a substantial fraction of vessel growth and it will be the objective of study here. It is worth noting that there is not full agreement between these terms and some authors use angiogenesis as a general term which includes all these mechanisms of vessel creation and growth. Here, however, we will use it as the specific term defined above. The process of tumor angiogenesis Endothelial cell quiescence is maintained by a tightly controlled balance between chemicals that promote angiogenesis (proangiogenic factors) and those that inhibit angiogenesis (anti-angiogenic factors). 20.
(39) 1.2 · Context. Tumor cells line tumor vessels. Figure 1.11. Mechanisms of tumor neovascularization. Tumor cells may gain access to blood vessels using different mechanisms and usually through a combination of them. (Adapted from Carmeliet and Jain, 2011). 21.
(40) 1 · Introduction Despite this tight control, tumors are able to trigger angiogenesis. Tumor angiogenesis is a complex phenomenon governed by intertwined molecular mechanisms whose main components are the so-called tumor angiogenic factors (TAFs). The latter are chiefly soluble molecules, released by hypoxic cancer cells and their malignant micro-environment, and membrane receptors in tumor stroma cells. There are more than twelve known of such molecules and many others still under research. In addition, there are complex interplays among them that are still being disentangled and started to be comprehended. More information on TAFs may be found by the interested reader on appendix C, where we detail the sources, receptors, and main functions of the best well-known TAFs. Angiogenesis, as shown in figure 1.12, may be described as a multistage process composed of the following steps: activation, initiation of the sprout, growth of the capillary, and finalization of the process (Carmeliet and Jain, 2011; Figg and Folkman, 2011a; Potente et al., 2011; Weis and Cheresh, 2011). As said above, the activation starts when the equilibrium of the pro- and anti-angiogenic factors is disturbed near the endothelial cells that line the blood vessels. The disequilibrium may be caused by the arrival of tumor pro-angiogenic factor molecules that diffuse from the hypoxic tumor cells and bind to the receptors of the endothelial cells. Wellknown examples of these factors are vascular endothelial growth factor (VEGF), fibroblast growth factor (FGF), angiopoietin 2 (Ang-2), or chemokines. Those cells affected by these tumor angiogenic factors are activated to become the leading cells of the incipient sprout: the tip endothelial cells (TECs). However, there is a mechanism, called lateral inhibition, that prevents the formation of several sprouts in the same region (Hellström et al., 2007): even though several neighboring endothelial cells may sense the disequilibrium of angiogenic factors, only one of them changes its phenotype from quiescent to a migratory one and becomes a TEC. The remaining cells, instead, change their phenotype to a proliferative one. The latter, referred to as stalk endothelial cells (SECs), will play a role in the elongation of the sprout, as explained below. The key molecular players of lateral inhibition are the Delta-like ligand 4 (Dll-4) and its receptor Notch-1. In brief, TAFs activate the expression of Dll-4 which binds to the membrane Notch-1 receptors of the adjacent cells. Those cells whose Notch-1 receptors get activated become SECs and only one, the first to express Dll-4, becomes a TEC. By the end of the activation phase, the endothelial cells have changed their phenotype and are prepared to create a new sprout. They are, however, still confined by the mural cells and the basement membrane. The initiation of the sprouts starts with the liberation of endothelial cells. First, the pericytes that enwrap the vessels, by means of Ang-2, detach from the region of the incipient sprout. Then, tumor stromal cells release matrix metalloproteinases (MMPs) that produce a proteolytic breakdown of the basement membrane that 22.
(41) 1.2 · Context. Figure 1.12. The angiogenic process. Angiogenesis starts with the activation of tip endothelial cells by tumor angiogenic factors. The incipient sprout, once liberated from the capillary coverage, grows towards the source of tumor angiogenic factors. The capillary elongates by the proliferation of stalk endothelial cells. The growth continues until two capillaries anastomose. The new vessel maturates and blood flows though it irrigating the tissue.. 23.
(42) 1 · Introduction envelopes the endothelial cells. MMPs also liberate cleaved TAFs from the extracellular matrix. Once the basement membrane is degraded, the endothelial cells loosen their junctions (VE-Cadherin), the nascent vessel dilates, and a provisional ECM is laid out to facilitate migration. TECs develop slender cytoplasmic protrusions, called filopodia, rich in receptors that enhance the detection of the stimuli that guide the migration (Gerhardt et al., 2003). The adjoining SECs follow the first movements of the TEC out of the capillary. The growth of the capillary includes the guidance of the TECs and the elongation of the capillary. TECs are guided at least by three different mechanisms, namely, chemotaxis, haptotaxis, and mechanotaxis. The first refers to the movement towards a gradient of soluble molecules, in this case, TAFs such as VEGF or FGF. Haptotaxis and mechanotaxis also contribute to establish the growth direction through focal adhesion sites and the mechanical forces, respectively. Lately, it has been hypothesized that endothelial cells compete for the TEC position as the capillary grows (Jakobsson et al., 2010). Behind the TEC, SECs are continuously dividing stimulated by angiogenic factors, promoting thus the elongation of the capillary. Meanwhile, the endothelial cells form a lumen, allowing the blood to flow through them. Furthermore, they attract smooth muscle cells and pericytes, that provide support to the capillary. This last process, called maturation, is usually defective in tumor-induced capillaries. The growth continues until the lumina of two capillaries fuse forming a loop that allows blood to flow. This phenomenon is called anastomosis. When this happens, the endothelial cells revert their phenotype to a quiescent one (also called phalanx phenotype) and recruit more pericytes that help to maintain this phenotype through signaling. Also, both types of cells create a shared basement membrane and the endothelial cells reestablish their junctions. The growth may also be stopped if the driving stimuli end. In tumor angiogenesis, this point is reached when the hypoxic cancerous cells are supplied with enough nutrients and oxygen as to become normoxic. The capillaries promoted by tumors are usually slightly different from those created under normal circumstances, as explained below. Specifically, they become dependent on TAF presence, thus, when the stimuli are no longer present, the capillaries regress. In addition, the high pressure inside the tumor combined with the weakness of the vessels may make them collapse. Finally, the regrowth of the capillaries is common in tumor development and it is done at a faster speed aided by the scaffold of basal lamina left behind by the regression of the vessels (Mancuso et al., 2006). Characteristics of tumor vessels As a result of the angiogenesis switch, the once growth-stable avascular tumor has turned into an unstable, vascular, and malignant tumor pervaded with capillaries. However, as shown in figure 1.13, the 24.
(43) 1.2 · Context new capillaries are defective in several senses (Baluk et al., 2005). Overexpression of pro-angiogenic factors and/or underexpression of anti-angiogenic factors lead to the formation of a new vasculature that is structurally abnormal. At the anatomical level, the precocious and disorganized capillary sprouting and endothelial cell proliferation, combined with localized events of regression and regrowth, plus the increased vascular shunting and collapse result in a marked loose of the strict hierarchy that characterizes the normal vasculature. In addition, capillaries present saccular regions with haphazard patterns of interconnections. At the cellular level, endothelial cells show an irregular and disorganized morphology, that even present long cytoplasmatic projections that transverse the capillary lumen. The association between endothelial cells is weak, leading to loose connections between cells. The perivascular cells that ensheathe normal vessels is loosely attached or even absent in tumor-induced vessels. The vascular membrane is unusually thick in some tumors or very thin or absent on others.. Figure 1.13. Physiological versus tumor vessels. Unlike vessels created under physiological conditions (left panel), tumor vessels (right panel) show a clear loss of the vessel hierarchy and structure, a marked aberrant morphology, and disorganized and abundant sprouting. (Reproduced from McDonald and Choyke, 2003). These anatomical and cellular abnormalities have drastic influences at the functional levels of the new vasculature: • Heterogeneity in blood flow. Structural defects promote spatial and temporal heterogeneity blood flow. Furthermore, the flow is often redundant in closed and blind loops. • High interstitial pressure. Defects at the cellular levels confer leakiness to the vasculature. Thus, the intravascular fluids and plasma easily extravasate, 25.
(44) 1 · Introduction increasing the interstitial pressure. In addition, the absence of functional intratumoral lymphatic vessels results in impaired clearance of the fluid. The high interstitial pressure hinders the delivery of systemically administered therapies. • Regional hypoxia. Tumors present local regions of hypoxia due to several factors such as vascular collapse, regression and regrowth events, regional poor perfusion, and high interstitial pressure. As cancer cells are more resistant to hypoxia than normal cells, hypoxia promotes their malignant phenotype, facilitating, for instance, their ability to form metastasis. • Acidosis. It is caused by the byproducts of necrosis that cannot leave the tumor because of the faulty transport functionality of the vasculature. Acidosis compromises the cytotoxic functions of immune cells that infiltrate the tumor, enhancing the malignant phenotype. Antiangiogenic treatments Since Folkman hypothesized the angiogenic switch, antiangiogenic therapy has been a promising treatment against cancer. In the last decades, different kinds of inhibitors of angiogenesis have been developed, being most of them VEGF blockers or multi-targeted tirosine-kinase receptor inhibitors (see appendix C). Some of them, as bevacizumav or sorafeniv, have even been approved for clinical use against specific types of cancer and usually in combination with chemotherapy. However, despite their success in pre-clinical trials, the translation of most angiogenic inhibitors to antiangiogenic treatments in humans, that is, to clinical practice, has not resulted as expected: although in some cases the disease-free progression has increased, the overall survival did not. There are many hypotheses that try to explain this general failure. Most of these hypotheses are based on the differences between the pre-clinical and the clinical settings in terms of simplicity of the former compared to the latter, the unknowns in dose amount, or the dose timing. Also, some patients are refractory to the treatment and many others develop resistance to them. For example, Dvorak and colleagues (Nagy and Dvorak, 2012) have detected that anti-VEGF therapy is effective only at certain stage of vessel growth (see figure 1.14a), and is refractory otherwise. Recently, Jain and co-workers have hypothesized that the little efficacy of antiangiogenic therapies may be due to an excessive pruning of the vasculature (Goel et al., 2011; Jain, 2001, 2005). High doses or treatments over long time spans prune the vasculature too much and promote hypoxia in the tumor, which in turn increases the malignancy of tumor cells and their resistance to radiotherapy and chemotherapy. Thus, excessively pruning leads to more aggressive forms of cancer. They propose that the aim of antiangiongenic therapy should be instead the normalization of 26.
Figure


+7


![Figure 2.11. Numerical examples of the model with different randomly distributed hypoxic cells on the domain Ω = [0, 700] 2](https://thumb-us.123doks.com/thumbv2/123dok_es/7260810.438040/93.748.81.618.127.655/figure-numerical-examples-different-randomly-distributed-hypoxic-domain.webp)
Documento similar