Age Diversity: An Empirical Study in the Board of Directors
26
0
0
Texto completo
(2) governance initiatives, since the most recent financial crisis has revealed serious weaknesses of this body to fulfil its duties. A common recommendation to improve board effectiveness is concerning diversity of the boards. For instance, European Commission in a working document entitled “Corporate Governance in Financial Institutions: Lessons to be drawn from the current financial crisis, best practices” argues that diversity broadens the debate within the boards and helps to avoid the danger of narrow “group think”. Generally, the selection of candidates seems to have drawn on a too narrow pool of people. As a consequence, there was a lack of diversity of views within boards which may in some cases have contributed to the failure board members to effectively challenge management decisions (COM, 2010:8). However, in the academia world, the results of research on the association between top management team diversity on corporate performance have been inconclusive (Nielsen, 2010). In this sense, this study expects to contribute to the understanding of board diversity and examines how it might affect corporate performance. Authors (Campbell and Minguez-Vera, 2008; Mahadeo, et al. 2012; Nielsen, 2010) frequently use the term “diversity” as synonym of heterogeneity, dispersion, difference, a good mix of attributes, etc. This study, following Harrison and Klein (2007), uses the term diversity to describe the distribution of differences among the members of a unit with respect to a common attribute. In the literature, the main unit of analysis is the top manager team; however, the definition of the top manager team also differs widely between studies (Nielsen, 2010). In this study, the unit of analysis is the board of directors, since it is a key corporate governance mechanism and it is ultimately responsible for the correct performance and successful of a firm (Bhagat and Bolton, 2008). Harrison and Klein (2007) point out that diversity can be defined as three different ways: diversity as separation, variety, and disparity, and each type of diversity might have different effects on corporate performance. In particular, they explore the typology’s implications for the special case of demographic diversity, showing that the same demographic attribute within units may be conceptualised as separation, variety, or disparity. In this vein, the attribute “age” remains as one of the most important demographic variable in order to examine the issue of board diversity. According to Kang et al. (2007) there is an active promotion of age diversity in board to encourage the different perspectives of different age groups, and as an integral part of succession planning. Indeed, the European Commission recommends increasing age diversity, among others, and remarks that:. 2.
(3) “Resulting from the experiences and knowledge that different age groups bring to the board, increasing levels of age diversity may improve the overall level of knowledge on the board” (COM, 2010:11). However, prior findings of limited studies on the relationship between age diversity and corporate performance are inconsistent. Some studies report positive effects of age diversity on performance (Mahadeo et al., 2012; Kilduff et al., 2000), while others find either no significant effects (Bunderson and Sutcliffe, 2002; Zimmerman, 2008) or negative effects (Milliken and Martins, 1996; Murray, 1989). A possible explanation of these inconclusive findings could be that previous research has omitted the interactions between different aspects of diversity. In fact, in a review of theories and methodologies of top management team diversity, Nielsen (2010) highlights that the distinction between diversity as variety, separation and disparity (Harrison and Klein, 2007) needs to be applied to future research. In this context, this study aims to test empirically the theoretical consequences build on Harrison and Klein’s (2007) diversity typology. In particular, the main purpose is to examine how board age diversity, in terms of separation, variety and disparity, affects corporate performance. This paper expects to contribute to the existing corporate governance literature, business practice and public policy in several ways. First, this study contributes to the theoretical understanding of board diversity and their consequences on corporate performance, since it integrates psychologists, sociologists theories with an management and economic orientation. Second, it empirically explores novel measures of age diversity of the boards that reflects different types of diversity. Third, this study also examines the impact of the three forms of diversity simultaneously with the aim to isolate, and, hence, analyse the opposite effects of different diversity types on strategic behavior and performance. Fourth, in light of the corporate governance guidelines that recommend increase board diversity, this paper brings new evidence about the three types of diversity and the finding suggests to encourage board age diversity as variety in order to adopt different views and make more deliberate decisions in the board, which improve corporate performance. This paper is divided into five sections. After this introduction, a review of the theoretical framework is provided. The third section includes information on the sample, variables, and methodology used in estimating the model. The fourth section presents the findings and empirical analysis. The final section summarises and concludes the study.. 3.
(4) 2. THEORETICAL FRAMEWORK 2.1. Theory and hypotheses development The upper echelon theory has received wide interest in the field of organization behaviour. A seminal paper of this theory is the publication of Hambrick and Mason in 1984 entitled “Upper echelons: The organization as a reflection of its top managers”. Hambrick and Mason (1984) propose a model of how upper echelon characteristics may become reflected in organizational outcomes. They argue that complex decisions, such as strategic choices, are largely the outcome of behavioural factors rather than a mechanical quest for economic optimization. Given the great difficulty obtaining conventional psychometric data on top executives, Hambrick and Mason (1984) suggest to use observable – demographic- managerial characteristics as valid proxies of executives’ cognitive frames. Another relevant idea introduced by Hambrick and Mason (1984) is that an analysis of the characteristics of the top management team allows stronger explanations of organizational outcomes than an analysis of the individual characteristics of top executive alone (Hambrick, 2007). However, recent research on understanding of the complex roles played by top managers and top management teams requires applying alternative theories in combination with the upper echelons perspective in order to find the answer to the fundamental question of whether heterogeneity in top management team composition is contributing to firm strategy and performance (Nielsen, 2010). In this vein, the role of individual psychological factors and team processes on executive decisionmaking have led to wider application of group psychology and sociology theories combined with upper echelons theory. The research question in this paper is to examine empirically the effect of diversity as separation, variety, and disparity on corporate performance. To that end, three hypotheses are developed based on upper echelon theory, which states that the aggregate characteristics of top management team have influence over corporate performance, and the new directions for diversity theory proposed by Harrison and Klein (2007). Diversity as separation, which refers to differences in position or opinion among unit members, is closely related to theories of similarity-attraction (Byrne, 1971; Clore and Byrne, 1974), social identity and self-categorization (Hogg and Terry, 2000; Tajfel and Turner, 1979). These theories posit that individuals are attracted to others with similar attributes to themselves and greater similarity presumably lead to shared results, fewer disagreements and conflicts, higher levels of cooperation. 4.
(5) and cohesion, trust, and social integration. Therefore, relationships with similar others make possible to reach a consensus easier and make decisions in an efficient way. Consequently, the following theoretical hypothesis is proposed: Hypothesis 1: A greater separation leads to a lower level of corporate performance. Diversity as variety indicates differences in kind or category, knowledge or experience among unit members. In this case, information processing theory (Ashby, 1956) and human cognition theory (Campbell, 1960) assume that teams whose members draw from different pools can translate greater information richness within a unit into better choices, plans, or products, deliver from different views and, thus, make more effective decisions. Based on these arguments, the following hypothesis is expected: Hypothesis 2: A greater variety leads to a higher level of corporate performance. Diversity as disparity represents differences in concentration of valued social assets of resources such as pay, power, prestige and status among unit members. This third perspective builds on distributive justice theory (Adams, 1963; Deutsch, 1985), tournament theory (Lazear, 1995; Lazear and Rosen, 1981), and stratification, status hierarchy or characteristics theories (Berger, Fisek, Norman, and Zelditch, 1977; Blau, 1960). The basic idea of this perspective is that in teams where few members have a marked influence over the group decision, they control the flow of information, impose their views and limit a democratic participation in the team. Likewise, low-status members tend to be conformist and contribute less to the team performance. Consequently, the decisions are made in worse conditions and it negatively impact on corporate performance. Therefore, the following hypothesis is presented: Hypothesis 3: A greater disparity leads to a lower level of corporate performance. 2.2. Antecedents and outcomes of age diversity Harrison and Klein (2007) argue that some team attributes are strongly related to a particular type of variety. For instance, pay is a good proxy of diversity as disparity, since its structure captures the differences in the power of the members in a team; or functional background seems to be a form of disparity as variety, because shows qualitative differences in the kinds of information held by team members. However, these authors also remark that demographic variables most frequently included in diversity studies, such as age, sex, race, organization and team tenure, may be meaningfully conceptualised as separation, as variety, or as disparity.. 5.
(6) In this context, this study focuses on age diversity. As remark Shore et al. (2009) the research on age diversity is much less developed than research on race and gender, suggesting the need for new paradigms and new approaches to studying age diversity. Moreover, in spite of the growing number of international initiatives that encourage age diversity to improve the overall level of knowledge on the top management team, its potential effects on performance are not yet fully understood (Kunce et al. 2011) and the limited empirical studies show inconclusive results. The theoretical arguments for promoting age diversity at top management team are mixed. Murray (1989) highlights that a homogenous board (minimum level of diversity) is made up of individuals who shared similar values, which leads to ensure better goal congruence and communication. However, Houle (1990) argues that a heterogeneous board can ensure that a more efficient division of labour operates at board level with the older group providing the experience, the network, and the financial resources; the middle-aged group in charge of the main executive responsibilities; and a younger group learning and developing its knowledge of the business. In this vein, Mahadeo et al. (2012) remark that homogenous board may encourage complacency, cronyism, lack of interest in new strategies and decisions based on compromises. Prior findings of limited empirical studies on the effect of age diversity of top management team on corporate performance are inconsistent. Mahadeo et al. (2012) examine data from the 2007 annual reports of 42 companies listed on the Stock Exchange of Mauritius and find that age diversity positively impact on short-term performance. Likewise, Kilduff et al. (2000), using data from 35 simulated firms run by a total of 159 managers attending executive education programs, find evidence that age heterogeneity of team members positively affects overall performance. However, some studies find no significant effects between age diversity and corporate performance. Bunderson and Sutcliffe (2002) collect data from the management team members of business units in a Fortune 100 consumer products company and the findings show that age diversity does not affect unit performance. Zimmerman (2008) examines the relationship among top management heterogeneity and the capital raised by the firm through its initial public offering. He finds that heterogeneity in functional background and educational background is associated with greater capital raised, however, he does not find that age heterogeneity is significant in raising funds at initial public offering. Other studies have reported negative effects on performance. Murray (1989) identifies elements related to age and years of experience which he conceptualises as temporal heterogeneity in 84 US food and. 6.
(7) oil companies and finds a negative correlation between this variable and short-term performance. Milliken and Martins (1996) review and evaluate management research on the effects of different types of diversity in group composition at various organizational levels and remark several empirical studies (Cummings et al., 1993) that report negative effects of age diversity on performance. As Nielsen (2010) suggests, it is possible that the inconclusive findings of previous research result from the fact that interactions between different aspects of diversity are omitted. This author also highlights that the distinction between diversity as variety, separation and disparity (Harrison and Klein, 2007) needs to be applied to future research. In this context, this study expects to contribute to theoretical and empirical understanding of board diversity by means of test the different effects of age diversity as separation, variety and disparity on corporate performance.. 3. DATA AND METHODOLOGY 3.1. Sample The sample selection process starts with firms listed in FTSE 100, FTSE SMALL CAP, DAX 30, and CAC 40 for year 2009. Data on board characteristics are from Asset4 database (Thomson Reuters), and data on financial items are from Worldscope. Given the limitation of available data, the final sample consists of 2,152 individual observations of director’s characteristics. These directors are members of 205 boards. Therefore, this empirical study uses data from 205 European listed firms. 3.2. Variables 3.2.1. Dependent variables This study aims to examine how age diversity of the board directors affects corporate performance. Consistent with previous studies (Cornett, et al. 2009, Cheng, 2008) the corporate performance variable (PERFORMANCE) is estimated by an accounting performance measure, specifically, earnings before interests and taxes divided by book value of total assets (EBITA). This study also considers a proxy for accunting performance removing the influence of the home country and insutry performance. Therefore, the country- and industry-adjusted EBITA is defined as the difference between a firm’s EBITA and the avarage EBITA across all listed firms in the same two-digit SIC and from the country in which the company is registered (Cheng, 2008; and Faccio et al., 2011). Note that the avarages of EBITA for each industry and country have been calculated for all firms listed in London, Frankfurt and Paris Stock Exchanges, that is 3911 firms in total.. 7.
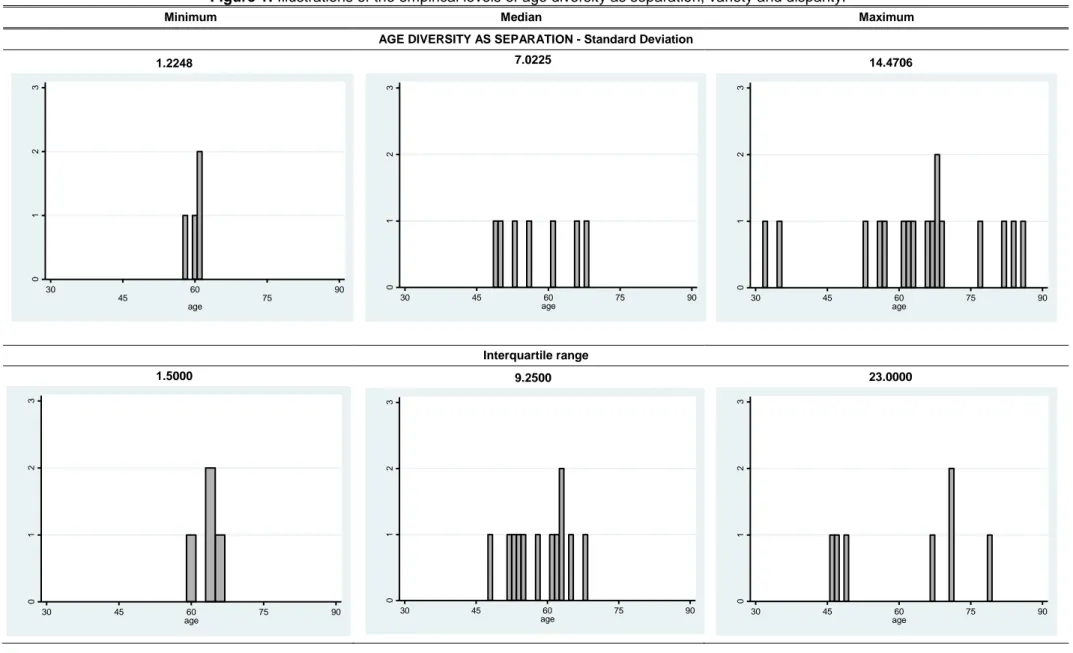
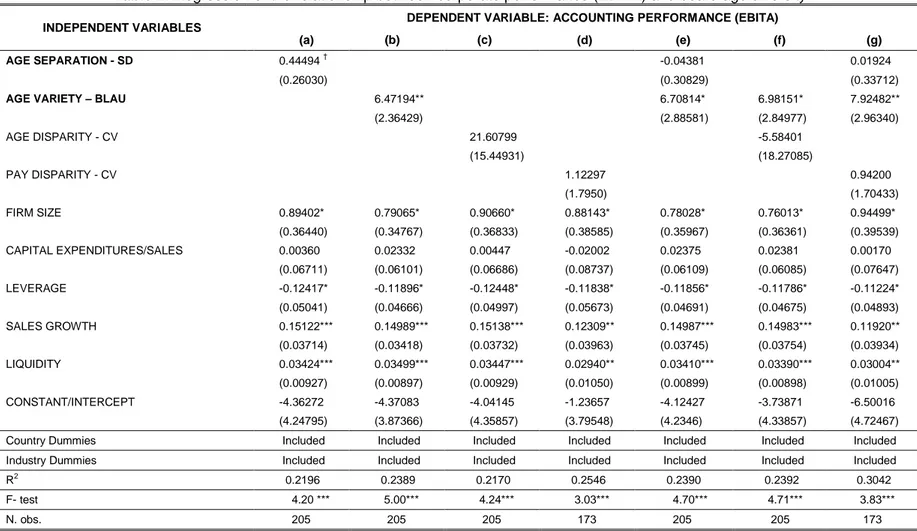
(8) 3.2.2. Independent variables Harrison and Klein (2007) explain implications for research design; in particular, they suggest appropriate operationalisation for each type of diversity (DIVERSITY). Following their suggestions, this study uses different measure of age diversity as separation, variety and disparity. Figure 1 shows the graphic illustration of the three empirical levels – minimum, median and maximum – of the variables used as proxies of the three types of diversity, using the sample of this study. Ferrero-Ferrero et al. (2012) measured diversity by standard deviation of the age of directors, Blau’s Index of directors’ generation, coefficient of variation of the age and coefficient of variation of the coefficient of variation of director’s pay. This study extends the previous one by also examining interquartile range of age and Teachman’s Index of directors’ generation as diversity measures. Insert Figure 1 about here Diversity as separation is considered as a continuous variable. Maximum occurs when there are two subgroups divided but balanced within a team and each subgroup takes opposite stances, thus both subgroups show disagreement and opposition between themselves. Age diversity as separation (AGE SEPARATION) is measured by standard deviation of the age of directors that are members of the board. However, figure 1 shows that this measure does not follow the theoretical pattern in the maximum empirical level of age diversity as separation. Therefore, additionally this study uses the interquartile range to measure the diversity as separation, which seems to fit better the theoretical pattern. Diversity as variety is a categorical attribute. Focusing on age, this variable represents differences in personality, traits, skills, attitudes, mental health, work values and behaviours. These differences may be categorized according to the generations, since the social and historical experiences and circumstances from a respective generation have influenced the individuals’ behaviour. There is a strong consensus among scholars (Suvillan et al., 2009; Twenge et al., 2010) about the four major generations of the twentieth century: the Greatest Generation (1922-1945), Boomers (1946-1964), Xers (1965-1983), and Generation Y (1984-2002). Suvillan et al. (2009) and Twenge et al. (2010) argue that members of the Greatest Generation are self-disciplined, believe in self-sacrifice and traditional value, as well as they are extremely loyal employees. The next generation, Boomers, thinks that hard work and effort would lead to success, values extrinsic measures of career success, develops a distrust of authority and places a high value on independent. 8.
(9) thinking. Xers are influenced by the financial, family and societal insecurities that dominated their childhoods. They lack solid traditions but are highly mobile and are accustomed to rapid change. They learn quickly, embrace diversity and like informality. Despite the characteristics of the youngest generation is less clear, Twenge et al. (2010) remark that they have grown up with the Internet and they are accustomed to getting access to information quickly. This study uses these generations as qualitative distinction to define the different categories. Note that any member belongs to the Generation Y, thus age diversity as variety is measured by three categories based on generations - the Greatest Generation (64 - 87), Boomers (45 - 63), and Xers (26 - 44). The age of the directors has been calculated using as base year 2009. Following previous studies (Miller and Triana, 2009; Talke et al. 2010; Campbell and Minguez-Vera, 2008) and according to the properties of this variable (Harrison and Klein, 2007), this study uses two index to calculate age diversity as variety (AGE VARIETY). The first is the Blau’s Index (1977) that is calculated by Equation 1, where k is a particular category (generation) and Pk is the proportion of directors of a particular category within the board. 3. Variety 1 PK2. (1). K 1. This index has been divided by its theoretical maximum with the aim of standardising the results and making the interpretation of the index easier. The second measure is the Teachman’s index (1980), calculated as Equation 2 shows, where Pk is again the proportion of directors in the k category. 3. Variety PK ln( PK ). (2). K 1. The minimum theoretical variety occurs when all members belong to the same category. In this study this is the case of 31 boards of directors, since all members of the board belong to the same generation, in particular in the Boomers, expect a board whose members belong to the Greatest Generation. Harrison and Klein (2007) highlight that the maximum theoretical variety is when each member within a unit comes from a unique category. However, this maximum implies that all boards have the same size and there are as categories as directors. Given the data does not fulfil both conditions, the maximum empirical variety is maximised when the three categories are present in a board in equal proportions.. 9.
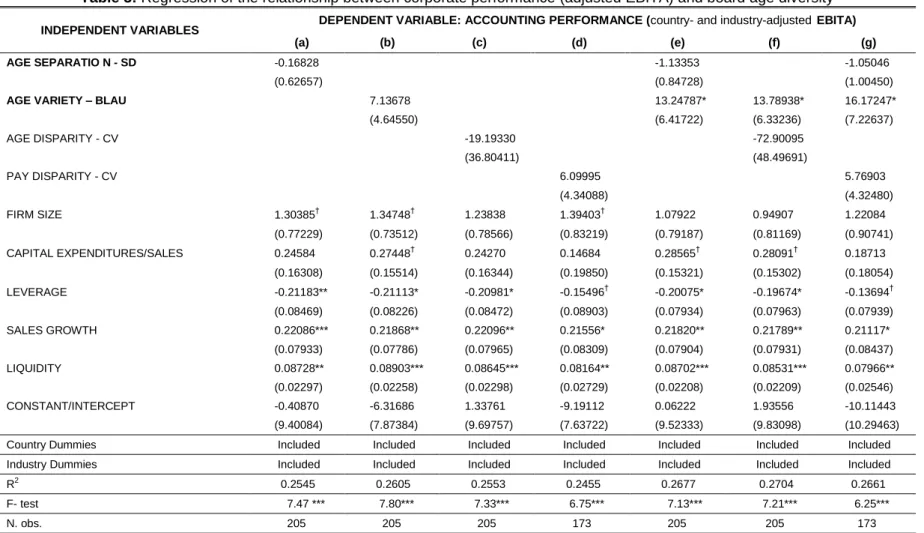
(10) Diversity as disparity is a continuous variable which represents the differences in concentration of power and status in a board. Disparity reflects both the distances between members and the dominance of who have higher amounts of a particular attribute. This asymmetry is captured by the coefficient of variation, which has been used in previous studies to measure disparity (Siegel and Hambrick, 2005). Age diversity could be treated as disparity since age may be positively associated with authority and empowerment, since older members might be seen as possessing higher levels of task-relevant experience and tacit knowledge (Harrison and Klein, 2007). Therefore, the proxy proposed to measure age disparity (AGE DISPARITY) is the coefficient of variation of the age of the board members. However, focusing on board of directors as unit of analysis, maybe age is not a good proxy of power. As suggest Kang et al. (2007), most of the older directors are exmanagers from various corporations that enjoy their retirement by sitting on various boards of companies. This study uses a second measure of disparity that seems to fit better the distribution of power on the board. That is the coefficient of variation of director’s pay (PAY DISPARITY). Note that the director’s pay has been measured by the salary and fee of director. 3.2.3. Control variables Consistent with previous empirical research (Miller and Triana, 2009; Cheng, 2008), the firm specific variables that could affect the corporate performance are: the natural log of total assets as an indicator for size (SIZE); capital expenditures divided by sales as proxy for investment ratio (CAPEX); total debt per unit of total assets as a proxy for capital structure (LEVERAGE); annual growth rate of sales as indicator of growth (GROWTH); and current assets to current liabilities as proxy for liquidity (LIQUIDITY). Additionally, dummy variables are considered to reflect differences between countries (COUNTRY), and insutries (INDUSTRY) using one-digit SIC. 3.3. Methodology In order to test the hypotheses, this study estimates the linear regression model presented in Equation 3. PERFORMANC Ei 0 1 DIVERSITYi 1 SIZEi 2 CAPEX i 3 LEVERAGE i 2. 7. J 1. J 0. (3). 4 GROWTHi 5 LIQUIDITYi J COUNTRYi J INDUSTRYi i. Consistent with previous research (Campbell and Minguez-Vera, 2008; Mahadeo et al., 2012), this equation contains corporate performance as the dependent variable which is explained by board diversity and control variables. The board diversity variable specified in Equation 3 is divided in the. 10.
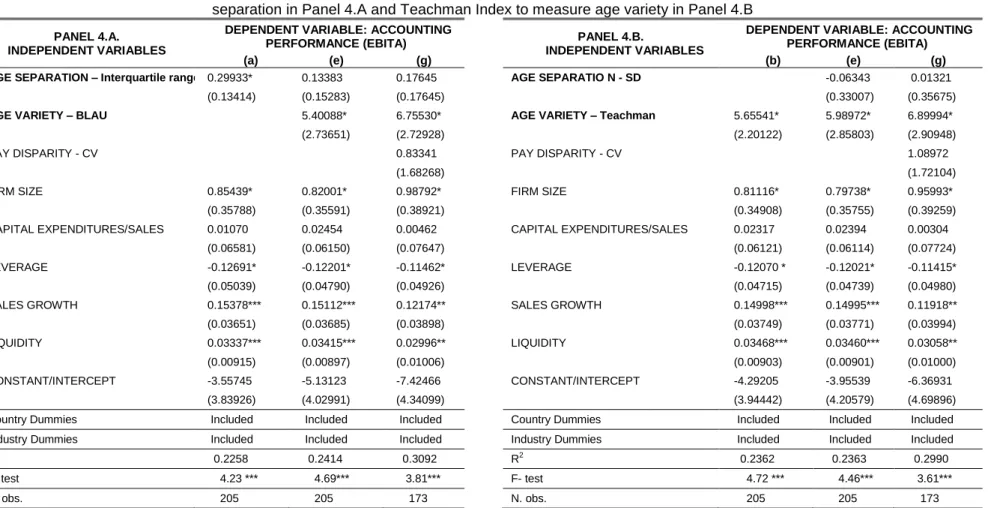
(11) three types of diversity – separation, variety and disparity – with the aim to test their effects on corporate performance. Given the feature of the sample, Equation 3 is regressed by means of OLS. The estimator process uses a robust variance matrix, in particular, White-corrected standard errors in presence of heteroskedasticity. Additionally, the issue of collinearity is explored by means of the variance inflation factors for the independent variables. Note that Equation 3 does not include board size variable because it presents problems of collinearity since it is strongly correlated with firm size variable.. 4. EMPIRICAL RESULTS 4.1. Descriptive Statistics The 205 firms of the sample are from three European countries: United Kingdom (148 firms), Germany (26 firms), and France (31 firms). Table 1 provides descriptive statistics for the sample. The measures of corporate performance indicate that the firms in the sample achieved a good rate of firm value on average – EBITA: 5.85% –, but there is a huge variation in the performance variables among the sample firms. Regarding age diversity of the board, it seems that there is a relatively satisfactory level of heterogeneity in terms of age separation, age variation, and age disparity in the sample. Insert Table 1 about here. 4.2. Age Diversity Tables 2, 3, and 4 report the estimations that test the hypotheses based on accounting performance. Table 2 contains the estimation of regression that uses EBITA as accounting performance, standard deviation of age as separation and Blau’s Index as variety. Table 3 presents the results using the country- and industry-adjusted EBITA as dependent variable. Table 4 reports in panel A the regression that uses interquartile range to measure the diversity as separation and in panel B exhibits the results using Teacham’s Index as proxy for variety. Insert Tables 2-4 about here Focusing on the effect of age diversity of separation on corporate performance, the results indicate that the coefficient of this variable is not statistically significant. This finding does not support Hypothesis 1 presented in the theoretical framework, which predicted that greater differences in age of directors as separation lead to a lower level of corporate performance. It is observed that in model. 11.
(12) (a) – only is included age separation as age diversity – separation as diversity positively affects corporate performance. However, this relationship weakens when the equation takes into account the effect of other types of diversity – Models (e) and (g). The results show that age diversity as variety positively impacts on corporate performance. Therefore, this study finds empirical evidence to support Hypothesis 2, that is, a greater age diversity as variety leads to a higher level of corporate performance. This finding is in line with Harrison and Klein (2007) who argue that variety broadens the cognitive, behavioural repertoire and views of the board and leads to better choices and improvements in performance. Regarding diversity as disparity, this study does not find evidence supporting Hypothesis 3. Therefore, the empirical study does not support the theoretical assumption that inequality in terms of power and status of the board directors leads a lower level of corporate performance. This relationship is not significant using age disparity or pay disparity. In the case of age disparity, one possible explanation of the finding consistent with Kang et al. (2007) could be that the age is not an attribute that reflects the distribution of power of the board. Whit respect to the unexpected results related to pay disparity, one explanation could be that larger difference in pay also lead directors to elicit stronger individual efforts. In fact, Henderson and Fredrickson (2001) find a balance between the arguments that “more equal pay” promotes collaboration, greater coordination and the opposite view that suggest that “larger pay differences” create a tournament-like incentives that better address the monitoring difficulties that arise with joint decision making. These findings are robust to both proxies for accounting performance – EBITA and countryand industry-adjusted EBITA–, both proxies for age diversity as separation – standard deviation of age and interquartile range –, and both proxies for age diversity as variety – Blau’s Index and Teacham’s Index.. 5. CONCLUSION AND DISCUSSION In light of the recent corporate governance developments after the global financial crisis, that have led to changes in the composition of boards to increase their effectiveness, this study aims to explore how board age diversity affects corporate performance. Despite recent corporate governance iniciatives recommend to increase board age diversity, theories predict differing effects of board diversity to corporate performance, and previous research finds inconclusive results. In response of. 12.
(13) these disappointing cumulative results, Harrison and Klein (2007) present a diversity typology which involves differences in the meanings of diversity, maxima, and theoretical relationships with corporate performance. The first type is diversity as separation which refers to differences in position or opinion. The second type is diversity as variety, that represents differences in kind, category, or knowdlege. Finally, diversity as disparity indicates differences in power or status among members of a group. This study develops three hypotheses build on upper echelons perspecitve (Hambrick and Mason, 1984) and Harrison and Klein’s (2007) diversity typology. Focusing on age diversity, wich is one of the demographic diversity less developed and using board of directors as unit of analysis, this study empirically tests the effects of each type of age diversity on corporate performance in a sample of 205 European listed firms for the year 2009. The main result reveals that age diversity defined as generational diversity, positively impacts on corporate performance. That is, teams whose members draw from different generations in a balanced way can traslate greater information richness within a unit, for instance, while the older group can provide experience and wisdom, the middle group carries the major positions of active responsibilities in corporations and in society, whereas the younger group has the energy and plan ahead for the future (Kang et al., 2007). However, this study does not find clear evidence on the impact of age diversity as separation and disparity on corporate performance. The results have important implications for theory, business practice and public policy. First, this study contributes to the theoretical understanding of board diversity and their consequences on corporate performance, since it integrates psychologists, sociologists theories with an management and economic orientation. As Eisenhardt (1989) suggests, theoretical pluralism rather than one dominant theory captures better the complexity of the behavior of boards of directors. Second, it empirically explores novel measures of age diversity of the boards that reflects different types of diversity. Third, this study also examines the impact of the three forms of diversity simultaneously with the aim to isolate, and, hence, analyse the opposite effects of different diversity types on strategic behavior and performance. Fourth, the finding suggests that corporate governance guidelines encourage board generational diversity to adapt different views and make more deliberated decisions in the board, which improve corporate performance. As in any empirical study, the findings presented are subject to some limitation that open new areas for future research. A limitation of this study is that the measures used are sensitive to the size. 13.
(14) of the board. Given this variable presents collinearity problems in the model, it has not been included. Therefore, future studies should address this problem to achive more accurate results. Like in almost any economic research the empirical findings are conditioned by sample and availability of information. Larger samples of business cycle and countries and diversity variables are clearly needed to test the robustness of the results. The results of this study may also be limited by the possible omission of the mediators. In future research, a further extension of this study will consider corporate social responsibility strategies as mediators, since there is a large number of sudies in the literature that conclude that strategic approach to stakeholder management can have positive impacts on financial performance (Berman, et al. 1999; Moneva et al. 2007). To sum up, this study offers new and interesting insights on the consequence of different types of age diversity in board of directors and encourages to future research to consider inegrated views and multiple dimensions of diversity to advance in the understanding of board behaviour and its relationship with corporate results.. REFERENCES Adams, J. S. 1963. Toward an understanding of inequity. Journal of Abnormal and Social Psychology, 67: 422–436. Ashby, W. R. 1956. An introduction to cybernetics. New York: Wiley. Berman, S. L., Wicks, A. C., Kotha, S. and Jones, T. M. 1999. Does stakeholder orientation matter? The relationship between stakeholder management models and firm financial performance. Academy of Management Journal, 42(5): 488–506. Berger, J., Fisek, M. H., Norman, R. Z., and Zelditch, M., Jr. 1977. Status characteristics and expectation states: A graph theoretical formulation. In J. Berger (Ed.), Status characteristics and social interaction: An expectations states approach, pp. 91–134. New York: Elsevier. Bhagat, S. and Bolton, B. 2008. Corporate governance and firm performance. Journal of Corporate Finance, 14: 257-273. Blau, P. M. 1960. Patterns of deviation in work groups. Sociometry, 23: 245–261. Blau, P. M. 1977. Inequality and heterogeneity. New York: Free Press. 14.
(15) Bunderson, J. S., and Sutcliffe, K. M. 2002. Comparing alternative conceptualizations of functional diversity in management teams: Process and performance effects. Academy of Management Journal, 45: 875–893. Byrne, D. 1971. The attraction paradigm. New York: Academic Press. Campbell, D. T. 1960. Blind variation and selective retention in creative thought as in other knowledge processes. Psychological Review, 67: 380–400. Campbell, K. and Minguez-Vera A. 2008. Gender Diversity in the Boardroom and Firm Financial Performance. Journal of Business Ethics, 83: 435-451. Cheng, S. 2008. Board size and the variability of corporate governance. Journal of Financial Economics, 87: 157-176. Clore, G. L., and Byrne, D. A. 1974. A reinforcement-affect model of attraction. In Huston T. L. (Ed.), Foundations of interpersonal attraction, pp. 143–170. New York: Academic Press. COM. 2010. Corporate Governance in Financial Institutitons: Lessons to be drawn from the current financial crisis, best practices. Accompanying document to the Green Paper Corporate governance in financial institutions and remuneration policies. COM (2010) 284. European Commission, Brussels, 2.6.2010. Cornett, M.M., McNutt, J.J. and Tehranian, H. 2009. Corporate governance and earnings management at large US bank holding companies. Journal of Corporate Finance, 15: 412-430. Cummings, A., Zhou. J., and Oldham, G. R. 1993. Demographic differences and employee work outcomes: Effects on multiple comparison groups. Paper presented at the annual meeting of the Academy of Management, Atlanta. GA. Deutsch, M. 1985. Distributive justice: A social psychological perspective. New Haven, CT: Yale University Press. Eisenhardt, K.L. 1989. Agency Theory: A Review and Assessment. Academy of Management Review, 14: 57–74. Faccio, M., Marchica, M-T, Mura, R. 2011. Large shareholder diversification and corporate risk-taking. The Review of Financial Studies, 24 (11): 3601-3641. Ferrero-Ferrero, I., Fernández-Izquierdo, M.A., Muñoz-Torres, M.J. 2012. Age Diversity in the Boardroom: Measures and Implications. In Engemann, Kurt J.; Gil-Lafuente, Anna M.; Merigó-. 15.
(16) Lindahl, José M. (Eds.), Modeling and Simulation in Engineering, Economics, and Management, MS 2012, LNBIP 115, pp. 134-143. Springer-Verlag Berlin Heidelberg. Hambrick, D.C. 2007. Upper echelons theory: an update. Academy of Management Review, 32: 334– 343. Hambrick, D.C. and Mason, P.A. 1984. Upper echelons: the organization as a reflection of its top managers. Academy of Management Review, 9: 193–206. Harrison, D. and Klein, K. 2007. What’s the difference? Diversity constructs as separation, variety, or disparity in organizations, Academy of Management Review, 32: 1199–1228. Henderson, A.D. and Fredrickson, J.W. 2001. Top Management Team Coordination Needs and the CEO Pay Gap: A Competitive Test of Economic and Behavioral Views, The Academy of Management Journal, 44(1): 96-117. Hogg, M. A., and Terry, D. J. 2000. Social identity and selfcategorization processes in organizational contexts. Academy of Management Review, 25: 121–140. Houle, C. O. 1990. Who should be on your board? Nonprofit World, 8: 33–35. Kang, H., Cheng, M., and Gray, J. 2007. Corporate Governance and Board Composition: diversity and independence of Australian boards, Corporate Governance: An Interview Review, 15 (2): 194-207 Kilduff, M., Angelmar, R., and Mehra, A. 2000. Top management-team diversity and firm performance: Examining the role of cognitions. Organization Science, 11: 21–34. Kunce, F., Boehm, S.A., and Bruch H. 2011. Age diversity, age discrimination climate and performance consequences – a cross organizational study. Journal of Organizational Behavior, 32: 264-290. Lazear, E. P. 1995. Personnel economics. Cambridge, MA: MIT Press. Lazear, E., and Rosen, S. 1981. Rank-order tournaments as optimum labor contracts. Journal of Political Economy, 89: 841–864. Mahadeo, D. Soobaroyen, T., and Hanuman V.O. 2012. Board Composition and Financial Performance: Uncovering the Effects of Diversity in an Emerging Economy. Journal of Business Ethics, 105(3): 375-388. Miller T. and Triana, M.C. 2009. Demographic Diversity in the Boardroom: Mediators of the Board Diversity- Firm Performance Relationship, Journal of Management Studies, 46 (5): 755-786.. 16.
(17) Milliken, F.J. and Martins, L.L. 1996. Searching for common threads: understanding the multiple effects of diversity in organizational groups. Academy of Management Journal, 21:402–433. Moneva, J.M., Rivera-Lirio, J.M., Muñoz-Torres, M.J. 2007. The corporate stakeholder commitment and social and financial performance. Industrial Management and Data Systems, 107:84-102. Murray, A. I. 1989. Top management group heterogeneity and firm performance. Strategic Management Journal, 10: 125–141. Nielsen, S. 2010. Top management team diversity: a review of theories and methodologies. International Journal of Management Reviews, 12(3): 301-316. Shore L.M., Chung-Herrera, B.G., Dean, M.A., Ehrhart, K.H., Jung, D.I., Randel, A.E., Singh, G. 2009. Diversity in organizations: Where are we now and where are we going?. Human Resource Management Review, 19: 117-133. Siegel, P.A. and Hambrick, D.C. 2005. Pay Disparities Within Top Management Groups: Evidence of Harmful Effects on Performance of High-Technology Firms, Organization Science, 16(3): 259274. Suvillan S.E., Forret, M.L., Carraher, S.M., Mainiero, L. 2009. Using the kaleidoscope carrer model to examine generational differences in work attitudes. Career Development International, 14(3):284-302. Tajfel, H., and Turner, J. C. 1979. An integrative theory of intergroup conflict. In W. G. Austin and S. Worchel (Eds.), The social psychology of intergroup relations, pp. 33– 47. Monterey, CA: Brooks/Cole. Talke, K., Salomo, S., and Rost, K. 2010. How top management team diversity affects innovativeness and performance via the strategic choice to focus on innovation fiels, Research Policy, 39: 907-918. Teachman, J. D. 1980. Analysis of population diversity. Sociological Methods and Research, 8: 341– 362. Twenge, J.M., Campbell, S.M., Hoffman B.J., and Lance C.E. 2010. Generational Differences in Work Values: Leisure and Extrinsic Values Increasing, Social and intrinsic Values Decreasing, Journal of Management, 36 (5): 1117-1142. 17.
(18) Zimmerman, M.A. 2008. The Influence of Top Management Team Heterogeneity on the Capital Raised through an Initial Public Offering. Entrepreneurship Theory and Practice, 32(3): 391414.. 18.
(19) Figure 1: Illustrations of the empirical levels of age diversity as separation, variety and disparity. Minimum. Median. Maximum. AGE DIVERSITY AS SEPARATION - Standard Deviation 7.0225. 14.4706. 60 45. 90. 3 2 0. 30. 0. 0. 1. 1. 1. Frequency. Frequency. Frequency. 2. 2. 3. 3. 1.2248. 30. 75. 45. age. 60 age. 75. 90. 30. 45. 60 age. 75. 90. 75. 90. Interquartile range 1.5000. 23.0000. 30. 45. 60 age. 75. 90. 3 2 Frequency. 1 0. 0. 0. 1. 1. Frequency. Frequency. 2. 2. 3. 3. 9.2500. 30. 45. 60 age. 75. 90. 30. 45. 60 age. 19.
(20) Minimum. Median. Maximum. AGE DIVERSITY AS VARIETY - Blau’s Index 0.6300 3. 0.9796. 2 Frequency. 30. 45. 60 age. 75. 90. 1 0. 0. 0. 1. 1. Frequency. Frequency. 2. 2. 3. 3. 0.0000. 30. 45. 60 age. 75. 90. 30. 45. 60 age. 75. 90. Teachman’s Index 0.0000. 1.0790. 30. 45. 60 age. 75. 90. 3 2 1 0. 0. 0. 1. 1. Frequency. Frequency. Frequency. 2. 2. 3. 3. 0.6365. 30. 45. 60 age. 75. 90. 30. 45. 60 age. 75. 90. 20.
(21) Minimum. Median. Maximum. AGE DIVERSITY AS DISPARITY – Coefficient of Variation 0.6300. 0.2445. 60. 90. 45. 75. 3 2 0. 30. 0. 0. 1. 1. 1. Frequency. Frequency. Frequency. 2. 2. 3. 3. 0.0204. 30. age. 45. 60 age. 75. 90. 30. 45. 60 age. 75. 90. PAY DIVERSITY AS DISPARITY – Coefficient of Variation 0.2599. 2.9079 6 4 Frequency. 0. 300000. 600000. 900000 pay. 1200000. 1500000. 1800000. 0. 0. 0. 2. 2. 2. Frequency. Frequency. 4. 4. 6. 6. 0.9806. 0. 300000. 600000. 900000 pay. 1200000. 1500000. 1800000. 0. 300000. 600000. 900000 pay. 1200000. 1500000. 1800000. 21.
(22) Table 1: Descriptive statistics VARIABLE (PROXY). Mean. S.D.. PERFORMANCE (EBITA). 5.8498. 9.0976. AGE DIVERSITY AS SEPARATION (Standard Deviation). 7.2898. AGE DIVERSITY AS SEPARATION (Interquartile range –years-). 25th P.. Median. 75th P.. Max.. -28.8477. 1.6438. 5.8863. 10.4546. 56.7068. 2.0866. 1.2248. 5.8310. 7.0225. 8.5049. 14.4706. 9.6538. 3.7206. 1.5000. 7.0000. 9.2500. 12.0000. 23.0000. AGE DIVERSITY AS VARIETY (Blau’s Index). 0.5741. 0.2487. 0.0000. 0.4167. 0.6300. 0.7456. 0.9796. AGE DIVERSITY AS VARIETY (Teachman’s Index). 0.6087. 0.2661. 0.0000. 0.4506. 0.6365. 0.8018. 1.0790. AGE DIVERSITY AS DISPARITY (Coefficient of Variation). 0.1284. 0.0377. 0.0204. 0.1014. 0.1241. 0.1507. 0.2445. PAY DIVERSITY AS DISPARITY (Coefficient of Variation). 1.1023. 0.4122. 0.2599. 0.8475. 0.9806. 1.2866. 2.9079. SIZE Ln (total assets). 7.7807. 2.37420. 2.3805. 5.6566. 7.6317. 9.99860. 5.6266. CAPEX (Capital expenditures/sales). 4.5773. 4.0853. 0.0300. 1.7400. 3.3700. 6.4300. 21.8500. LEVERAGE (Total debt/total assets). 26.1023. 16.1525. 0.0084. 14.5144. 24.6890. 34.6998. 106.9120. GROWTH (Annual growth rate of sales). 1.2876. 17.8179. -50.900. -9.7600. 0.6400. 10.8300. 72.5900. 135.8166. 80.1010. 23.4792. 87.5009. 121.8047. 159.4942. 792.4195. LIQUIDITY (Current assets/current liabilities). Min.. The table shows the descriptive statistics of the variables using firms listed in FTSE 100, FTSE SMALL CAP, DAX 30, and CAC 40 for year 2009.. 22.
(23) Table 2: Regression of the relationship between corporate performance (EBITA) and board age diversity DEPENDENT VARIABLE: ACCOUNTING PERFORMANCE (EBITA). INDEPENDENT VARIABLES (b). (a) AGE SEPARATION - SD. 0.44494. (c). (d). †. (f). -0.04381. (0.26030) AGE VARIETY – BLAU. (e). 0.01924. (0.30829). (0.33712). 6.47194**. 6.70814*. 6.98151*. 7.92482**. (2.36429). (2.88581). (2.84977). (2.96340). AGE DISPARITY - CV. 21.60799. -5.58401. (15.44931) PAY DISPARITY - CV. (18.27085) 1.12297. 0.94200. (1.7950) FIRM SIZE. (g). (1.70433). 0.89402*. 0.79065*. 0.90660*. 0.88143*. 0.78028*. 0.76013*. 0.94499*. (0.36440). (0.34767). (0.36833). (0.38585). (0.35967). (0.36361). (0.39539). 0.00360. 0.02332. 0.00447. -0.02002. 0.02375. 0.02381. 0.00170. (0.06711). (0.06101). (0.06686). (0.08737). (0.06109). (0.06085). (0.07647). -0.12417*. -0.11896*. -0.12448*. -0.11838*. -0.11856*. -0.11786*. -0.11224*. (0.05041). (0.04666). (0.04997). (0.05673). (0.04691). (0.04675). (0.04893). 0.15122***. 0.14989***. 0.15138***. 0.12309**. 0.14987***. 0.14983***. 0.11920**. (0.03714). (0.03418). (0.03732). (0.03963). (0.03745). (0.03754). (0.03934). 0.03424***. 0.03499***. 0.03447***. 0.02940**. 0.03410***. 0.03390***. 0.03004**. (0.00927). (0.00897). (0.00929). (0.01050). (0.00899). (0.00898). (0.01005). -4.36272. -4.37083. -4.04145. -1.23657. -4.12427. -3.73871. -6.50016. (4.24795). (3.87366). (4.35857). (3.79548). (4.2346). (4.33857). (4.72467). Country Dummies. Included. Included. Included. Included. Included. Included. Included. Industry Dummies. Included. Included. Included. Included. Included. Included. Included. 0.2196. 0.2390. CAPITAL EXPENDITURES/SALES LEVERAGE SALES GROWTH LIQUIDITY CONSTANT/INTERCEPT. 2. R. 0.2389. 0.2170. 0.2546. 0.2392. 0.3042. F- test. 4.20 ***. 5.00***. 4.24***. 3.03***. 4.70***. 4.71***. 3.83***. N. obs.. 205. 205. 205. 173. 205. 205. 173. The table reports regression results of corporate performance using OLS estimator. Corporate performance (EBITA) is measured by earnings before interests and taxes divided by book value of total assets, AGE SEPARATION by standard deviation of the age of directors, AGE VARIETY by Blau’s Index, AGE DISPARITY by coefficient of variation of the age of directors, PAY DISPARITY by coefficient of variation of director’s pay, FIRM SIZE by natural log of total assets as an indicator for size, CAPITAL EXPENDITURES/SALES by capital expenditures divided by sales as proxy for investment ratio, LEVERAGE by total debt per unit of total assets as a proxy for capital structure, SALES GROWTH by annual growth rate of sales as indicator of growth, LIQUIDITY by current assets to current liabilities as proxy for liquidity. Robust standard errors are in brackets. † p<0.10; *p<0.05; **p<0.01; ***p<0.001.. 23.
(24) Table 3: Regression of the relationship between corporate performance (adjusted EBITA) and board age diversity DEPENDENT VARIABLE: ACCOUNTING PERFORMANCE (country- and industry-adjusted EBITA). INDEPENDENT VARIABLES. (b). (a) AGE SEPARATIO N - SD. (c). (d). (e). (f). -0.16828. -1.13353. (0.62657). (0.84728). AGE VARIETY – BLAU. (g) -1.05046 (1.00450). 7.13678. 13.24787*. 13.78938*. 16.17247*. (4.64550). (6.41722). (6.33236). (7.22637). AGE DISPARITY - CV. -19.19330. -72.90095. (36.80411). (48.49691). PAY DISPARITY - CV. 6.09995. 5.76903. (4.34088) FIRM SIZE. 1.30385. †. (0.77229) CAPITAL EXPENDITURES/SALES. 1.34748. †. (0.73512) †. †. 1.23838. 1.39403. (0.78566). (0.83219). 0.24270. 0.14684. (0.16344). (0.19850). -0.21113*. -0.20981*. -0.15496. (0.08469). (0.08226). (0.08472). 0.22086***. 0.21868**. 0.22096**. (0.07933). (0.07786). 0.08728**. 0.08903***. (0.02297). †. 1.22084 †. (0.90741). (0.15302). (0.18054). -0.20075*. -0.19674*. -0.13694. (0.08903). (0.07934). (0.07963). (0.07939). 0.21556*. 0.21820**. 0.21789**. 0.21117*. (0.07965). (0.08309). (0.07904). (0.07931). (0.08437). 0.08645***. 0.08164**. 0.08702***. 0.08531***. 0.07966**. (0.02258). (0.02298). (0.02729). (0.02208). (0.02209). (0.02546). -0.40870. -6.31686. 1.33761. -9.19112. 0.06222. 1.93556. -10.11443. (9.40084). (7.87384). (9.69757). (7.63722). (9.52333). (9.83098). (10.29463). Country Dummies. Included. Included. Included. Included. Included. Included. Included. Industry Dummies. Included. Included. Included. Included. Included. Included. Included. R2. 0.2545. 0.2605. 0.2553. 0.2455. 0.2677. 0.2704. 0.2661. CONSTANT/INTERCEPT. (0.15514). -0.21183**. (0.81169). (0.15321). LIQUIDITY. (0.16308). (0.79187). 0.18713. SALES GROWTH. 0.27448. 0.94907. 0.28091. LEVERAGE. 0.24584. (4.32480) 1.07922. 0.28565 †. †. F- test. 7.47 ***. 7.80***. 7.33***. 6.75***. 7.13***. 7.21***. 6.25***. N. obs.. 205. 205. 205. 173. 205. 205. 173. The table reports regression results of corporate performance using OLS estimator. Corporate performance (adjusted EBITA) is measured by the difference between a firm’s EBITA and the avarage EBITA across all listed firms in the same two-digit SIC and from the country in which the company is registered, AGE SEPARATION by standard deviation of the age of directors, AGE VARIETY by Blau’s Index, AGE DISPARITY by coefficient of variation of the age of directors, PAY DISPARITY by coefficient of variation of director’s pay, FIRM SIZE by natural log of total assets as an indicator for size, CAPITAL EXPENDITURES/SALES by capital expenditures divided by sales as proxy for investment ratio, LEVERAGE by total debt per unit of total assets as a proxy for capital structure, SALES GROWTH by annual growth rate of sales as indicator of growth, LIQUIDITY by current assets to current liabilities as proxy for liquidity. Robust standard errors are in brackets. † p<0.10; *p<0.05; **p<0.01; ***p<0.001.. 24.
(25) Table 4: Regression of the relationship between corporate performance (EBITA) and board age diversity, using interquartile range to measure age separation in Panel 4.A and Teachman Index to measure age variety in Panel 4.B PANEL 4.A. INDEPENDENT VARIABLES. DEPENDENT VARIABLE: ACCOUNTING PERFORMANCE (EBITA) (a) (e) (g). AGE SEPARATION – Interquartile range 0.29933* (0.13414) AGE VARIETY – BLAU. 0.13383. 0.17645. (0.15283). (0.17645). 5.40088*. 6.75530*. (2.73651). (2.72928). PAY DISPARITY - CV. 0.83341. PANEL 4.B. INDEPENDENT VARIABLES. DEPENDENT VARIABLE: ACCOUNTING PERFORMANCE (EBITA) (b) (e) (g). AGE SEPARATIO N - SD AGE VARIETY – Teachman. -0.06343. 0.01321. (0.33007). (0.35675). 5.65541*. 5.98972*. 6.89994*. (2.20122). (2.85803). (2.90948). PAY DISPARITY - CV. 1.08972. (1.68268) FIRM SIZE. 0.85439*. 0.82001*. 0.98792*. (0.35788). (0.35591). (0.38921). 0.01070. 0.02454. 0.00462. (0.06581). (0.06150). (0.07647). -0.12691*. -0.12201*. -0.11462*. (0.05039). (0.04790). (0.04926). 0.15378***. 0.15112***. 0.12174**. (0.03651). (0.03685). (0.03898). 0.03337***. 0.03415***. 0.02996**. (0.00915). (0.00897). (0.01006). -3.55745. -5.13123. -7.42466. (3.83926). (4.02991). (4.34099). Country Dummies. Included. Included. Included. Industry Dummies. Included. Included. R2. 0.2258. 0.2414. CAPITAL EXPENDITURES/SALES LEVERAGE SALES GROWTH LIQUIDITY CONSTANT/INTERCEPT. (1.72104) FIRM SIZE. 0.81116*. 0.79738*. 0.95993*. (0.34908). (0.35755). (0.39259). 0.02317. 0.02394. 0.00304. (0.06121). (0.06114). (0.07724). -0.12070 *. -0.12021*. -0.11415*. (0.04715). (0.04739). (0.04980). 0.14998***. 0.14995***. 0.11918**. (0.03749). (0.03771). (0.03994). 0.03468***. 0.03460***. 0.03058**. (0.00903). (0.00901). (0.01000). -4.29205. -3.95539. -6.36931. (3.94442). (4.20579). (4.69896). Country Dummies. Included. Included. Included. Included. Industry Dummies. Included. Included. Included. 0.3092. R2. 0.2362. 0.2363. 0.2990. CAPITAL EXPENDITURES/SALES LEVERAGE SALES GROWTH LIQUIDITY CONSTANT/INTERCEPT. F- test. 4.23 ***. 4.69***. 3.81***. F- test. 4.72 ***. 4.46***. 3.61***. N. obs.. 205. 205. 173. N. obs.. 205. 205. 173. The table reports regression results of corporate performance using OLS estimator. Corporate performance (EBITA) is measured by earnings before interests and taxes divided by book value of total assets, AGE SEPARATION by interquartile range of the age of directors in Panel 4.A. and standard deviation of the age of directors in Panel 4.B., AGE VARIETY by Blau’s Index in Panel 4.A. and Teachman’s Index in Panel 4.B., PAY DISPARITY by coefficient of variation of director’s pay, FIRM SIZE by natural log of total assets as an indicator for size, CAPITAL EXPENDITURES/SALES by capital expenditures divided by sales as proxy for investment ratio, LEVERAGE by total debt per unit of total assets as a proxy for capital structure, SALES GROWTH by annual growth rate of sales as indicator of growth, LIQUIDITY by current assets to current liabilities as proxy for liquidity. Robust standard errors are in brackets. † p<0.10; *p<0.05; **p<0.01; ***p<0.001.. 25.
(26)
(27)
Figure

+2
Documento similar