Desing of a deterministic closed loop supply chain model for a product, with returns in the same period and following period
106
0
0
Texto completo
(2)
(3)
(4) DEDICATION. To my parents Rosario Garza and Eloy Aguilera that thanks to them I am in this place thanks to their support and unconditional love and to teach me that when you propose what you want you can achieve it. To my sisters Verónica and Violeta because they have always supported me in all the decisions I make and do during my life.. IV.
(5) ACKNOWLEDGEMENTS I thank God first for allowing me to be alive and healthy and for the blessings given to me and my family. To my Family for all their support throughout my life. I would like to thank Instituto Tecnológico y de Estudios Superiores de Monterrey for giving me the opportunity to continue learning. To Dr. Jose Luis Gonzalez Velarde for his teachings, time and dedication to carry out this research, as well as to Doctors Daniel Zavala Río and Jose Manuel Sanchez for their feedback on this document. To the Mechanical Engineering department for giving me the opportunity to work as an assistant in the mechanics department. And finally, to all my old and new friends who supported me and believed in me and were part of this great story.. V.
(6) VI.
(7) Design of a deterministic closed-loop supply chain model for a product, with returns in the same period and following period by Héctor Eloy Aguilera Garza. Abstract The following work presents the study of a closed-loop supply chain problem, considering a single product with returns in the same period and in a subsequent period, considering only a deterministic model. The paper proposes a mixed integer mathematical model, which considers strategic and operational decisions, aimed at minimizing the expected total annual costs of the network considering different types of costs such as infrastructure costs, variable costs and operating profits. A computational experiment is presented in which the model is analyzed, the rate of return and recovery and the rescue value, and compared with another model created where the returns are only made within the same period.. VII.
(8) TABLE OF CONTENTS Abstract ............................................................................................................................... VII List of Tables ........................................................................................................................ XI List of Figures ..................................................................................................................... XII Chapter 1 .............................................................................................................................. 13 Introduction ....................................................................................................................... 13 1.1. Problem statement.................................................................................................. 13. 1.2. Objectives .............................................................................................................. 16. 1.3. Justification ............................................................................................................ 17. 1.4. Scope and limitations ............................................................................................. 18. 1.5. Structure of the thesis ............................................................................................ 18. Chapter 2 .............................................................................................................................. 20 Theoretical framework ...................................................................................................... 20 2.1. Definition of logistics ............................................................................................ 20. 2.2. What is a Supply Chain? ........................................................................................ 21. 2.3. Reverse logistic introduction ................................................................................. 24. 2.3.1. What is reverse logistic? ................................................................................. 25. 2.3.2. Why apply reverse logistic? ........................................................................... 26. 2.3.3. Reverse logistic and forward logistic ............................................................. 28. 2.3.4. Advantages and Disadvantages of Reverse Logistics .................................... 30. 2.3.5. Reverse logistics process ................................................................................ 31. 2.4. Close-Loop Supply chain ....................................................................................... 34. 2.4.1. Reverse logistics and closed-loop supply chains models ............................... 36. 2.4.2. Design of logistics networks in the supply chain ........................................... 41 VIII.
(9) 2.4.2.1 Strategic Supply Chain Planning ................................................................ 41 2.4.2.2 Network Structure ....................................................................................... 42 2.4.2.3 Optimization of the Supply Chain .............................................................. 43 2.5. Previous literature related to quantitative models for the analysis of reverse. logistics systems. .............................................................................................................. 45 2.5.1. Reuse models .................................................................................................. 45. 2.5.2. Recycling Models ........................................................................................... 46. 2.5.3. Remanufacturing Models ............................................................................... 49. Chapter 3 .............................................................................................................................. 51 Problem statement and formulation .................................................................................. 51 3.1. Model description .................................................................................................. 52. 3.2. Deterministic model Formulation .......................................................................... 54. 3.2.1. Indexes:........................................................................................................... 54. 3.2.2. Parameters: ..................................................................................................... 55. 3.2.3. Decision variables: ......................................................................................... 56. 3.2.3.1 Binary Variables: ........................................................................................ 56 3.2.3.2 Continuous variables: ................................................................................. 56 3.2.4. Subject to: ....................................................................................................... 57. 3.2.4.1 Balance: ...................................................................................................... 57 3.2.4.2 Capacity: ..................................................................................................... 59 3.2.4.3 Transportation: ............................................................................................ 60 3.2.4.4 No negativity: ............................................................................................. 60 3.2.4.5 Binary variables: ......................................................................................... 61 3.2.5. Objective function .......................................................................................... 61 IX.
(10) 3.2.5.1 Infrastructure Fixed Costs (IFC): ................................................................ 61 3.2.5.2 Variable operating costs (VOC): ................................................................ 62 3.2.5.3 Operating Benefits (OB): ............................................................................ 62 3.2.5.4 Objective function general .......................................................................... 62 3.3. Solution Methodology ........................................................................................... 63. Chapter 4 .............................................................................................................................. 64 Discussion of experimental results ................................................................................... 64 4.1. Instance Generation ............................................................................................... 64. 4.1.1. Instance size .................................................................................................... 64. 4.1.2. Assigning values to parameters ...................................................................... 65. 4.1.3. Instances ......................................................................................................... 69. 4.2. Computational experiments ................................................................................... 70. 4.2.1. Analysis of results .......................................................................................... 71. Chapter 5 .............................................................................................................................. 80 Conclusions ....................................................................................................................... 80 Future lines of research ..................................................................................................... 82 Appendix A. Names of instances of experimentation .......................................................... 84 Appendix B. coding of the model in AMPL ........................................................................ 88 Appendix C. Rescue Value ................................................................................................... 90 References .......................................................................................................................... 102. X.
(11) List of Tables Table 2.1 important aspects about reverse logistics and forward logistics .......................... 29 Table 2.2 Quantitative models for reuse (Rubio Lacoba, 2003) .......................................... 46 Table 2.3 Quantitative models for recycling (Rubio Lacoba, 2003) .................................. 48 Table 2.4 Remanufacturing models. (Rubio Lacoba, 2003) ................................................ 50 Table 4.1 Instance size classification ................................................................................... 65 Table 4.2 Names of the Instances of group A ...................................................................... 70 Table 4.3 Average value of vr for the instances of group A subgroup θ = 20, γ = 30 ......... 71 Table 4.4 Average of the total expected cost and solution time and comparison of the instances of group A combination θ = 20, γ = 30 ................................................................. 72 Table 4.5 Average of the objective function and time of solution of both models and differences of group A .......................................................................................................... 73 Table 4.6 Average of the objective function and time of solution of both models and differences of group B .......................................................................................................... 74 Table 4.7 Average of the objective function and time of solution of both models and differences of group C .......................................................................................................... 75 Table 4.8 Average of the objective function and time of solution of both models and differences of group D .......................................................................................................... 76. XI.
(12) List of Figures Figure 1.1 Schematic of the Closed-Loop Supply Chain .................................................... 16 Figure 2.2 The planning Triangle in Relation to the principal Activities of logistics/Supply Chain Management (Ballou, 2004) ...................................................................................... 24 Figure 2.3 Comparison of reverse logistics and green logistics (Roger & Ronald, 2001) .. 26 Figure 2.4 Forms of recovery depending on the destination of flows (Mier, 2008)............ 28 Figure 2.5 Integrated supply chain where service, product recovery, and waste management activities are included (Thierry et al., 1995) ................................................... 32 Figure 2.6 Integral supply chain and research focus(Harold R. Krikke, 1998) ................... 35 Figure 2.7 Logistics network integrates(Flórez et al., 2012) ............................................... 36 Figure 2.8 Independent reverse logistics processes (Blumberg, 2005) ............................... 38 Figure 2.9 Typical high tech closed loop supply chain(Blumberg, 2005)........................... 39 Figure 2.10 Alternative high tech closed loop supply chain(Blumberg, 2005) ................... 40 Figure 2.11 Closed loop supply chain in consumer goods (Blumberg, 2005) .................... 40 Figure 2.12 Strategic Logistics Planning process (O & S, 2010) ........................................ 42 Figure 3.1 Research Logistic Network ................................................................................ 52 Figure 4.1 Average of the total cost of both models of group A ......................................... 77 Figure 4.2 Average of the total cost of both models of group B ......................................... 78 Figure 4.3 Average of the total cost of both models of group C ......................................... 78 Figure 4.4 Average of the total cost of both models of group D ......................................... 79. XII.
(13) Chapter 1 Introduction 1.1 Problem statement Logistics as a discipline began in the military area, where the problem lay in the supply of necessary goods and services required for the development of military activity, but it was only after World War II that the concept of Logistics began to take on broad significance for the business sector. Currently, logistics has a key place in any company because of the importance of having the products arrive in the most effective way to the customer. But why is the Logistics area a very important factor when making decisions within any organization? this is because their decisions are fundamental for the reduction of final costs for the company, as well as reduce waste, minimize Pollution, save energy, conserve natural resources and reduce carbon emissions.(Bloemhof-Ruwaard, van Beek, Hordijk, & Van Wassenhove, 1995). Once the companies adopted this discipline noticed that there were more problems because traditionally the producers did not pay attention to the final destiny of its products once used by the consumer. The producers did not feel responsible for what happened to these products after their use by the consumer. The products were designed in such a way that the costs of material, assembly and distribution were minimized, but their final disposal was not considered. "They believed that if they incorporated these requirements, the costs would increase. In addition, most consumers were not prepared to pay an additional cost for consuming a green product. In fact, most of the products used ended up in a landfill or were. 13.
(14) incinerated, thus damaging the environment. "(Pérez, Rodríguez-Badal, & Sabriá, 2003) and it was at that moment that a new concept emerged within logistics: reverse logistics. There are many reasons why we should implement reverse logistics, of which the most outstanding are: • Cost Benefit Considerations: Recovery of the value of recyclable packaging, packaging and management units, which means a reduction of costs for the organization. • Legal requirements: Protection to health and the environment. • Social responsibility: The consumer is increasingly looking for safe and environmentally friendly products. The reverse logistics model distinguishes between the chain that pushes the product from raw material to final product and the chain that collects products and waste to recycle, reuse and incorporate them into the market. When a company controls the two chains back and forth we have a closed-circuit supply chain. A good closed loop supply chain program includes traditional supply chain activities forward and supply chain activities backwards which can generate significant cost savings for the company. Among the most important points in the closed-loop supply chain is the logistics network design, which consists of production centers, suppliers, warehouses, distribution centers, customers, collection and recovery centers and secondary markets, Within the logistic network design also includes determining the number and location of centers and flow between each of them.. 14.
(15) For this research, a closed-circuit supply chain (see Figure 1.1) is made up of plants, customers, recovery centers and the secondary market, with planning divided into periods, the first link being the plants which manufactures the Raw material in a single product and are responsible for distributing it to its customers, each plant can serve more than one customer and its production capacities are fixed and linked to customer demand. The plants receive the orders of the client and carry out the scheduling of production per the orders received. Afterwards, the products that are returned by the customers are collected and sent to the recovery centers in the same period or in the following period, where they are inspected and classified, if the returned product is in good condition repairs and are sent back to the plants to meet customer demand for the next period or can be sold to the secondary market, otherwise if it is in bad (non-repairable) condition they are discarded. Strategic and operational decisions include the number of plants and their location as well as recovery centers, the flow of product sent from plants to customers in each planning period, from customers to recovery centers either in the Same period or in the following period, from recovery centers to plants and the secondary market, as well as infrastructure costs, variable costs, operating profits, the objective is to minimize the total expected annual cost of the Closed-circuit supply chain.. 15.
(16) Plants. Costumers. Recovery center. Secondary Market. Figure 1.1 Schematic of the Closed-Loop Supply Chain. 1.2 Objectives The main objective of the research is to design a closed loop supply chain model for a multilevel, multi-stage, multiperiod product with returns in the same period and / or in the following period using a deterministic optimization model. With the above mentioned the following specific objectives are broken down: - Review the literature related to supply chain problems with known values in the parameters, studying their objectives and methodologies. - Formulate mixed integer linear programming deterministic model of the problem. - Find the expected annual total minimum cost in the network.. 16.
(17) - Validate the proposed deterministic model through the execution of computational experiments to determine the effect of some parameters on the product flow and the expected total cost. - Compare the computational results with another model.. 1.3 Justification Currently, to meet customer needs, companies are trying to improve their production processes, reduce costs and thus maximize their profitability to remain within the market. According to (Pishvaee, Jolai, & Razmi, 2010) The emphasis on productivity and customer satisfaction leads firms to focus on the supply chain and integrated logistics. Thus, an effective, efficient and robust logistics network becomes a sustainable competitive advantage for firms and helps them to cope with increasing environmental turbulence and more intense competitive pressures. Many firms have focused on remanufacturing initiatives over the past decade. Dell, GM, and HP are only a few prominent examples. Kodak and Xerox became pioneers in their industries by adopting successful remanufacturing practices for single-use cameras and refillable toner cartridges, respectively. The financial success, coupled with the environmental benefits, attained by these companies has been instrumental to the current interest in remanufacturing. However, widespread adoption of remanufacturing still encounters obstacles that include a lack of quantitative decision-making tools that address the unique challenges of the underlying supply chain networks.(Üster, Easwaran, Akçali, & Çetinkaya, 2007).. 17.
(18) In recent years, few studies have examined the design of integrated logistics networks, plus most of the investigations only consider product returns in the same period. Efficient implementation requires appropriate logistics structures to be set up for the arising goods flow from users to producers (Mortiz Fleischmann, Ronald, & Dekker, 2000). It is for the above that the present investigation approaches a problem of design of a supply chain of closed circuit for a single product, multiperiod, multilevel, multistage and with shipments in the same period and / or in the following period because the assumptions which are considered are more attached to what is nowadays.. 1.4 Scope and limitations The research work is focused on companies engaged in activities of production, distribution, collection, recovery and reintegration of products to the supply chain, considering a fixed demand, as well as the quantities of products returned from customers to the centers Recovery in different periods, and variable costs. Research has limitations such as: - The model only considers a single product - The quantities of product returned from customers to recovery centers can be in the same period or in the period that follows.. 1.5 Structure of the thesis The following research is divided into five chapters, each chapter details in a general way, in the first chapter it focuses on the description of the problem, the objectives, justification and the scope and limitations of the research work. The second chapter presents the theoretical 18.
(19) framework in conjunction with the literature related to the problem addressed. In chapter three the problem is described with a deterministic approach with the proposed mathematical formulation. Chapter four details the computational experimentation and the results that were obtained from this experiment, to conclude in chapter five the conclusions and recommendations of the research problem are described.. 19.
(20) Chapter 2 Theoretical framework 2.1 Definition of logistics The logistics term is a practically new field of study compared to areas such as finance, marketing and / or production, has a very wide application, has been used as support in military operations, in fields of human knowledge and most used in the sector Business. The specificity of this discipline, characterized by an important meticulousness in the determination of standards and methods of analysis, design and operation, has been extended to the field of general business to the extent that it has been necessary to plan and operate increasingly complex systems. Some examples may be the operation of ATM systems, an amusement park, an airline or a hospital (Carranza & Sabrià, 2005). Logistics as a business activity, has different functions ranging from production, supply and storage to distribution and consumption, therefore, there are also different definitions for logistic term, such as dictionary definition which says: "Branch of military science related to procuring, maintaining and transporting material, personnel and facilities”(Webster’s New Encyclopedic Dictionary, 1993). The previous concept puts logistics in the military area, given that the objectives and business activities are different from the military, the definition fails to capture the concept of business logistics. However, a clearer definition of business logistics is enacted by Council of Supply Chain Management Professionals (CSCMP) which describes it as:. 20.
(21) Logistics management is that part of supply chain management that plans, implements, and controls the efficient, effective forward and reverses flow and storage of goods, services and related information between the point of origin and the point of consumption to meet customers' requirements (Professionals, 2013). This definition is more accepted since it tells us that the flows of the product are controlled from the product is still raw material to the point of consumption. However, as mentioned at the beginning of the definition, logistics is part of the process of Supply chain, so it is necessary to address the issue of the supply chain process, which emphasizes the interactions of logistics that take place between the functions of marketing, logistics and production in a company.(Ballou, 2004).. 2.2 What is a Supply Chain? The strong competition that is present in the current market due to the demands of the customers and to the new products with short life cycles, have led companies to pay more attention to their supply chains and to work in conjunction with the technological advances that There is nowadays both communication and transportation. To do this, it is necessary to encompass all the components of the supply chain from suppliers to the end customer. A typical supply chain, also known as a logistics network, is made up of suppliers, manufacturing centers, warehouses, distribution centers and points of sale, as well as raw materials, in-process inventories and finished products flowing between the facilities as Is shown in the figure 2.1 (Simchi-Levi, Kaminsky, & Simchi-Levi, 2003).. 21.
(22) Figure 2.1 Logistics Network (Simchi-Levi et al., 2003). There are several definitions for the administration of the supply chain (SCM) that show us the breadth of this concept which are presented below: For the Council of Supply Chain Management Professionals, the Supply Chain Management encompasses the planning and management of all activities involved in sourcing and procurement, conversion, and all logistics management activities. Importantly, it also includes coordination and collaboration with channel partners, which can be suppliers, intermediaries, third-party service providers, and customers. Supply chain management integrates supply and demand management within and across companies. Supply Chain Management is an integrating function with primary responsibility for linking major business functions and business processes within and across companies into a cohesive and highperforming business model. It includes all the logistics management activities noted above, as well as manufacturing operations, and it drives coordination of processes and activities 22.
(23) with and across marketing, sales, product design, finance and information technology (Professionals, 2013). On the other hand (Simchi-Levi et al., 2003) tell us: Supply chain management is a set of approaches utilized to efficiently integrate suppliers, manufacturers, warehouses and stores, so that merchandise is produced and distributed al the right quantities, to the right locations, and at the right time, in order to minimize system-wide costs while satisfying service level requirements. In both definitions, a supply chain involves all the facilities that generate an impact on the cost and the performance of the manufacture of the product such as plants, warehouses, distribution centers, etc. It is also necessary to consider the suppliers of the suppliers and the customers, since these also generate an impact in the supply chain to achieve the objective which is to be efficient and profitable throughout the system. To achieve the objective of being efficient and profitable, the direction of the logistics must carry out the main tasks of planning, organizing and controlling. Specifically in the logistics direction, planning forms an important triangle of location, inventory, and transportation decisions, and customer service is the result of these decisions (See Figure 2.2)(Ballou, 2004). 23.
(24) Figure 2.2 The planning Triangle in Relation to the principal Activities of logistics/Supply Chain Management (Ballou, 2004). The planning part is the most important task where managers spend more time, having great planning requires the effective vision of the company's objectives, answering what, when and how and having the necessary tools to get there, has Three levels: strategic, tactical and operational, each with a different planning time horizon. Strategic planning considers planning times greater than one-year, tactical planning takes intermediate time horizons less than a year and finally operational planning considers short-time time horizons.. 2.3 Reverse logistic introduction In companies, it is becoming more common to see how products are recovered or materials of the clients, with the purpose of recovering a value or as post-sales services. Right here where the concept of reverse logistics is born where many of the companies think that the reverse flow requires the same importance as the forward flow, since if a product is damaged, it does not work or simply This obsolete, can be repaired and sold to a second market to recover a value. Then the concept of reverse logistics and all the processes involved will be reviewed in detail. 24.
(25) 2.3.1 What is reverse logistic? Reverse logistic is a continuous process and parallel to the traditional logistics, the difference lies in the supply flow and finished products. For example, when a product is not consumed or sold, it must return to the beginning or to an intermediate point of the supply chain so that it can be re-used or discarded to reduce costs. As with the concept of Logistics, there are multiple definitions of the concept which the most outstanding are the following: For the Council of Supply Chain Management Professionals is a specialized segment of logistics focusing on the movement and management of products and resources after the sale and after delivery to the customer.. Includes product returns for repair and/or. credit.(Professionals, 2013). “Reverse logistics comprises all activities involved in managing, processing, reducing and disposing of hazardous or non-hazardous waste from production, packaging and use of products, including the processes of reverse distribution “(Dyckhoff, Lackes, & Reese, 2004). ‘‘The process of planning, implementing, and controlling the efficient, cost-effective flow of. raw materials, in-process inventory, finished goods, and related information from the point of consumption to the point of origin for the purpose of recapturing or creating value or proper disposal’’(Roger & Ronald, 2001). Activities such as source reduction and material substitution do have a significant impact on logistics. However, these and other activities primarily motivated by environmental. 25.
(26) considerations might better be labeled "green logistics" or "environmental logistics," which we would define as "efforts to measure and minimize the environmental impact of logistics activities." The term "reverse logistics" should be reserved for the flow of products and materials going "the wrong way on a one-way street."(Roger & Ronald, 2001). There are many activities that can be applied both reverse logistics and green logistics, and others that cannot be applied equally, Figure 2.3 shows the differences and the overlap in the two definitions.. Figure 2.3 Comparison of reverse logistics and green logistics (Roger & Ronald, 2001). 2.3.2 Why apply reverse logistic? Reverse logistics refers to the recovery and return of products to be reincorporated into the supply chain or in other processes in the most effective and economical way possible, to maximize the value of the recovered flow. Although the main reason for the interest in reverse logistics is social concern by the environment. One of the advantages of applying reverse logistics in companies is that it allows the reduction of uncertainty in the arrival of products that are not in use and the reuse of some materials. It also provides the possibility for the company to encompass other markets and. 26.
(27) generates greater confidence to the customer at the time of the purchase decision, as well as improves the image of the organization. According to Ortega Mier (Mier, 2008) the reasons that originate a flow of reverse logistics can be several, of which the most important are: •. Economic reasons: The products or materials that are tried to recover assume, once treated, a source of "cheap" raw material. It brings with it the emergence of other types of businesses such as scrap dealers.. •. Marketing: reverse logistics is used to try to improve the image of the company and with it its market position. The recovery of used products is considered important to create a "green or ecological" image that is so much demanded today.. •. Legal reasons: Governments, at all levels (State, regional and local), are becoming increasingly aware of the importance of environmental issues and are beginning to enact laws and other provisions aimed at reverse logistics as a source of improvements in environment. The responsibility of the manufacturer and the user is becoming a key element of public environmental policies in many countries. Manufacturers are required to reduce the dumping of products they have manufactured after use.. •. Asset protection: The design and manufacture of a product has a high cost for the company and, in many cases, this cost is avoided by companies that try to reuse products at the end of their useful life.. All the reasons that generate reverse flows are of great importance for the management of the corresponding logistic activities and are related to the different forms of recovery of the. 27.
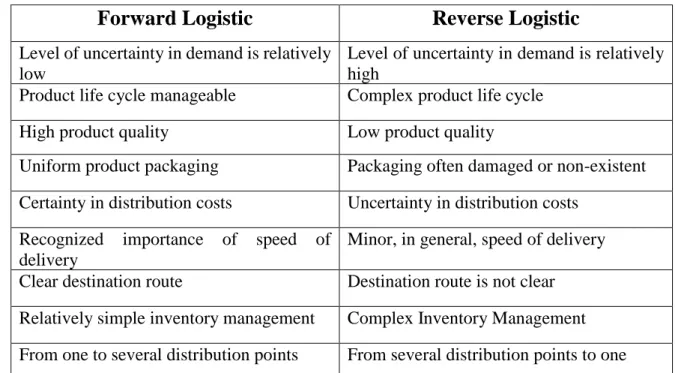
(28) value of the product, which distinguishes different forms of recovery according to the reincorporation of the product to chain. (Figure 2.4).. Figure 2.4 Forms of recovery depending on the destination of flows (Mier, 2008). 2.3.3 Reverse logistic and forward logistic Reverse Logistics is responsible for the recovery and recycling of containers, packaging and hazardous waste and process return excess inventory, customer returns, obsolete products and seasonal inventories. While direct logistics oversees designing, implementing and controlling the flow of raw material, finished products and all related information from the product is found as raw material to its consumption in an efficient and economical way. Among the differences between logistics and reverse logistics we can highlight the uncertainty in the return of products, tools used for forecasting can be used safely in direct. 28.
(29) logistics, however, this tool becomes invalid in reverse logistics due to uncertainty of returned products. On the other hand, new products that are generated in companies follow patterns based on lists of materials, quantities used and subject to strict quality control, which returned products do not follow this pattern because the recovery centers receive damaged products, Modified or with lost parts that generate the consumption of time in the inspection and classification making the work more difficult. Finally, in a supply chain forward the customer is the one who has the final decision on the life of the product, in reverse supply chains this decision depends on the condition of the product returned. Some important aspects about reverse logistics and forward logistics are shown in table 2.1:. Forward Logistic. Reverse Logistic. Level of uncertainty in demand is relatively Level of uncertainty in demand is relatively low high Product life cycle manageable Complex product life cycle High product quality. Low product quality. Uniform product packaging. Packaging often damaged or non-existent. Certainty in distribution costs. Uncertainty in distribution costs. Recognized importance delivery Clear destination route. of. speed. of Minor, in general, speed of delivery Destination route is not clear. Relatively simple inventory management. Complex Inventory Management. From one to several distribution points. From several distribution points to one. Table 2.1 important aspects about reverse logistics and forward logistics. 29.
(30) 2.3.4 Advantages and Disadvantages of Reverse Logistics Within Reverse Logistics, different advantages and disadvantages can be observed Advantages: •. Decreased uncertainty in the arrival of products that are not in use.. •. Re-use of materials.. •. Ability to embrace new markets.. •. Increased customer confidence.. •. Improves the image of the company.. •. Obtaining competitive advantages.. •. Obtaining feedback information about the product.. •. Reduction of returns. •. Recovery of defective products.. •. Decreased risk of obsolete products.. •. Reduction of environmental impact. Disadvantages: •. Realization of previous studies for the establishment of a reverse logistics system.. •. Involvement of all departments in reverse logistics activities.. •. Entries to an Inverse Logistics process are unpredictable. •. Inspections must be performed on each product individually for classification. •. Returns in small amounts tend to represent higher costs when they are entered into the system.. 30.
(31) 2.3.5 Reverse logistics process The possibilities for economic recovery of the products that are not used vary from one product to another, considering that not all products can be subjected to the same operations to recover the value that they incorporate. To acquire a greater knowledge and to deepen more in inverse logistics, the process is presented to recover the value of the products from different perspectives According (Thierry, Salomon, Nunen, & Wassenhove, 1995) the product recovery management (PRM) encompasses the management of all used and discarded products, components, and materials that fall under the responsibility of a manufacturing company. The objective of product recovery management is to recover as much of the economic (and ecological) value as reasonably possible, thereby reducing the ultimate quantities of waste. In the figure 2.5 presents an integrated supply chain where service, product recovery, and waste management activities are included. Returned products and components can be resold directly, recovered, or disposed (incinerated or landfilled). The five product recovery options are: 1) Repair: the purpose of repair is to return used products to “working order”. The quality of repaired products is generally less than que quality of new products. Repair operations can be performed at the customer´s location or at manufacturer-controlled repair centers. 2) Refurbishing: the purpose of refurbishing is to bring used products up to specified quality. Quality standards are less rigorous than those for new products. Occasionally, refurbishing is combined with technology upgrading by replacing outdated modules and parts with technologically superior ones.. 31.
(32) 3) Remanufacturing: the purpose of remanufacturing is to bring used products up to quality standards that are as rigorous as those for new products. Used products are completely disassembled and all modules and parts are extensively inspected. 4) Cannibalization: The purpose of cannibalization is to recover a limited set of reusable parts from used products or components. These parts are reused in repair, refurbishing, or remanufacturing of other products and components. quality standards for cannibalized parts depend on the process in which they will be reused. 5) Recycling: The goal of the previous product recovery options is to retain the identify and functionality of used products and their components as much as possible. The purpose of recycling is to reuse materials from used products and components. The options are listed in order of the required degree of disassembly (teardown). All options are suitable for both products and components.. Figure 2.5 Integrated supply chain where service, product recovery, and waste management activities are included (Thierry et al., 1995). 32.
(33) Another classification for off-product management options is Carried out by (Moritz Fleischmann et al., 1997), according to the degree of decomposition that the product undergoes in the recovery process. In this way, we can establish an analogy between the degree of decomposition of the recovered product and the loss of its identity: 1) Re-use: The product maintains its identity and there is no or very little decomposition of it. 2) Repair: The need to replace defective components, determines the degree of decomposition, although generally this will be low, maintaining essentially the identity of the product. 3) Remanufacturing: When recovering only qualitatively valid parts and components, they will only retain their identity, thus existing a medium-high decomposition level. 4) Recycling: it involves the recovery of the raw material with which the product is made, thus losing its structure and identity. As a third perspective (Rubio Lacoba, 2003) proposes a classification for the management options in which, each one of the categories satisfies the following premises: 1) that it is in fact an end-of-life product, i.e. that the product has ended its useful life or can no longer meet the needs of the consumer, 2) that there is an economic advantage of the added value of the PRM 3) that a new life cycle is obtained for the PRM or for one of its components or materials. In this way, they propose the following classification of the management options for products out of use:. 33.
(34) 1) Re-use: there is an integral use of the returned product once small operations of cleaning and maintenance. The quality of the products reused is totally comparable to that of the original products, although there is generally a limit on the number of reuses. 2) Remanufacturing: Parts and components of the PRM are recovered for use in the manufacture of new products, so that the quality of the remanufactured products is equal to that of products manufactured with original components. 3) Recycling: a recovery of the material with which the PVM is made, so that it loses its identity during the process. The quality levels of the product made from recycled materials can reach those of the original products.. 2.4 Close-Loop Supply chain A. definition of closed-loop supply chain management is provided by (D. Guide &. Wassenhove, 2009) “as the design, control, and operation of a system to maximize value creation over the entire life cycle of a product with dynamic recovery of value from different types and volumes of returns over time” usually in a forward supply chain, the consumer is the end of the process. however, in a closed-loop supply chain, the return process is included, and the producer aims to capture the aggregate value, as well as an integration of the activities of the supply chain. According to (V. D. R. Guide, Harrison, & Van Wassenhove, 2003) closed loop supply chains include traditional forward supply-chain activities and the additional activities of the reverse supply chain. These additional activities include: •. product acquisition to obtain the products from the end-users. •. reverse logistics to move the products from the points of use to a point(s) of disposition, 34.
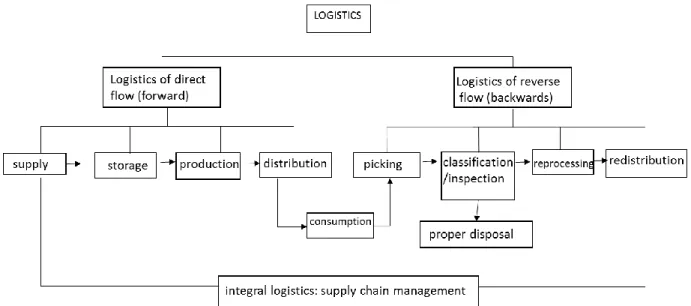
(35) •. testing, sorting, and disposition to determine the product’s condition and the most economically attractive reuse option,. •. refurbishing to enable the most economically attractive of the options: direct reuse, repair, remanufacture, recycle, or disposal, and. •. remarketing to create and exploit markets for refurbished goods and distribute them.. In logistic terms, setting up a reverse logistic system in addition to the forward system(s) results in an integral supply chain.((Harold R. Krikke, 1998) This is reflected in Figure 2.6. Figure 2.6 Integral supply chain and research focus(Harold R. Krikke, 1998). One of the most important aspects in the supply chain is the design of the logistics network. A traditional closed-loop supply chain network consists of suppliers, production, storage and distribution centers, customers, collection and recovery centers, disposal and secondary markets. Logistics then includes the sum of varied and complex activities, and each one of them has taken care of extending the analysis, to deepen the creation of stratagems that allow the 35.
(36) optimal performance of logistics networks or supply chains. In some chains, it is possible to reintroduce the product in the initial chain, giving rise to closed-loop supply chain; in other cases, the cycles are open and give rise to new markets and chains of recovery and recovery, where. new. collection,. classification,. reprocessing. and. distribution. activities. originate.(Flórez, Toro, & Granada, 2012). The Figure2.7 illustrates activities that integrate supply chain integration, including activities that includes reverse logistics.(Flórez et al., 2012).. Figure 2.7 Logistics network integrates(Flórez et al., 2012). 2.4.1 Reverse logistics and closed-loop supply chains models According to (Blumberg, 2005) the closed-loop supply chain involves three aspects: •. Forward logistics and direct supply chain management—This includes the overall management and coordination and control of the full direct service logistics pipeline, including the flow of the original material, parts, and the final products to the central. 36.
(37) ware-house and distribution system, as well as the initial physical flow down to regional and local supply points to the end user or purchaser. •. Reverse logistics—This process is found either as a subset of closed loop systems or standing alone. This includes full coordination and control, physical pickup and delivery of the material, parts, and products from the field to processing and recycling or disposition, and subsequent returns to the field where appropriate.. •. Depot repair, processing, diagnostics, and disposal—This includes the services related to receiving the returns from the field, via the RL process, and then the processes required to diagnose, evaluate, repair, and/or dispose of the returned units, products, parts, subassemblies, and material, either back to the direct/forward supply chain or into secondary markets or full disposal.. According to (Blumberg, 2005) The typical processes addressing RL and CLSC can be readily classified depending on the characteristics of the manufacturers and sellers, the buyers, the distribution channels used, the use of third and fourth party logistics providers, the degree of interest, and the value of the material in the process. Four models currently exist: 1. Basic Reverse logistics model: The basic RL business model simply deals with the return of unwanted materials and products to a central location for processing and disposal (Figure 2.8). It operates independently of the direct supply chain, which originally delivered it. In this model, which can be run as a business or as a governmental service, the emphasis is on the economic disposal or waste or trash through land or sea dumping or recycling.. 37.
(38) Figure 2.8 Independent reverse logistics processes (Blumberg, 2005). 2. CLSC, involving integrated direct and RL and repair service cycle for high tech products: In this business model, generally found in a high-tech product environment, the original equipment manufacturer (OEM) supports its own product line sold to its customers in the field, and takes responsibility directly for the RL process. The products, as well as any subassemblies, parts, and components that are in the field after delivery, are returned and recovered by an OEM through indirect (dealer) channels representing the OEM, or the OEMs own field service force. The primary differentiator is that in this model the entire direct and RL flow can be and usually is controlled by the OEM. The RL flow to depot repair will either put the material back into inventory for resupply directly to the field or into a qualification and reconfiguration process, which leads to either reuse at the manufacturing level or full disposal into secondary markets. (See figure 2.9).. 38.
(39) Figure 2.9 Typical high tech closed loop supply chain(Blumberg, 2005). 3. CLSC, involving independent direct and RL and repair service cycle for standards low tech products: —In this business model (See Figure 2.10), the end user or purchaser uses its own internal plant and building maintenance service force or its own supply chain processes rather than relying on the outside OEM or indirect dealer channels. In this model, the buyer or user is typically a large organization with many smaller dealers or OEMs supporting it. In this situation, the buyer tends to pick up more of the responsibilities for RL or repair, using its own forces or third-party logistics (3PL) organizations. This process looks very similar to the high-tech process discussed above except for the issue of who is specifically responsible for which actions. In this model, the direct and RL supply chains are independent of each other; the OEM does not control the full process.. 39.
(40) Figure 2.10 Alternative high tech closed loop supply chain(Blumberg, 2005). 4. Consumer-oriented CLSC: In this business model, the primary interaction is between the retailer and the OEM. Some of the returns from the purchaser back to the retailer are failed units or products that were simply purchased and returned. A portion of returns are unsold products returned to clear the retailer’s shelves, or products returned by the retailer’s customer. (See Figure 2.11).. Figure 2.11 Closed loop supply chain in consumer goods (Blumberg, 2005) 40.
(41) 2.4.2 Design of logistics networks in the supply chain The design of logistics networks, as well as the location of facilities are within strategic distribution decisions, for which different models have been developed with a high degree of complexity. Some important points in network design are supply chain planning, network structure, and optimization of the network, which are explained in detail below:. 2.4.2.1. Strategic Supply Chain Planning. According to the author (Gonzalez Ch., 2010) Strategic Supply Chain Planning as the systematic effort to establish purposes, objectives, policies and strategies, to guide their performance and respond to the demands and needs of their customers. The process of strategic logistics planning consists of starting from the strategic direction of the company, interpreting the corporate strategy, applying it in the supply chain in such a way as to achieve the profitability expected by the company.(O & S, 2010). In Figure 2.12 we can visualize the process of strategic logistics planning:. 41.
(42) Figure 2.12 Strategic Logistics Planning process (O & S, 2010). According to ((O & S, 2010)), the planning must consider two important conditions: (i) Internal Conditions of the organization: Emphasis is placed on the content of the mission, since it illustrates and makes explicit the objectives of the organization, (ii) Conditions of the environment: The achievement of mission and vision is conditioned by the environment. It is important to understand that there are several levels of environment: what happens in the world, in the country, at the regional level and what affects exclusively the sector or industry where the activities take place. Different environments are largely beyond the control of organizations.. 2.4.2.2. Network Structure. The structure of the supply chain which we can model with arcs and nodes represent all the companies that participate in a chain of production and services from the raw materials to the. 42.
(43) final consumer. Dimensions to consider include the length of the supply chain and the number of suppliers and customers at each level.(Jiménez & Hernández, 2002) Managers and managers suggest that not all links along the supply chain should be strictly coordinated and integrated into management, as the level of linkage between the links is very different. In supply chain management, it is necessary to select the most appropriate level of society for each particular link (Lambert, Emmelhainz, & Gardner, 2013). According to the author ((Jiménez & Hernández, 2002)) it is suggested to analyze three structural aspects of the network: (i) the members of the supply chain, (ii) the structural dimensions of the network and (iii) the different types of links that make up the processes .. 2.4.2.3. Optimization of the Supply Chain. Another important aspect of network design is to determine how supply chain performance will be measured. The primary objective is to optimize, that is, to maximize or minimize functions in several real variables with constraints. The results and the optimization process become a quantitative support of the decisions against the situations posed. according to (Gómez Montoya & Correa Espinal, 2010) there are several methods to review the optimization of supply chains which are explained below: systems simulation Is a powerful tool to solve a wide variety of problems, through the representation or imitation of the behavior of the system or phenomenon under study is classified into two types: (i) 43.
(44) discrete simulation, which relates to the representation of systems that change at defined points of time or when events occur, such as the entry or exit of a customer of a store or the entry of a product in a distribution center. (ii) continuous simulation, the state of the variables changes continuously over time, such as the average speed of a conveyor belt, temperature of a cold storage system and product demand. Analytical, heuristic and metaheuristic methods The analytical methods such as linear and dynamic programming are operations research techniques based on mathematical programming, which allows the efficient allocation of resources through the construction of algebraic equations, on the other hand heuristic algorithms can be considered as methods which are based on experience or judgment, which probably offers adequate solutions to problems, without guaranteeing that the optimal mathematical solution is produced as the analytical methods, and finally the metaheuristic, are defined as a structure to produce heuristics, such as, search , genetic algorithms and annealed simulation, can be applied to logistical process design and present advantages over traditional optimization methods. Experiment design Is a technique that allows to plan and to execute experiments, and to analyze statistically the resulting data, to obtain valid and objective conclusions.. 44.
(45) 2.5 Previous literature related to quantitative models for the analysis of reverse logistics systems. The reverse logistics study has been developed in conjunction with the development of quantitative models, allowing to obtain more precise information about the design and operation of the reverse network and improving the decision-making process, so that it is important to consider the quantitative models designed for their study. To classify the different quantitative models, reuse, remanufacturing and recycling were used as criteria.. 2.5.1 Reuse models According to (Kroon & Vrijens, 1995) use the term Return Logistics System to refer to the consideration of the inverse function of logistics in the physical distribution stage. They also include a simulation model and a Binary Integer Linear Programming model that tries to determine the number of containers available, their location, system operation and collection, distribution and service fees. It is a classic model of location of installations, of static character, that is solved for different scenarios, to mitigate the effect of the uncertainty associated to these models. (H.R. Krikke, Kooi, & Schuur, 1999) present a model of Mixed Integer Linear Programming, which allows the design of a reverse logistics network for the recovery and remanufacturing of automobiles. This model assumes that the automobile recuperator recycles one part of the car (30%) and manufactures the rest. Each of these management options will be carried out in different facilities so it will be necessary to establish the routes that will follow these products out of use.. 45.
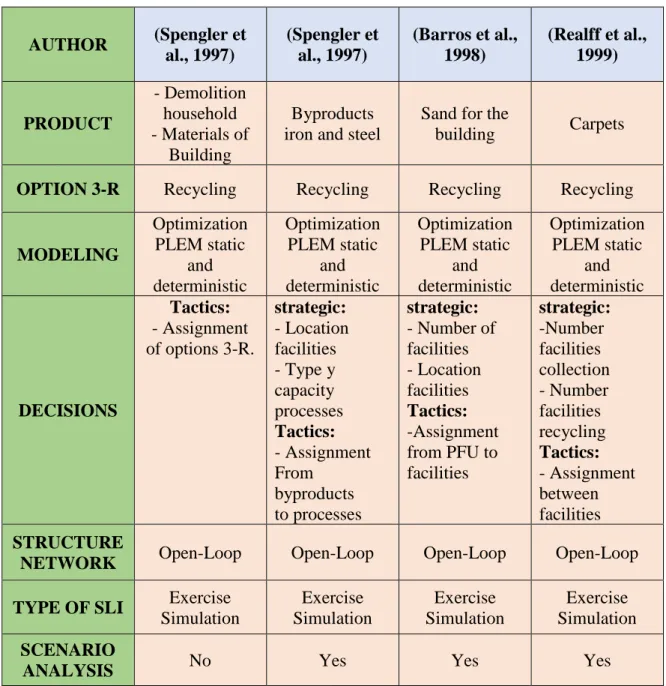
(46) (Rubio Lacoba, 2003) shows us a table in which we can observe the two models analyzed previously (See table 2.2):. AUTHOR. Kroons y Vrijens (1995). Krikke et al. (1999). PRODUCT. Returnable Containers. OPTION 3-R. Reuse. Automotive industry Recycling and Reuse. MODELING. DECISIONS. STRUCTURE NETWORK TYPE OF SLI SCENARIO ANALYSIS. Static and deterministic PLEB optimization Strategies: -Installations number -Location of facilities Tactics: -containers number -Assignment of containers -Service Fees - Closed Loop - Logistics flows integrated Own with the participation of professionals Yes. PLEM Optimization static and determinist Strategies: -Location facilities collection -Reprocessing facilities location Tactics: -Assigning material flow between locations Open-loop Own Yes. Table 2.2 Quantitative models for reuse (Rubio Lacoba, 2003). 2.5.2 Recycling Models There are several recycling models created by several authors, among the most important are: (Spengler, Püchert, Penkuhn, & Rentz, 1997) formulate two models of Linear Mixed Whole Programming with applications, on the one hand, to the recycling of industrial byproducts (slags) and, on the other hand, to the dismantling and recycling of houses. In the first model, the problem of location of facilities and allocation of flows is studied, like a traditional Warehouse Location Problem, which determines the location of the recycling facility, its. 46.
(47) capacity and recycling option to be used for each of the by-products obtained in the steelmaking process. In the second model, the design of an integrated system for the dismantling and recycling of dwellings, where both processes are interdependent, is proposed; i.e. dismantling will occur only if the recycling options are economically viable, while recycling will require prior knowledge of the materials obtained in the demolition of the dwellings. (Ammons, Realff, & Newton, 1997) develop a robust-mixed-integer linear programming model to support decision-making for reverse production infrastructure design. The robust model seeks solutions close to the mathematically optimal solutions for a set of alternative scenarios identified by a decision-maker. To demonstrate the approach, a representative industrial case study is given for a large-scale carpet recycling problema A robust solution is found that appraises the impact of two major sources of uncertainty, volumes of carpet collected and price of a key recycled material. (Barros, Dekker, & Scholten, 1998) design a system for the recovery and recycling of sand from buildings. they propose a two-level location model for the sand problem and consider its optimization using heuristic procedures. The results obtained for the sand recycling network in the Netherlands are summarized. (Realff, Ammons, & Newton, 1999) In this article, they develop a mixed-integer programming model to support decision-making in reverse production system design. To illustrate its use and applicability, they apply the model to a representative US carpet recycling industrial case study. The overall economic feasibility of recycling is strongly dependent on the volumes that can be expected from investments in collection infrastructure.. 47.
(48) The geographic location of processing centers influences the network economics, and the subdivision of recycling tasks to avoid the shipment of low value material is proposed as an effective strategy for carpet recycling. In the following table 2.3 created by ((Rubio Lacoba, 2003).) we summarize the models seen above:. AUTHOR. (Spengler et al., 1997). (Spengler et al., 1997). (Barros et al., 1998). (Realff et al., 1999). PRODUCT. - Demolition household - Materials of Building. Byproducts iron and steel. Sand for the building. Carpets. OPTION 3-R. Recycling. Recycling. Recycling. Recycling. Optimization PLEM static and deterministic Tactics: - Assignment of options 3-R.. Optimization PLEM static and deterministic strategic: - Location facilities - Type y capacity processes Tactics: - Assignment From byproducts to processes. Optimization PLEM static and deterministic strategic: - Number of facilities - Location facilities Tactics: -Assignment from PFU to facilities. Optimization PLEM static and deterministic strategic: -Number facilities collection - Number facilities recycling Tactics: - Assignment between facilities. STRUCTURE NETWORK. Open-Loop. Open-Loop. Open-Loop. Open-Loop. TYPE OF SLI. Exercise Simulation. Exercise Simulation. Exercise Simulation. Exercise Simulation. SCENARIO ANALYSIS. No. Yes. Yes. Yes. MODELING. DECISIONS. Table 2.3 Quantitative models for recycling (Rubio Lacoba, 2003). 48.
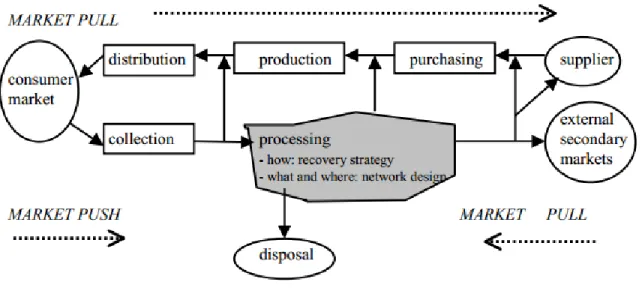
(49) 2.5.3 Remanufacturing Models (Harold R. Krikke, 1998) develops a model for the recovery and subsequent remanufacturing of photocopiers in Europe. It is a model designed to study the strategic decisions taken by a Dutch multinational in terms of its logistics system. Specifically the model formulates a reverse logistics network for two different models of photocopier, which will be analyzed in different scenarios to consider the different situations posed by the company's management. The intrinsic characteristics of this problem lead to consider different networks for each product, modeling each problem through Mixed Integer Linear Programming. (Jayaraman & Srivastava, 1999) they present a 0-1 mixed integer programming model that simultaneously solves for the location of remanufacturing/distribution facilities, the transshipment, production, and stocking of the optimal quantities of remanufactured products and cores, they also discuss the managerial uses of the model for logistics decision-making. (Klausner & Hendrickson, 2000)Develops a model that allows to determine the optimal amount to spend on buy-back and the optimal unit cost of reverse logistics. Can use the latter to select a suitable reverse logistics system for end of life products.apply the model to the remanufacturing take-back concept for power tools, using empirical data on the current takeback program. The following table 2.4 summarizes the models analyzed previously by(Rubio Lacoba, 2003).. 49.
(50) AUTHOR. (Harold R. Krikke, 1998). (Jayaraman & Srivastava, 1999). (Klausner & Hendrickson, 2000). PRODUCT. Photocopiers. phones mobile. Machines tool. OPTION 3-R. Remanufacturing. Remanufacturing. Remanufacturing. MODELING. DECISIONS. Optimization PLEM static and deterministic strategic: - Location of plants collection - Location of plants remanufacturing. Static and deterministic mathematical programming. Numerical Algorithms strategic: -Location from facilities Tactics: Assignment of materials between plants -Decisions of warehouse. Static and deterministic simulation Tactics: -Cost of Buyback system. STRUCTURE NETWORK. Closed-Loop. Closed-Loop. Closed-Loop. TYPE OF SLI. SLI Own. Modeling for an SLI own. SLI Own. SCENARIO ANALYSIS. Yes. Yes. Yes. Table 2.4 Remanufacturing models. (Rubio Lacoba, 2003). 50.
(51) Chapter 3 Problem statement and formulation This chapter describes in detail the variants of the problem to solve within the research, the mixed integer linear programming (MILP) model. and finally the proposed solution. methodology, taking as reference the mixed integer linear programming model with returns in the same period proposed by (Suarez, 2014). For this closed loop supply chain research is made up of plants, customers, recovery centers and secondary market. It is considered a planning which is divided into periods. As a first link, we have the plants which are responsible for making the raw material in finished product. The plants have as limitation to manufacture only one type of product and they oversee distributing this product to its customers, its production capacities are fixed and known and are coordinated with the customer's demand in a pull system (it produces what the Customer asks). As a second link, we have customers who place the orders and send them to the plants to do their production scheduling based on orders shipped, each plant can serve more than one customer. Products returned by customers are collected and shipped to recovery centers in the same period or the next period where they are inspected and sorted, if the products are in good condition, repaired and shipped back to Plants to meet customer demand for the next period or are sold to the market otherwise, if poor conditions (cannot be repaired and / or used) are considered end-of-life products and are discarded. Strategic and operational decisions include:. 51.
(52) - Location decisions: physical location and number of plants and recovery centers. - Transport decisions: the product flow sent from the plants to the customers in each planning period, the flow of product sent from the customers to the recovery centers either in the same period or in the following period, the flow of Product sent from the recovery centers to the plants and the secondary market.. 3.1 Model description The proposed mathematical model for the closed-loop supply chain considers the design of networks with a single product, multiperiod, multilevel, multistage with returns in the same period and in the following period of planning with a location and number of plants, customers and Known recovery centers, as shown in figure 3.1.. Figure 13.1 Research Logistic Network. In the previous figure, we can see two types of flow, the forward flow where new products are sent from the plants to the customers through a pull system, and the reverse flow, in which. 52.
(53) the products returned per customer are sent to the customers. Recovery centers in the same period or in the following period, where they are inspected, sorted and sent back to the plant to introduce it to the supply chain through a push system, is sold to the secondary market through a pull system or simply discarded. The assumptions to be considered in the model are as follows: 1. The model considers an integrated logistics network for a single product, multilevel, multiperiod. 2. The quantities that are returned to the recovery centers depends on the customer's demand. 3. The quantities returned to the recovery centers can only be sent in the same period and / or in the following period. 4. The capacities of plants and recovery centers are fixed and well-known. 5. Production, inspection, disposal, reprocessing and transportation costs are known. 6. The cost of transport is proportional to the distance traveled. 7. The location and number of plants, customers and recovery centers are known. 8. Maintenance, storage and shortage costs are not considered. Among the parameters established is the rate of return which the amount of demand the customer returns. At the same time, a recovery rate has been defined for the returned products, and a redemption value for the products that were sold to the secondary market which are related to the quality of the product returned, if the product has high quality has. 53.
(54) the possibility of Enter the process, if the product is of low quality is sold to the secondary market. Fixed infrastructure costs include the activation of plants and recovery centers. Variable operating costs are related to the production, inspection, disposal, remanufacturing, and transportation of the product in the integrated logistics network. Decisions that are considered include the number and location of plants and recovery centers, and the flow of product between nodes, ie the quantities of products that are sent from plants to customers, Products shipped from customers to recovery centers in the same period and in the following period, products shipped from recovery centers to plants and the secondary market, and products shipped to customers in the next planning period. The objective is to minimize the total annual expected cost of the integrated logistics network considering the costs of both infrastructure, variable costs and operating profits.. 3.2 Deterministic model Formulation The mixed integer linear programming model for the research problem is described, the indexes, parameters and decision variables that were used were the following:. 3.2.1 Indexes: I=Set of possible plant location 𝑖 ∈ 𝐼 𝑁 =Set of k customers, the customer n+1 is the secondary market 𝐿 = Set of possible recovery center locations 𝑙 ∈ 𝐿 𝑇 =Time periods 𝑡 ∈ 𝑇. 54.
(55) 3.2.2 Parameters: 𝛾 =Recovery Rate 𝑣𝑟 = Rescue value of a recovered product not used to meet the demand of the next period. 𝑑𝑘𝑡 = Customer demand k in period t 𝑢´𝑘𝑡 = Quantity of product returned by customer k in period t 𝑢´´𝑘𝑡 =Quantity of product returned by customer k in period t+1 𝑢𝑘𝑡 =Total product returned by customer k in period t 𝑝 𝑐𝑖𝑘 = Sum of the unit cost production of plant i and the cost of transportation from plant i to. customer k 𝑐 𝑐𝑘𝑙 = Sum of unit cost of transportation from customer k to recovery center l and cost. inspection and disposal 𝑐𝑙𝑖𝑟 = Difference between unit profit from remanufacturing and transportation from recovery center l to plant i in period t 𝑠 𝑐𝑖𝑘 = Unit cost of transportation of the product reused from plant i to customer k. 𝑓𝑖𝑝 =Annualized fixed cost of opening the plant i. 𝑓𝑙𝑟 =Annualized fixed cost of opening recovery center l 𝑝̅𝑖 =Annual capacity plant i 𝑟̅𝑙 =Annual capacity of recovery centers l 55.
(56) 3.2.3 Decision variables: 3.2.3.1. Binary Variables:. Two types of binary variables are defined which are related to the location and opening of plants and recovery centers. 𝑦𝑖𝑝 = 1, if a plant i is opened 0, otherwise 𝑦𝑙𝑟 = 1, if a recovery center 𝑙 is opened 0, otherwise. 3.2.3.2. Continuous variables:. 𝑝 𝑥𝑖𝑘𝑡 = product flow from plant i to customer k in period t. 𝑥´𝑘𝑙𝑡 = Product flow from customer k to recovery center l in period t 𝑥´´𝑘𝑙𝑡 = product flow from customer k to recovery center l in period t+1 𝑟 𝑥𝑙𝑖𝑡 = Product flow recovered from recovery center l to plant i in period t. 𝑠 𝑥𝑖𝑘𝑡 = Product Flow reused from plant i to customer k in period t. 𝑟 𝑥𝑙,𝑛+1,𝑡 = Quantity of product recovered from recovery center l to customer n + 1 in period. 𝑡 but not used to satisfy demand in period 𝑡 + 1.. 56.
(57) 3.2.4 Subject to: 3.2.4.1. Balance:. In the first planning period t = 1 The flow received by customer k from plants i must be equal to customer demand k: 𝑝 ∑ 𝑥𝑖𝑘1 = 𝑑𝑘1. ∀𝑘 ∈ 𝑁. (1). 𝑖∈𝐼. The product flow from customer k to the recovery center l in period t is equal to the quantity of product returned by customer k in period t:. ∑ 𝑥´𝑘𝑙1 = 𝑢´𝑘1. ∀𝑘 ∈ 𝑁. (2). 𝑙∈𝐿. The Product flow recovered from recovery center l to plant i in period 1 plus Quantity of product recovered from recovery center l to customer n + 1 in period 1 but not used to satisfy demand in period 𝑡 + 1 must be equal to the recovery rate of the Product flow from customer k to recovery center l in period 1 𝑟 𝑟 ∑(𝑥𝑙𝑖1 + 𝑥𝑙,𝑛+1,1 ) = 𝛾 ∑ 𝑥´𝑘𝑙1 𝑖∈𝐼. ∀𝑙 ∈ 𝐿. (3). 𝑘∈𝑁. When the period t> 1 The flow of product received by customer k from plants i plus the flow of reused product received by customer k from plants i must be equal to customer demand k: 𝑝 𝑠 ∑(𝑥𝑖𝑘𝑡 + 𝑥𝑖𝑘𝑡 ) = 𝑑𝑘𝑡. ∀𝑘 ∈ 𝑁, 𝑡 ∈ 𝑇, 𝑡 = 2,3,4, … , 𝑇. (4). 𝑖∈𝐼. 57.
(58) The product flow from customer k to the recovery center l in period t is equal to the quantity of product returned by customer k in period t:. ∑ 𝑥´𝑘𝑙𝑡 = 𝑢´𝑘𝑡. ∀𝑘 ∈ 𝑁, 𝑡 ∈ 𝑇, 𝑡 = 2,3,4, … , 𝑇. (5). 𝑙∈𝐿. The product flow from customer k to the recovery center l for period t + 1 is equal to the quantity of product returned by customer k in period t + 1:. ∑ 𝑥´´ 𝑘𝑙𝑡 = 𝑢´´𝑘𝑡. ∀𝑘 ∈ 𝑁, 𝑡 ∈ 𝑇. (6). 𝑙∈𝐿. The product flow from customer 𝑘 to the recovery center 𝑙 in period 𝑡 plus the product flow from customer 𝑘 to the recovery center 𝑙 for period t+1 is equal to total product returned by customer k in period t. ∑ 𝑥´𝑘𝑙𝑡 + ∑ 𝑥´´ 𝑘𝑙𝑡 = 𝑢𝑘𝑡 𝑙∈𝐿. ∀𝑘 ∈ 𝑁, 𝑡 ∈ 𝑇. (7). 𝑙∈𝐿. The product flow from customer k to the recovery center l in period t plus the product flow from customer k to the recovery center l for period t + 1 must be less than or equal to the recovery rate of the customer demand k in period t.. ∑ 𝑥´𝑘𝑙𝑡 + ∑ 𝑥´´ 𝑘𝑙𝑡 ≤ 𝛾. 𝑑𝑘𝑡 𝑙∈𝐿. ∀𝑘 ∈ 𝑁, 𝑡 ∈ 𝑇. (8). 𝑙∈𝐿. The Product flow recovered from recovery center l to plant i in period t plus Quantity of product recovered from recovery center l to customer n + 1 in period t but not used to satisfy demand in period 𝑡 + 1 must be equal to the recovery rate of the product flow from customer 58.
(59) k to the recovery center l in period t plus the product flow from customer k to the recovery center l for period t - 1 𝑟 𝑟 ∑(𝑥𝑙𝑖𝑡 + 𝑥𝑙,𝑛+1,𝑡 ) = 𝛾 ∑(𝑥´𝑘𝑙𝑡 + 𝑥´´ 𝑘𝑙𝑡−1 ) 𝑖∈𝐼. ∀𝑙 ∈ 𝐿, 𝑡 ∈ 𝑇, 𝑡 = 2,3,4, … , 𝑇. (9). 𝑘∈𝑁. The Product flow recovered from recovery center l to plant i in period t-1 is equal to product Flow reused from plant i to customer k in period t 𝑠 𝑟 ∑ 𝑥𝑙𝑖𝑡−1 = ∑ 𝑥𝑖𝑘𝑡 𝑙∈𝐿. 3.2.4.2. ∀𝑖 ∈ 𝐼, 𝑡 ∈ 𝑇, 𝑡 = 2,3,4, … , 𝑇. (10). 𝑘∈𝑁. Capacity:. When the period t=1 The flow of product received by customer k from plant i in period 1 must be less than or equal to the capacity of plant i only if plant i is opened: 𝑝 ∑ 𝑥𝑖𝑘1 ≤ 𝑝̅𝑖 𝑦𝑖𝑝. ∀𝑖 ∈ 𝐼. (11). 𝑘∈𝑁. The product flow from customer k to the recovery center l in period 1 must be less than or equal to the capacity of recovery centers l only if recovery center l is opened: 𝑟 ∑ 𝑥´𝑘𝑙1 ≤ 𝑟̅𝑦 𝑙 𝑙. ∀𝑙 ∈ 𝐿. (12). 𝑘∈𝑁. 59.
Figure


+7


Documento similar
8 Solving stochastic integrated distribution network design problems 131 8.1 A Variable Neighborhood Search simheuristic for the multi-period Inventory Routing Problem with
The expansionary monetary policy measures have had a negative impact on net interest margins both via the reduction in interest rates and –less powerfully- the flattening of the
Jointly estimate this entry game with several outcome equations (fees/rates, credit limits) for bank accounts, credit cards and lines of credit. Use simulation methods to
In our sample, 2890 deals were issued by less reputable underwriters (i.e. a weighted syndication underwriting reputation share below the share of the 7 th largest underwriter
Below, the most important ontologies are presented in the field of business and the Supply Chain, with a focus mainly on the entities (by the term “entity” is meant the
The results of the study have shown consistency for the World Cups played between 1966 and 2018 with regards to the following variables: Game period which is crucial for changing
In spite of this, the animals supplemented with XOS during the suckling period still maintained differences in microbial populations, structure and functions in the nursery
For the overall 10-year study period, the model generally simulated a higher percentage of hours with suitable weather conditions for ascospore and pycnidiospore infec- tion in
