Method of Optimizing the Costs of a Satellite Network
in Ka and Q/V Bands in the Feeder Link
Flor G. Ortíz-Gómez 1 and Ramón Martínez-Rodríguez-Osorio2
Universidad Politécnica de Madrid, ETSI de Telecomunicación, Avenida Complutense, 30 Madrid, 28040, Spain
and
Salvador Landeros-Ayala 3
Universidad Nacional Autónoma de México, Ciudad Universitaria, Mexico City, 04510, Mexico
The importance of implementing the use of the Ka and Q/V bands in the Feeder Link lies in the saturation that exists in other frequency bands. The new generation of HTS/VHTS satellites operates based on multibeam coverage; one of the main advantages of the HTS/VHTS satellites is the reduction of the cost of available satellite capacity. The method proposed in this paper for the optimization of the costs of a HTS satellite network focuses on the analysis of the forward link depending on the number of beams used and the G/T ratio of the user station. The methodology presented in this paper achieves the optimal trade-off solution for the highest capacity achievable according to a set of technical and cost requirements and constraints for different scenarios.
Nomenclature
A (lat,lon,p) = total attenuations due to atmospheric at geographical position given link availability p b(Θx, j) = beam gain of jth beam in the position Θx
BWA = available bandwidth BWb = bandwidth per beam BWT = total system bandwidth
C/(N+I)d (lat,lon) = carrier to noise plus interference ratio in downlink in the geographic position C/I (lat,lon) = carrier to interference ratio in the geographic position
C/Nd (lat,lon) = carrier to noise ratio in downlink in the geographic position C/Nu = carrier to noise ratio in uplink in the geographic position Cbeam = channel capacity per beam
CostGt = cost per gateway Costsat = cost of satellite
d(j) = distance of the jth beam center from center of the central beam G/T (lat,lon) = figure of merit of the user terminal
G/Tsat = figure of merit of the satellite
Ico(lat,lon) = co-channel interference in the geographic coordinates
1 PhD student, Departamento de Sistemas, Señales y Radiocomunicaciones, [email protected], Not a Member.
2
Senior Researcher and Associate Profesor, Departamento de Sistemas, Señales y Radiocomunicaciones, [email protected], Not a Member.
3
Senior Researcher, Departamento de Telecomunicaciones, [email protected], Not a Member.
Downloaded by Flor Ortíz-Gómez on November 3, 2017 | http://arc.aiaa.org | DOI: 10.2514/6.2017-5442
35th AIAA International Communications Satellite Systems Conference 16-19 October 2017, Trieste, Italy
10.2514/6.2017-5442
Copyright © 2017 by the American Institute of Aeronautics and Astronautics, Inc. All rights reserved.
Icx(lat,lon) = cross-polar interference in the geographic coordinates Ji = the first-kind Bessel function of order i
lat = position of latitude in the service area
Ld (lat,lon) = free-space losses in downlink in the geographic position lon = position of longitude in the service area
Lu = free-space losses in uplink in the gateway position Masssat = mass of satellite
MICo = total number of copolar interferent beams N = total number of beams
Nb_Gt = number of beam per gateways Nc = number of colors for frequency plan NGt = total number of gateways
Np = number of polarizations for frequency plan
Pco(q,lat,lon) = power of q-ht interferent spot in the geographic coordinates Θ3dB = semi-beamwidth of the antenna beam
Θx = position of the user as a function of the angle between the center of the beam and the position of the receiver
I.
Introduction
The importance of implementing the use of the Q/V band lies in the saturation that exists in other frequency bands, but due to the impact of rain and other propagation impairments, it is necessary to investigate which new technologies are necessary for its use in real systems.
The High Throughput Satellite (HTS) and Very High Throughput Satellite (VHTS) satellites are high performance satellites that will meet the needs of increasing data traffic and links with greater channel capacity, whose current capacity is above 100 Gbps. Some examples are Kasat, Viasat-1, Jupiter 2/Echostar 19 and Viasat-2. It is intended that in the future most of these transmissions will be performed in the Ka and Q/V bands, with higher bandwidth transponders, higher spectral efficiency, and greater power in HPA amplifiers and great robustness to signal degradation on the satellite link. In the near future, it is estimated that there will be satellites with capacities close to 1 Terabit/s [1].
Multibeam coverage dramatically increases the available capacity through frequency reuse and spatial separation. However, one of its main drawbacks is co-channel interference. A coverage composed of a high number of beams implies the possibility of a strong interference generated by all the beams reusing the same colors (frequency and polarization pair) and impacting the overall performance results [2].
One of the main advantages of HTS satellites is the reduction of the cost of available satellite capacity, due to the fact that the transponders have much more bandwidth, an increase well above the additional cost involved.
The understanding of the statistical behavior of the co-channel interference that is generated to increase the number of beams, the behavior of the satellite link address depending on the number of beams and the different constraints and scenarios they have in the design of satellite communications systems provide us a useful insight into the nature of the satellite communication environment and allow access to the channel capability to obtain the necessary parameters to minimize the cost of the entire operation [3].
A novel method was proposed to dimension the design of HTS satellites in [4]; this method has been a solid reference for the optimization methodology proposed in this paper but there are four additional important considerations. The first is that in this contribution all forward link is considered, second, that the diameter of the satellite antenna is variable; third, there are two possible cases when the service area does not meet the availability requirements and the fourth consideration is that the G/T ratio of the user station is variable.
The paper is focused on the optimization of satellite communications systems HTS in the Ka and Q/V bands. It aims to analyze communications parameters and study the optimization of the system by analyzing the trade-offs between benefits, cost and complexity, which is intended to obtain an implementation proposal based on the guidelines of the DVB-S2X satellite transmission standard.
II.
Technical and Commercial Requirements
The optimization method proposed in this paper can be applied to any coverage scenario, or frequency plan, this provides an idea of the impact of multiple variables on the performance and cost of multibeam
satellites. The methodology presented achieves the optimal system for the highest capacity achievable according to a set of technical and commercial requirements and constraints, that requirements must be defined before using the optimization method:
A. Frequency plan
Mixed Ka and Q/V is a solution that proposes the use of Q/V bands on the feeder links where greater capacity is required and more bandwidth is available and Ka band for the UT links [1]. It is important to select the frequency plan basing in ITU Radio Regulations.
Frequency reuse in the multi-spotbeam satellite antenna is commonly taken as either 3 or 4 colors with higher values (beyond 4) having diminishing returns. In the frequency plan chosen, two different polarizations are also used to optimize the spectrum.
B. Service Area
The number of required beams in a satellite link is dependent of two important factors. The first factor is the coverage and the other factor is the beamwidth.
For example, to provide coverage in North America, an orbital position must be selected to ensure that satellite can cover the selected region. For this example, position 109 W has been selected because is an orbital position of Mexico.
In Fig. 1 three different scenarios to cover North America are presented; for each scenario, four colors are used, two different frequency and two different polarizations. Each beam is shown like a hexagon assuming overlapping between the beams. When the map of coverage is designed, it is important to take advantage of the coverage of each beam in the most optimal way. It can be observed that, if the beamwidth decreases, it is necessary to increase the number of beams in the same service area. Note that the number of beams is a parameter that affects the G/T of the UT, the C/N of the downlink in the forward link, as well as the C/I and other factors, so there is a trade-off.
(a) Scenario 1, coverage with 87 beams
(b) Scenario 2, coverage with 137 beams
(c) Scenario 3, coverage with 261 beams
Figure 1 Scenarios of coverage
C. Satellite Antenna Model
In a multibeam system it is very important to define the coverage contour of each beam in order to perform the link calculations. The coverage footprint of each beam can be seen as the curve formed by the intersection of the antenna beam with a sphere (Earth).
The variation in the number of beams depends directly on semi-beamwidth θ3dB of the antenna beam,
so that the area covered by each beam will be smaller for reduced beamwidth, in which case a larger number of beams will be needed to provide the total coverage area. This affects several other parameters, such as the directivity and diameter of the satellite antenna.
For the calculation of gain that would be in each beam, the equations described in [2]. If θx represents
the position of the user as a function of the angle between the center of the beam and the position of the receiver with respect to the satellite, the beam gain is calculated as:
𝑏(𝜃𝑥, 𝑗) = 𝑏𝑚𝑎𝑥(𝑗)(𝐽1(𝑢)
2𝑢 +
36 𝐽3(𝑢)
𝑢3 )2 ( 1 )
𝑏𝑚𝑎𝑥(𝑗) = (4𝜋𝜆)2𝑑 1
02+𝑑(𝑗)2 ( 2 )
Where d(j) denotes the distance (in thousands of km) of the jth beam center from center of the central beam and d0≃35, 786, u = 2.07123 sin θx/ sin θ3dB and Ji is the first-kind Bessel function of order i.
One of the main technical limitations of the multibeam system is the diameter of the satellite dish. By increasing the number of beams in the coverage means that the beamwidth has decreased, thus, the gain of the antenna increases. The close relationship between the antenna diameter and the gain of the antenna is known; therefore, when increasing the gain, the antenna diameter must be increased. However, the antenna diameter is constrained by the launcher envelope.
D. MODCOD and Minimum Percentage of Service Area Covered
It is needed to define the minimum availability in a given percentage of service area covered for the methodology of optimizing that is proposed in this paper.
Depending on the selected MODCOD, a minimum value of C/(N+I) will be required. On the other hand, depending on the annual availability desired, losses due to rain attenuation should be considered. The percentage of service area will be the percentage of those geographical coordinates that meet the minimum requirement of C/(N+I) for a given service availability.
If a specific MODCOD is selected for all service area, it is probable that in rain conditions there are not availability in a percentage of service area depending of C/(N+I) relation required. If it is required to maintain availability greater than 99.9% it is recommended to the VCM (Variable Coding and Modulation) or ACM (Adaptive Modulation and Coding) of DVB-S2X standard [5].
E. G/T of UT
Attenuation in the link of the Satellite to the user stations in rain conditions must be taken into account to determine the value of the minimum G/T ratio that the UT should have. Rain attenuation will be different throughout the service area which will impose a different G/T of the user stations depending on their location.
For the proposed methodology, it is possible to take into account the maximum G/T required in the entire service area (worst case) or to use the specific value for each region of coverage; in the latter case, it is needed an analysis of variance in the coverage for verify that the methodology is still valid.
F. Costs Model and Mass of Payload Model
Two important constraints are the total cost of system and payload mass, the maximum total cost and maximum mass of payload should be defined before applying the methodology.
The satellite cost model (Eq. 3) includes a constant cost of 180 million euros, including an average launch cost of 100 million euros and a fixed cost of 80 million euros as the minimum price of a broadband payload. A corrective term depending on the number of beams (N) has been added [6].
𝐶𝑜𝑠𝑡𝑠𝑎𝑡 = 180 + 1.8𝑁 ( 3 )
In [7], it can be observed that the cost of ground segment varies between 10% and 15 % of total cost of system (Costsat + CostGt). The gateways cost model in millions of euros (Eq. 4) should be studied with more
waring; in this paper the cost model of gateways depends of obtained result in [8], assuming CostGt like the
cost of typical satellite hub infrastructure multiplied needed number of gateways (NGt). The cost model (in
millions of euros) includes a factor of 0.29 per each gateway, this include the cost of technical and legal requirements and a correction factor of costs of antennas gateways, which depend of a diameter of an antenna gateway (DGt), typical diameter of antenna gateway, number of polarizations (Np), and number of
color of frequency plan (Nc).
𝐶𝑜𝑠𝑡𝐺𝑡 = (0.29 + ( 𝑁𝑝 𝐷𝐺𝑡 12 𝑁𝑐)
2.7 ) 𝑁𝐺𝑡 ( 4 )
The mass of the payload (kg) depends on the number of beams (N). This simple mass model (Eq. 5) includes a constant mass of 4000 kg as the minimum mass of a full broadband satellite [6].
𝑀𝑎𝑠𝑠𝑠𝑎𝑡 = 4000 + 𝑁0.2912 ( 5 )
III.
Fundamentals of the Method of Optimizing the Costs of a Satellite Network
There is a method of optimizing the cost for satellite network [4] with a focus on the analysis of the downlink of the forward link. In that optimization method, it is proposed to vary the number of beams in a coverage area and analyze the different design parameters involved. This method shows a first approximation to the dimensioning of the multiple variables that exist in a multibeam satellite communications system. However, this method does not consider parameters such as the G/T of earth station and the uplink in the forward link, where the Q/V band will be used.The model to implement the optimization in this paper is based on the next sections:
A. EIRP footprint
For this paper, Eq. 1 and Eq.2 allow to compute the gain in a beam by varying the angle at which the receiver is positioned. Next step is calculation of the antenna gain for the set of latitude, longitude (lat, lon, pair) points located in the service area. It is possible using radiation diagrams of real antennas, however, it should be remembered to make the projection in the geographic coordinates corresponding to each beam. The side lobes of the satellite antenna pattern are considered only for the calculation of C/I using Eq. (1).
(a) Scenario 1, 43 beams (b) Scenario 2, 103 beams (c) Scenario 3, 171 beams
Figure 2 Scenarios of EIRP footprints in North America
Θx is represented in spherical coordinate system r,, that is defined being centered in the satellite antenna, this is transformed in coordinate system x, y and z (Eq. 6) and finally in coordinate system λ(lon), Ψ(lat) and r (Eq. 7) [9]:
{
𝑥′= −𝑟 cos θ
𝑦′= 𝑟 𝑠𝑖𝑛 θ cos 𝜑
𝑧′= 𝑟 sin θ sin 𝜑 ( 6)
(𝑥
′
𝑦′
𝑧′) = (
cos 𝜆 sin 𝜆 0 − sin 𝜆 cos 𝜆 0
0 0 1) (
cos 𝜓 0 sin 𝜓
0 1 0
− sin 𝜓 0 cos 𝜓) ( 𝑥 𝑦
𝑧) ( 7 )
Finally, once the antenna gain for every point in the area has been computed, the EIRP footprint (dBW) is obtained straightforwardly adding the transmit power of the onboard TWTA. Fig. 2 shows three scenarios of EIRP footprint for different numbers of beams in North America. It can be observed that if the number of beams increases, the beamwidth decrease, the θx decrease too, so, the antenna gain and
maximum EIRP (dBW) increase.
B. Cochannel Interference Model
In a multibeam coverage with frequency reuse, there will be two types of interference: the interference induced by the spots using the same color but spatially separated, called co-channel interference Ico [10].
In [4] it can be observed that the C/I (lat, lon) decrease as the number of beams increases. The co-channel interferences are directly dependent on the number of colors for the frequency reuse, and can be calculated considering the set off co-channel beams in the system as:
𝐼𝑐𝑜(𝑙𝑎𝑡, 𝑙𝑜𝑛) = ∑𝑀𝑞=1𝐼𝐶𝑜𝑃𝑐𝑜(𝑞, 𝑙𝑎𝑡, 𝑙𝑜𝑛) ( 8 )
Where q represents the q-th interferer spot and MICo is the total number of copolar interfering beams.
C. Link budget
The link-budget calculation is based on well-known link-budget models [11] and on the International Telecommunication Union (ITU) recommendations. In the forward link, the uplink and downlink analysis are shown in Eq. 9 and Eq. 10, respectively:
𝐶
𝑁𝑢= 𝐸𝐼𝑅𝑃𝐺𝑎𝑡𝑒𝑤𝑎𝑦+ ( 𝐺
𝑇)𝑆𝑎𝑡− 𝐿𝑢+ 228.6 − 𝐴(𝑙𝑎𝑡, 𝑙𝑜𝑛, 𝑝) − 𝐵𝑊𝐴 ( 9)
𝐶
𝑁𝑑(𝑙𝑎𝑡, 𝑙𝑜𝑛) = 𝐸𝐼𝑅𝑃(𝑙𝑎𝑡, 𝑙𝑜𝑛) + 𝐺
𝑇(𝑙𝑎𝑡, 𝑙𝑜𝑛) − 𝐿𝑑(𝑙𝑎𝑡, 𝑙𝑜𝑛) + 228.6 − 𝐴(𝑙𝑎𝑡, 𝑙𝑜𝑛, 𝑝) − 𝐵𝑊𝑏 ( 10 )
Where C/Nu is the carrier to noise ratio in the uplink for each gateway communication, G/Tsat is the
figure of merit of the antenna satellite in the direction of the gateway, BWA is the availability bandwidth of
each gateway, C/Nd(lat,lon) is the carrier to noise ratio in the geographical position, G/T (lat,lon) is the figure of merit of the ground terminal, 𝐿𝑑(𝑙𝑎𝑡, 𝑙𝑜𝑛) is the free-space losses in geographical position, BWb
is the noise bandwidth per beam, p is the link availability over a year and A(lat,lon,p) is the total attenuations due to atmospheric at geographical position given link availability p calculated using ITU recommendations [12].
Depending on the selected MODCOD, a minimum value of C/(N+I)d will be required. On the other
hand, depending on the annual availability desired, losses due to rain attenuation should be considered. The percentage of service area will be the percentage of those geographical coordinates that meet the minimum requirement of C/(N+I)d. In Eq. 11 (lineal form), it can be seen that the C/(N+I)d of a bent-pipe
satellite link depends on the C/Nd and the C/I of the link, so if the percentage of service area is not met
there is a possibility that it is by a very low value of C/Nd or C/I and depending on this the decision is
made whether to increase or decrease the number of beams.
(𝑁+𝐼𝐶 ) 𝑑
−1
(𝑙𝑎𝑡, 𝑙𝑜𝑛) = (𝐶𝑁) 𝑑
−1
(𝑙𝑎𝑡, 𝑙𝑜𝑛) + (𝐶𝐼)−1(𝑙𝑎𝑡, 𝑙𝑜𝑛) ( 11)
D. Capacity per beam
In [4] is explained as the transmission channel of a HTS satellite can be considered an AWGN channel using the central limit theorem. Therefore in this study was used the classic way of calculating the channel capacity that each beam would have (Eq. 12). Spectral efficiencies for the MODCODs of commercial modems can also be used to obtain the capacity of each beam. The channel capacity per beam is a principal constrain of MODCOD used in the service area, the Eq. 13 shows the maximum spectral efficiency permitted in the channel.
𝐶𝑏𝑒𝑎𝑚 = 𝐵𝑊𝑏(1 +𝑁+𝐼𝑆 ) ( 12 )
𝑆𝐸𝑚𝑎𝑥= 𝐶𝑏𝑒𝑎𝑚
𝐵𝑊𝑏 ( 13 )
The required C/(N+I)d is obtained from the MODCOD tables of the DVB-S2X standard [13].
E. Relationship between uplink and downlink during forward link
When the Ka or Q/V bands are used for feeder link; the relationship between uplink and downlink during forward link is given by the channel capacity of each beam provided on the link, number of beams,
number of gateways, frequency plan and bandwidth. This relationship can be observed in Eq. 14 and Eq.15 [1] [14].
𝐵𝑊𝑇 =
𝐵𝑊𝐴 𝑁𝑏𝑁𝑝
𝑁𝑐 ( 14 )
𝑁𝐺𝑡=𝑁𝑏𝐵𝑊𝑏
𝐵𝑊𝐴𝑁𝑝 ( 15 )
Where Cbeam is the capacity per beam, BWA is available bandwidth, Nc is the number of color on the
frequency plan, BWT is the total system bandwidth, Nb is the number of beams, Np is the number of
polarizations of the frequency plan, BWb is the bandwidth per beam and NGt is the number of gateways
needed for the number of beams.
For example, to provide coverage in Europe using 84 beams and using a frequency plan of 2 polarizations and 4 colors, there are two scenarios for a bandwidth of 250 MHz in each beam; the first scenario is to use the Ka band in feeder link and the second scenario is to use Q/V band. If the Ka band is used, there will be a 1.3 GHz available bandwidth, which would require at least 9 gateways to power all the beams. If the Q/V band is used, there will be available bandwidth of 2.5 GHz, which would require at least 5 gateways to power all the beams.
IV.
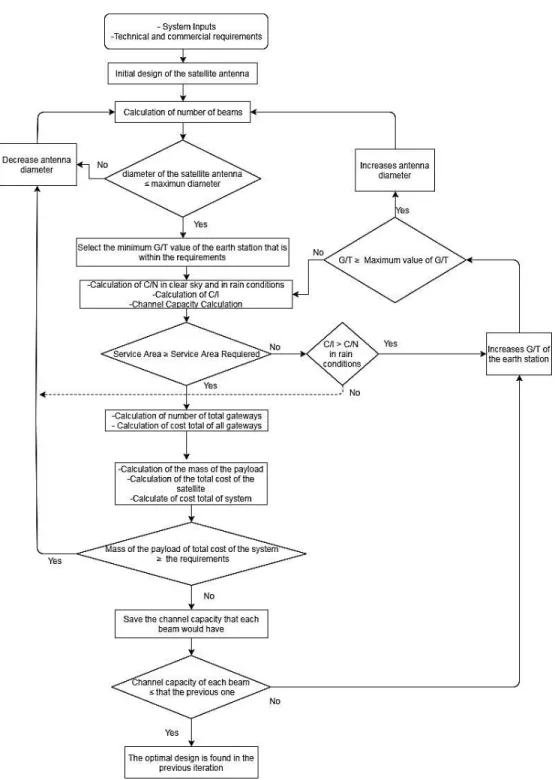
Flow Chart for the Optimization of the Costs of a Satellite Network
The methodology presented in the following flow chart achieves the best system for the highest capacity achievable according to a set of technical and commercial requirements with the corresponding number of beams required and the G/T ratio of the user terminal. The iteration (Fig. 3) is done by increasing or decreasing the diameter of the satellite antenna, which affects the number of beams until the maximum capacity is reached and satisfies all the requirements.
The parameters of technical and commercial input are defined. Some technical requirements are the frequency plan, transponder output power, bandwidth, the frequency band for the feeder link (Ka or Q/V band), number of colors for frequency reuse and others. The commercial requirements are the service area, the maximum cost of the operation, the availability required and others. To start the iterations, select an antenna diameter that will be reflected in the number of beams.
The EIRP footprints are generated to first calculate the C/Nd and the C/I on each geographical
coordinates in all service area and then perform an advanced link budget to obtain the average yields in terms of C/(N + I)d.
It is verified that the performance of the system under rain conditions satisfies the criteria of the selected MODCOD within the technical requirements. If rain conditions do not meet the requirements of the selected MODCOD, increase the G/T of the user station throughout the service area, it must meet the requirements or until it reaches the maximum allowed G/T UT (this is a limitation). Reaching the maximum allowed point of G/T, increase the diameter of the satellite antenna to increase the number of beams in the coverage. If the selected MODCOD requirements are not reached due to C/I < C/Nd, the
number of beams should be reduced by varying the antenna diameter.
Calculate capacity per beam, store and compare with previously selected systems. If the capacity per beam is higher than the previous systems, increase the G/T UT until it reaches the maximum allowed, before increase the diameter of antenna for increase the number of beams. If the capacity per beam remains the same or is lower (for example, very high interference), stop the process.
For a non-compliant system, decrease the number of beams (decrease the diameter of antenna) until the criteria are satisfied again. Once the highest capacity is reached, stop the process.
This methodology has four important differences respect the methodology in [4]:
1) This paper compares the use of Q/V or Ka band in the feeder link in terms of performance and cost. In the process, the impact of the required number of gateways in the cost and performance is considered. 2) The diameter of the satellite antenna is variable, i.e. in technical requirements the maximum allowed value that can be measured is established and depending on whether it increases or decreases this diameter, increases or decreases the number of beams required to provide coverage. The other method fix the diameter of reflector antenna, change the number of beam in function of the design of the antenna.
3) There are two possible cases when the service area does not meet the availability requirements; either because the C/N in rainy conditions is much smaller than the C/I in most of the service area or the opposite case (these two conditions are important to decide to increase or decrease the number of beams). In [4], it is assumed that the availability requirement is not achieved throughout the service area due to co-channel interference, and in case of this situation, the number of beams is diminished. 4) The impact of the G/T of the earth station is considered in the optimization process, as the cost of the
system is determined by the G/T (a higher the G/T implies a more expensive station).
Figure 3 Flow chart for the optimization of costs of a satellite network
V.
Results
This section presents some results of the methodology for coverage in the North America region from a satellite position in 109 W. This analysis proposed a system for its implementation, using a TWTA power of 20 dBW, a maximum G/T UT of 23 dB/K in all service area like constrain, a maximum of 2.5 m of satellite antenna diameter, and two important constrains; maximum total cost of 1000 M€ and maximum mass payload 67 000 Kg.
A. Downlink Analysis during forward link in clear sky conditions
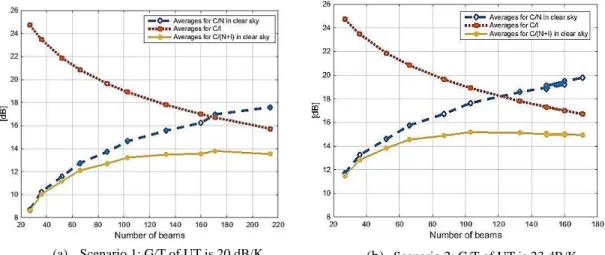
In Fig. 4 the evolution of C/Nd average, C/I average and C/(N+I)d average in all coverage for clear sky
conditions with the number of beams can be observed. In the first scenario (a), a G/T ration of 20 dB/K is used in the service area, the optimal number of beams seems to be in the range of 160-180 beams in terms of C/(N+I)d average, which average in all coverage is the range of 13.5-14 dB. In second scenario (b), a
G/T ration of 23 dB/K is used in all coverage, the optimal number of beams seems to be in the range of 100-130 beams in terms of C/(N+I)d average, which average in all coverage is the range of 15-15.5 dB. It
can be observed that the optimal number of beams is grater if the G/T ratio of UT is less in the service area because the C/Nd average is less and consequently the C/(N+I)d is less too.
(a) Scenario 1; G/T of UT is 20 dB/K (b) Scenario 2; G/T of UT is 23 dB/K
Figure 4 Downlink C/(N+I)d as a function of the number of beams
Figure 5 Channel Capacity per beam
Channel capacity results area shown in Fig. 5. The maximum capacity of the system for scenario 1 (G/T of UT in all coverage of 20 dB/K) is obtained for 170 beams and the maximum capacity per beam would be
in this case 1.17 Gbps, thus, leading to satellite with a total satellite capacity of 198.9 Gbps. The maximum capacity of the system for scenery 2 (G/T of UT in all coverage of 23 dB/K) is obtained for 103 beams and the maximum capacity per beam would be in this case 1.27 Gbps, thus, leading to satellite with a total satellite capacity of 130.81 Gbps.
It can be observed that a greater G/T ration of UT, the channel capacity per beam is greater, but the total satellite capacity for the optimal number of beams is smaller because the optimal number of beam is smaller too. The increase of G/T ratio of UT is a conditioner for decrease of optimal number of beams for reduce total cost of system and mass of payload but at the cost of lower total capacity of the satellite, that is a trade-off.
B. Downlink Analysis during forward link in rain conditions
In Fig. 6 shows C/N maps (in dB) in clear sky conditions and assuming rain in the downlink for 99.9% availability for two different numbers of beams (80 and 103 beams), these maps assuming a G/T ratio of UT of 20 dB in the service area. It can be observed that the higher the number of beams, the better the C/N performance, thanks to the higher gain in the satellite antenna. However, a large number of beams increase the satellite mass and cost.
(a) Clear Sky- 80 beams (b) Rain conditions (99.9% availability yearly) – 80 beams
(c) Clear Sky – 103 beams
(d) Rain conditions (99.9% availability yearly) – 103 beams
Figure 6 Maps of C/N in dB for G/T of UT of 20 dB
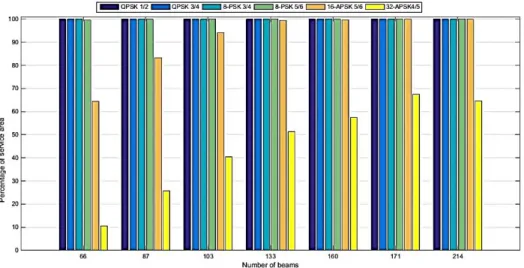
Link availability imposes a C/(N+I)d requirement which leads to the use of a particular MODCOD.
Service area will be dependent on the link availability and selected MODCOD [6] [13]. The trade-off between the number of beams, service area and capacity per beam must be evaluated to obtain an optimal solution. Fig. 7 presents the link availability in the coverage depending of number of beams and MODCOD used for an availability of 99.9% yearly and Fig. 8 presents the link availability in the coverage depending of number of beams and MODCOD used for an availability of 99.8% in second scenario. The increase in
number of beams implies a higher order MODCOD while the C/I ≥ C/Nd, and thus a higher availability
yearly implies an less order MODCOD, as long as the C/I value is not too low, and thus implies a higher beam capacity at the expense of increasing the satellite cost and mass.
Rain is a major limitation for the frequency bands Ka and Q/V, there are two possible solutions to avoid losing availability in the service area in rain conditions. The first possible solution is to make a preliminary study of rain attenuation throughout the area service and make a plan of the G/T ratio that the user terminal should have to have the availability of desired service using a specific MODCOD. Another possible solution is to make use of the VCM (Variable Coding and Modulation) of DVB-S2X standard. These solutions will be considerate for a future improvement of methodology of optimizing.
Figure 7 Service area percentage for different MODCOD used (availability of 99.8% yearly)
Figure 8 Service area percentage for different MODCOD used (availability of 99.9% yearly)
C. Number of Gateways
This method of optimizing is design for a multibeam satellite network, which uses the Q/V band for the feeder link. The Eq. 14, Eq. 15 and Eq. 16 show the relation of channel capacity, number de beams and number of gateways. This equation describes a mixed system of Q/V of feeder link and Ka in user link [1].
In the Table 1 it can be seen vary of number of gateways needed for feeder all satellite communication for different scenarios for a G/T of UT of 20 dB/K in all coverage and using the Ka and Q/V bands for the feeder link, the needed number gateways is an important factor for the total cost of system.
The bandwidth for the feeder link is 1.5 GHz and 2.5 GHz for Ka and Q/V, respectively. The antenna dimeter of the gateways is 9.1 m.
The first column shows different scenarios of number of beams, the second column shows the channel capacity obtained of link budget of downlink, the number of colors and number of polarizations is scenarios of frequency plan. The costs of gateways are calculated using Eq. 4, in this paper it is assuming that the cost of one gateway in Ka band is equal than one gateway in Q/V band, because the costs of the antenna diameter and technical requirements are a trade-off.
It can be observed that dual polarization is optimal for the systems, when only polarization is used the number the needed gateways increase considered. The number of gateways increase is for using Ka band in the feeder link. The total number of gateways needed is an important factor for the cost of systems; furthermore always it is recommended a mayor number of gateways than the minimum requirement to add redundancy. Using Q/V band, it can save 39-41% of the total cost of gateways.
Table 1 Number of gateways for different number of beams using Ka and Q/V bands in the feeder link (G/T of UT is 20 dB/K, and 250 MHz per beam).
Number of beams
Gbps per beam
Number of Colors
Number of polarization
Number of gateways (Ka band)
Total cost gateways (Ka band) Millions €
Number of gateways (Q/V band)
Total cost gateways (Q/V band)
Millions €
84 1.08 4 2 7 2.53 5 1.80
3 1 14 5.06 9 3.25
103 1.12 4 2 9 3.25 6 2.16
3 1 18 6.50 11 3.90
170 1.17 4 2 15 5.42 9 3.25
3 1 29 10.4 17 6.14
219 1.14 4 2 19 6.86 11 3.97
3 1 37 13.37 22 7.95
D. Impacts on cost
The key performance indicator (KPI) that is used to define the features of a HTS satellite is the cost of a Gbps-in-orbit. Fig. 9 depicts the decrease of the cost-per-Gbps with the number of beams and plotted for different G/T in the earth station. Fig. 9 shows that above 200 beams, the number of beams no longer influences the cost of a Gbps but the greater number of beams as both the satellite cost and capacity are increased. On the other hand, it is observed that when a small number of beams is available, the G/T of the station has a great influence due to the capacity limit imposed by the G/T.
Figure 9 Cost per Gbps depending on the number of beams and the G/T of the earth station (Antenna Gateways Dimeter of 9.1 m)
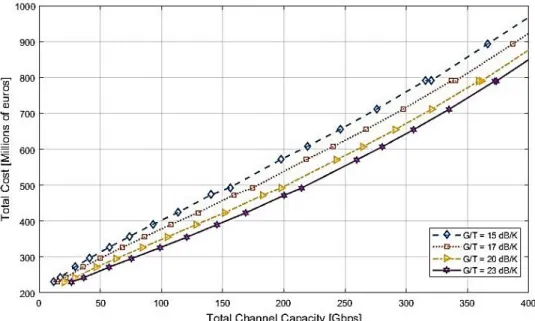
In Fig. 10, it can be observed the channel capacity per beam if a total cost of systems (Costsat + CostGt)
is investment, using antenna diameter of each gateway of 9.1 m and 2.5 GHz of bandwidth for feeder link in Q/V band. It can be seen that using a G/T UT of 23 dB/K in all coverage, the total system cost for the maximum channel capacity per beam (1.27 Gbps/beam) is around 420 M€. For a G/T UT of 20 dB/K, the total system cost for maximum channel capacity per beam (1.15 Gbps/beam) is around 500 M€. The total system cost for maximum channel capacity per beam (1.02 Gbps/beam) is around 610 M€ for a G/T UT of 17 dB/K. The maximum channel capacity per beam is 0.96 Gbps/beam for a G/T UT of 15 dB/K and cost of 800 M€. However, it must be remembered that the channel capacity per beam is obtained by the number of beam (Fig. 11), thus the total capacity of systems will also be like this.
Figure 10 Gbps per beam depending of Total Cost of System and the G/T of the earth station (Antenna Gateways Dimeter of 9.1 m and Q/V band for feeder link)
Figure 11 Total Cost of system depending of Total Channel Capacity of System and the G/T of the earth station (Antenna Gateways Dimeter of 9.1 m and Q/V band for feeder link)
An important design factor of system is the Gbps obtened per each Million of euros invested on the system. In Fig. 12 it can be observed the Gbps per each Millions of euros invested depending of number of beams anda G/T UT. When the number of beams is less than 250, the G/T UT is an important factor for increasing the Gbps per M€. At first, increasing the number of beams implies a higher performance but it is important to consider the mass of system and total cost of system to take a decision.
Figure 12 Gbps per each M€ invested
VI.
Conclusion
The optimization method proposed in this paper can be applied to any coverage scenario, or frequency plan, this provides an idea of the impact of multiple variables on the performance and cost of multibeam satellites. Increasing the satellite antenna diameter increases the number of beams, and it is observed that the C/Nd increases because the gain of each beam increases, but the C/I decreases due to co-channel
interference. Therefore, in terms of C/(N + I)d it could be said that the optimal number of beams is found
when C/Nd is equal to C/I in clear sky conditions (it is assumed that most of the year will not rain).
However, another important factor to be taken into account is the availability of the service (it is calculated in rain conditions), in order to comply with the service area requirement the MODCOD used must be modified (which will influence the benefits of service) or increase the G/T of the earth station (which will increase the cost of the earth station).
On the other hand, mass of the satellite and the total cost of the operation are limiting requirements in the design and implementation of the satellite.
Q/V band in the feeder link reduces an important cost in the total system because the needed number of gateways is less than Ka band in the feeder link. Other form of reduces cost of gateways is using dual polarizations.
Using a higher G/T ratio in user terminal, it is possible to reach the optimal system with a lower cost because the needed of number of beams is less for optimal system in terms of Gbps/beam, however, it must be remembered that the channel capacity per beam is obtained by the number of beam, thus the total capacity of systems will decrease.
Future advances in this work include the cost considering the return. We also aim at formalizing the methodology for the optimization of satellite system in terms of cost and capacity considering a large set of variables such as the use of VCM and ACM.
Acknowledgments
Authors acknowledge Spanish Government, Ministry of Economy, National Program of Research, Development and Innovation for the support of the project ENABLING-5G “Enabling Innovative Radio Technologies for 5 G Networks” (project number TEC2014-55735-C3-1-R).
References
[1] Evans, Barry, and Thompson, Paul, “Key issues and technologies for a Terabit/s satellite,” AIAA International Communications Satellite Systems Conference, Anaheim, California, 30 August – 2 September 2010. [2] Chatzinotas, Symean, Zheng, Gan and Ottersten, Bjorn, “Joint Precoding with Flexible Power Constraints in
Multibeam Satellite”, 2011 IEEE Global Telecommunications Conference (GLOBECOM 2011). [3] Blahut, R. E. “Principles and Practice of Information Theory”, MA: Addison-Wesley, 1987.
[4] Serrano-Velarde, D., Lame, E., Fenech, H. and Rodriguez, G. F., “Novel Dimensioning Method for High-Throughput Satellites: Forward Link”, IEEE Transactions on Aerospace and Electronic Systems, vol. 50, no. 3 July 2014.
[5] European Telecommunications Standards Institute, "Digital Video Broadcasting (DVB) Second generation framing structure, channel coding and modulation systems for Broadcasting, Interactive Services, News Gathering and other broadband satellite applications; Part 2: DVB-S2 Extensions (DVB-S2X)", October, 2014.
[6] European Telecommunications Standards Institute. “ETSI EN 302 307, v1.2.1 (2009-08)”, European Telecommunications Standards Institute, Tech Rep., 2009.
[7] Pacome Revillon, “Fundamentals and Dynamics of the Satellite Communications Business”, Euroconsult 2016.
[8] Harilaos Koumaras, “A comparative CAPEX Techno-economic Analysis of NFV Applicability on the ground segment of GEO/MEO/LEO Satellite”, Technical Report published 2017 via INFOLYSiS P.C.
[9] Zolnay, S. L., “Earth coverage (Footprint) of a satellite-borne-antenna”, Massachusetts Institute of Technology Lincoln Laboratory, 1971.
[10]Fech, H., Tomatis, A., Amos. S., Soumpholphakdy, V., and Serrano Merino, J. L., “Eutelsat HTS systems”,
International Journal of Satellite Communications and Networking, 26 January 2016.
[11]Maral, G., and Bousquet, M., “Satellite Communications Systems: Systems, Techniques and Technology”, Chichester, United Kingdom: Wiley, 2012.
[12]International Telecommunication Union, “Radiocommunication Sector. ITU-R recommendations 618-10: Propagation data and prediction methods required for the design of Earth-space telecommunication systems”.
International Telecommunications Union, Tech Rep., 2009.
[13]European Telecommunications Standards Institute, “Digital Video Broadcasting (DVB) Implementation guidelines for the second-generation system for Broadcasting, Interactive Services, News Gathering and other broadband satellite applications; Part 2 - S2 Extensions (DVB-S2X)”, Mach 2015.
[14]Ho, Hau, Squires, Ronald, and Brown, Christopher, “Q/V band satellite feeder links - Ready for Deployment,” Northrop Grumman Aerospace Systems.