INFLUENCE OF THE MINERAL ADDITION ON THE DURABILITY OF MEDIUM STRENGTH SELF-COMPACTING CONCRETE
Ester. B. Bermejo, PhD, Universidad Politécnica Madrid, Madrid, Spain Jaime C. Gálvez, PhD, Universidad Politécnica Madrid, Madrid, Spain Manuel F. Cánovas, PhD, Universidad Politécnica Madrid, Madrid, Spain
Amparo Moragues, PhD, Universidad Politécnica Madrid, Madrid, Spain
ABSTRACT
Self-compacting concrete (SCC) is an innovative concrete that does not require vibration for placing and compacting. SCC, developed in Japan in the 1980s, provides a present-day and attractive challenge for many researchers, as the long list of papers on the topic corroborates. Nevertheless, the durability of SCC, especially medium strength SCC, provides the researcher with
opportunities for study in depth.
This paper deals with the durability of SCC: two SCC mixtures, with 30 MPa compressive strength, are studied. The main difference between the two SCCs is the type of the addition: fly ash and limestone powder.
The microstructure and products of hydration of the SCC are analyzed by
means of Mercury Porosimetry Intrusion(MPI) and TG/DTA techniques. The
penetration of water under pressure, chloride diffusion and CO2 penetration
are also analyzed at different ages of the SCC specimens. Fresh and mechanical properties are also evaluated.
Microstructure, durability properties and mechanical behaviour are analyzed together, and then associated with the role of the admixture (influence of the type of admixture). Conclusions are then presented.
Keywords: Self-compacting concrete, Durability, Pore size distribution, Hydration,
INTRODUCTION
Self-compacting concrete (SCC) was originally developed in Japan in the mid-1980s, under
the leadership of Prof. Okamura1. SCC has been increasingly used in ready-mix concrete and
in the precast industry to improve several aspects of construction. Though SCC has been examined by many researchers, some questions remain unanswered, especially durability aspects in comparison with vibrated concrete (VC), with the few results available2-3 on this topic usually concerning high-performance concrete (HPC). Less attention has been devoted to the durability of low and medium strength concrete4, and the effect of the addition (filler) in such durability. High volume of addition on the mix proportioning of SCC modifies the
porous structure5-9, and affects transport mechanisms of liquids and gases. These aspects
require concerted analysis.
The purpose of this paper is to study the influence of the addition type on the mechanical properties, fresh behaviour and durability of low-strength SCC (characteristic compressive strength of 25 MPa). Two SCCs, with the same mix design, though with different types of addition were cast and tested. Fly ash and limestone powder were used to make the concrete. Properties of fresh mix concrete, mechanical properties of hardened concrete and durability tests were performed. Accelerated carbonation tests, Cl- ion diffusion on saturated specimen and water penetration under pressure tests were performed for both SCCs. Moreover, the porous structure was determined by means of mercury intrusion porosimetry (MIP), and the hydrated products by means of ATD/DTG.
Whereas the following section introduces the materials used, the subsequent section examines the experimental programme. Results are then presented, with discussion and conclusions being provided at the end.
MATERIALS
Two mixes of SCC were studied. These mixes were cast using the same cement: I 42.5 R/SR (sulphate resistant). Siliceous rolled with grade 0/4 sand and 4/16 gravel were adopted. Siliceous fly ash and limestone powder were adopted as additions, with an upper limit of 250
kg/m3. Policarboxylate superplasticiser (SIKA Viscocrete 3425) was used as an admixture.
No viscosity modifying agent was needed.
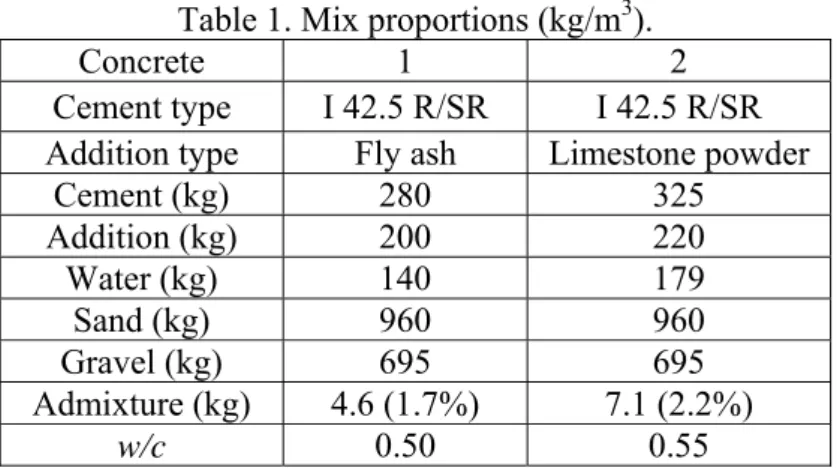
Table 1 shows the mix proportions for both SCCs. The mix design was made to perform SCC with 25 MPa characteristic strength. Table 1 shows several differences on the quantity of cement, water/cement (w/c) ratio and admixture dose.
The concrete was mixed using a vertical-axis planetary mixer with a capacity of 100 L.
Concrete samples were cast in various cylindrical moulds of two sizes (15 φ x 30 cm height
Table 1.Mix proportions (kg/m3).
Concrete 1 2
Cement type I 42.5 R/SR I 42.5 R/SR
Addition type Fly ash Limestone powder
Cement (kg) 280 325
Addition (kg) 200 220
Water (kg) 140 179
Sand (kg) 960 960
Gravel (kg) 695 695
Admixture (kg) 4.6 (1.7%) 7.1 (2.2%)
w/c 0.50 0.55
EXPERIMENTAL PROGRAMME
TESTS FOR FRESH SCC
Three tests were performed: the slump flow test (according to UNE 83361 standard), L box (in accordance with the UNE 83363 standard) and V-funnel (UNE 83364 standard). Fig. 1 shows the “slump-flow spread”. Fig. 2 shows the fresh concrete in the L Box after testing.
Fig. 1 “Slump-flow spread” after slump flow test.
TESTS FOR HARDENED SCC
In mechanical terms, three properties were measured: compressive strength (EN 12390-3 standard), elasticity modulus (UNE 83316 standard) and tensile strength (EN 12390-6 standard). The tests were performed at seven, 28 and 91 days of the age of the samples.
TESTS FOR DURABILITY
The tests performed for durability characterization were the following: water penetration under pressure, accelerated carbonation and chloride diffusion on saturated sample. All began when the concrete age was at 91 days.
Water penetration under pressure test was performed with cylindrical 15φ x 30cm height
samples, in accordance with the EN 12390-8 standard. Water applied pressure was 500kPa with a duration of three days. Fig. 3a shows the specimen under testing, and Fig. 3b the final depth profile of water inside of the split specimen.
a) b)
Fig.3 Water penetration under pressure tests: a) specimen under testing, and b) wet profile on the split tested specimen.
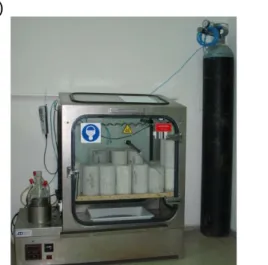
An accelerated carbonation test was performed with cylindrical 10φ x 20cm height samples.
The specimens were placed in a carbonation chamber, with a constant temperature (23ºC ±
2ºC) and relative humidity (65% ± 1%). The tests were carried out at a CO2 concentration of
6% ± 1%, with the difference being a maximum 100% N2. The carbonation depth was
measured with phenolphthalein (UNE 112011 standard). Measurement was carried out at 120, 150 and 180 days of concrete life. Fig. 4a shows the carbonation chamber and Fig. 4b the carbonated ring on a sample after the phenolphthalein application.
Chloride diffusion test was performed with cylindrical 10φ x 20cm height samples, in
under unidirectional diffusion (waterproofing vertical face and bottom base of the cylinder) in an aggressive solution (NaCl concentration of 3% in deionized water) at 20ºC. Measurement of the chloride concentration inside the specimen was performed down to the depth of 30mm, with intervals of 6mm. The UNE 112010 standard was adopted for measurement of the chloride concentration.
a) b)
Fig. 4 Accelerated carbonation test: a) Carbonation chamber, and b) carbonated ring on a sample after the phenolphthalein application.
TESTS FOR POROUS STRUCTURE AND BINDER HYDRATION
MIP tests were performed with a Micromeritics porosimeter, Autopore IV 9500 model, which reached a pressure of 228 MPa, and measured diameter of pores from 0.006µm to 175µm. Tests were performed when the concrete age was at 91 days. The ASTM D4404 standard was adopted. The weight of the sample was 3.5 g ± 0.3 g. The specimen was dried at 40ºC and degasified. Fig. 5 shows the porosimeter. For modeling, the pores were idealized as cylindrical channels, and the Washburn-Laplace law was adopted to relate the mercury pressure with the radius of the pore.
Thermogravimetric analysis (TG/DTA) was performed to study the hydration of the binder and cement. The STA 791 device was used. The specimen was heated up to 1,000ºC, with a velocity of 10ºC/min. The reference material was α-Al2O3, heated at 1,200ºC. The tests were
carried out in N2 atmosphere with a flow of 80ml/min. Results, in accordance with the ASTM
a) b)
Fig. 5Mercury porosimetry intrusion test: a) porosimeter, and b) penetrometer with a
high pressure cell.
RESULTS
MECHANICAL RESULTS OF THE HARDENED CONCRETE
Fig. 6, 7 and 8 show the compressive strength, elasticity modulus and tensile strength (Brazilian test) of concrete life at seven, 28 and 91 days. Figures show the average values of three valid tests.
0 10 20 30 40 50 60 70
1 2
Strength at 7 days
Strength at 28 days Strength at 91 days
33
,5
29
,5
47
,7
35
,9
62
,3
40
,1
C
o
m
p
re
ss
iv
e s
tr
e
n
g
th
(M
P
a
)
Concrete
Fig. 6 Compressive strength.
behaviour. With regard to Concrete 2, the elasticity modulus close to being equal at 28 and 91 days. Tensile strength shows similar behaviour.
0 10 20 30 40 1 2
Elasticity modulus at 7 days
Elasticity modulus at 28 days Elasticity modulus at 91 days
30
,5 31,8
35 ,6 34 ,4 38 ,6 35, 1 E las ti c ity m odul u s ( G P a ) Concrete 0 1 2 3 4 5 6 1 2
Strength at 7 days
Strength at 28 days Strength at 91 days
3, 8 3,2 4,5 3, 9 5, 7 4, 1 Te n s il e s trengt h (M P a ) Concrete
Fig. 7 Elasticity modulus. Fig. 8 Tensile strength (Brazilian test).
RESULTS OF FRESH TESTS
Table 2 shows the results of the characterization of fresh tests. Table 2 also includes the reference values for a SCC.
Table 2.Fresh concrete tests results and limits by EHE-0810.
Concrete 1 2 (EHE-08)Limits 10
Slump flow T500 (s) 2.5 4.8 T50≤8 s
Øm (mm) 750 700 550mm ≤ df ≤ 850mm
V funnel TV (s) 9 12 4 s ≤ TV ≤ 20 s
L box T600 (s) 5.8 3 -
DURABILITY RESULTS
Fig. 9 shows the maximum water penetration depth, corresponding to the water penetration under pressure test, and the compressive strength. Concrete 1 shows lower depth water penetration. 0 10 20 30 40 50 0 10 20 30 40 50 60 70 1 2
Maximun wet depth (mm)
Compressive strenth at 91 days
13 ,5 16 ,5 62 ,3 40 ,1 M a x imu m d e p th wet ( m m ) C o m p re s s iv e st re n g th ( M Pa) Concrete
Fig. 9 Maximum wet depth in the water penetration under pressure test.
Fig. 10 shows the depth and velocity of carbonation. Carbonated depth and velocity of carbonation is higher in concrete 2. Table 3 shows the velocity of carbonation for both concretes. 8 12 16 20 24 28 32
4 5 6 7 8 9 10
Concrete 1 (C1) Concrete 2 (C2)
Ca rb on a te d d e pth ( m m )
Time1/2 (days)
C1 C2
Table 3. Carbonation velocity results.
Concrete Carbonation velocity
(mm/day1/2)
1 0.4 2 1.1
Table 4 shows the effective coefficient of chloride diffusion. Concrete 2 shows a higher value of the effective coefficient of chloride diffusion, approximately double the amount, than concrete 1.
Table 4. Effective coefficient of chloride diffusion.
Concrete effective coefficient of chloride
diffusion (mm2/s)
1 1.36E-8 2 2.99E-8
Fig. 11 shows the total mercury porosity when concrete age was at 91 days. Significant differences can be observed, with concrete 1 being more impermeable. Fig. 12 shows the average pore size and maximum depth water penetration (a water penetration under pressure test), and clearly concrete 2 shows the larger pores size. Table 5 shows the meso and macro pore volume, with notable differences being observed between concretes.
0 10 20 30 40 50 0 10 20 30 40 50 60 70 1 2 Porosity (%)
Conpressive strentgh at 91 days
8, 5 12, 1 62, 3 40, 1 To ta l poro s it y ( % ) Compressi v e s trent gh (M P a ) Concrete 0 5 10 15 20 0 5 10 15 20 25 30 35 40 1 2
Maximum wet depth (mm)
Mean pore size (nm)
24 32 ,5 13,5 16 ,5 Max im u m wet dept h (m m ) Me an por e s ize (nm ) Concrete
Fig. 11 Total mercury porosity and compressive strength at 91 days.
Table 5. Macro and meso pores volume.
Concrete Macro-pore volume (ml/g) Meso-pore volume (ml/g)
1 0.012 0.025 2 0.019 0.036
RESULTS OF TG/DTA
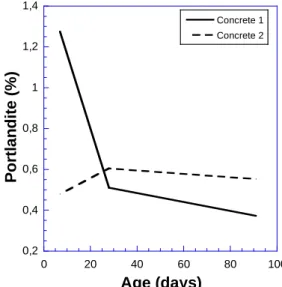
Fig. 13 shows the loss of water at seven, 28 and 91 days, with differences being notably
clear. Fig. 14 shows the Portlandite (Ca(OH)2). The influence of fly ash on concrete 1 is
evident. Fig. 15 shows the grade of hydration.
1,6 1,8 2 2,2 2,4 2,6 2,8
0 20 40 60 80 100
Concrete 1 Concrete 2
L
o
ss
o
f
h
y
dr
ati
o
n
w
a
ter (%)
Age (days)
0,2 0,4 0,6 0,8 1 1,2 1,4
0 20 40 60 80 100
Concrete 1 Concrete 2
Po
rtla
n
d
ite
(%
)
Age (days)
Fig. 13 Loss of hydration water. Fig. 14 Portlandite (Ca(OH)2) content.
9 10 11 12 13 14 15 16
0 20 40 60 80 100
Concrete 1 Concrete 2
H
y
dra
ti
o
n
gra
d
e
(
%
)
Age (days)
Fig. 15 Hydration grade
DISCUSSION
The main different between the concretes is the addition: fly ash (concrete 1) and limestone powder (concrete 2). Table 1 shows the mix proportions for each concrete. Clearly, the compressive strength evolution until 91 days is different. Similar behavior is shown by tensile strength and minor difference by modulus of elasticity.
Fig. 15 shows differences in the hydration process. The C-S-H gel caused by the pozzolanic reaction of fly ash is different (concrete 1) from the gel generated in concrete 2. Concrete 1 shows high hydration grade at seven days, and one lower at 28 days; concrete 2 shows low hydration grade at seven days, and a higher one at 28 days. In both cases there is no significant increment from 28 to 91 days.
The loss of hydration water (related with C-S-H content) and portlandite content are coherent, as Fig. 13 and 14 show. In concrete 1 the content of portalandite diminishes from seven to 28, due to the reaction of fly ash.
Compressive strength fit with C-S-H content.
CONCLUSIONS
• Fly ash is a more suitable addition for SCC; it improves the mechanical properties
and potential durability.
• The origin seems to be the pozzolanic nucleuses generated by fly ash, which
compacts the matrix of concrete.
• The obtained results confirm for SCC that macro-pores affect compressive strength,
water penetration under pressure andcarbonated depth. Meso-pores affect chloride diffusion.
ACKNOWLEDGEMENTS
The authors gratefully acknowledge the financial support for the research provided by the Spanish Ministerio de Ciencia e Innovación under grant BIA-2008-03523. In addition, they also thank the Ministerio de Fomento under grant MFOM-01/07, and the Instituto Español del Cemento y sus Aplicaciones (IECA) for the complementary financial support received.
REFERENCES
[1] Okamura H. (1997), “Self-Compacting High-Performance Concrete”. Concrete
International, Vol. 19, nº 7, 50-54.
[2] De Schutter G., Audenaert K. (2007), Durability of Self-Compacting Concrete. State of the Art Report of RILEM Technical Committee 205-DSC, RILEM, France.
[3] Zhu W., Bartos PJM (2002), “Permeation properties of self-compacting concrete”,
Cement and Concrete Research, 33, 921-926.
[4] Persson BA (2001), “A comparison between mechanical properties of SCC and the
corresponding properties of normal concrete”, Cem Concr Res, Vol. 31, 193-198.
[5] Assié, S., Escadeillas, G., Marchese, G. and Waller, V. (2006), “Durability properties
of low-resistance self-compacting concrete”, Magazine of Concrete Research, 58, No.
1, February, 1-7.
[6] Assié, S., Escadeillas, G. and Waller, V. (2007), “Estimates of self-compacting concrete “potential” durability”, Construction and Building Materials, 21, 1909-1917.
[7] Boel, V., Audenaert, K. and De Schutter, G. (2006), “Pore distribution of hardened cement paste in self compacting concrete”, Seventh CANMET/ACI International Conference on Durability of Concrete, SP-234-11.
[8] Audenaert, K., Boel, V. and De Schutter, G. (2006), “Influence of capillary porosity on transport properties of self compacting concrete”, Eight CANMET/ACI International Conference on Recent Advances in Concrete Technology, SP-235-1.
[9] Assié, S. (2006), “Durabilité des bétons autopaçants”, PhD Thesis, INSA de Toulouse, France, 248 pág.