Using aequorin probes to measure Ca
2+in intracellular organelles
María Teresa Alonso, Macarena Rodríguez-Prados, Paloma Navas-Navarro, Jonathan Rojo-Ruiz and Javier García-Sancho
Instituto de Biología y Genética Molecular (IBGM), Universidad de Valladolid and Consejo Superior de Investigaciones Científicas (CSIC), c/ Sanz y Forés 3, 47003Valladolid, Spain
Corresponding authors: Javier García-Sancho ([email protected]) and María Teresa Alonso ([email protected]), IBGM, c/ Sanz y Fores 3, 47003 Valladolid, Spain.
Special Issue: Methods for Monitoring Cell Function by Target Probes Editors: Alex Verkhratsky and Shmuel Muallem
Abbreviations
Abstract (90 w)
Aequorins are excellent tools for measuring Ca2+ in intracellular organelles as well as their
physiological and pathological changes. Ca2+ affinity can be optimized to match the actual Ca2+
concentration in the organelle. Some tricks for calibration of photoluminescent probes are
addressed to in this review. We also show that GFP-aequorin chimeras (GAP) can be used both
as luminescent and fluorescent Ca2+ probes, that they do not interfere with endogenous proteins
and do not produce phenotypic alterations in transgenic animals, where they are suitable for ex vivo and in vivo measurements.
Keywords:
Calcium signaling, Aequorin, Intracellular organella, Endoplasmic Reticulum, Golgi apparatus, Hippocampus, Skeletal muscle.
Highlights
o Aequorins are valuable orthogonal tools for measuring Ca2+ levels in organella o GFP-aequorin fusions can be used both as luminescent and as fluorescent probes
Javier, for your consideration:
“Nowadays GFP and its homologues are indispensable in biomedical research... The identification
of the fluorescent chromophore, however, depended on the GFP that had been accumulated for many years in our study of aequorin.Without the study of aequorin, the chromophore of GFP would have remained unknown and the flourishing of fluorescent proteins would not have occurred.”
O.Shimomura [1]
1. Introduction
Ca2+ signaling is the trigger of many physiological and pathological processes.
Intracellular organelles, by taking up and releasing Ca2+ to the cytosol, are important players for the generation of the cytosolic Ca2+ signals. In addition, the changes of Ca2+ concentration inside intracellular organelles are, by themselves, essential for regulation of functions such as gene expression in the nucleus, respiration in the mitochondria or protein processing in the
endoplasmic reticulum (ER). Therefore, direct measurements of organellar Ca2+ are required for a comprehensive view of Ca2+ homeostasis. This is best achieved by subcellular targeting of
genetically encoded Ca2+ indicators (GECI) to the location of interest. As first shown by Rizzuto et al. in mitochondria [2], targeted aequorins are excellent calcium probes for monitoring
subcellular Ca2+ dynamics. Luminescence emission, unlike fluorescence, does not require radiation of the sample, and this prevents tissue damage and other potential problems of
fluorescence measurements. Also, background is vey low and signal to noise ratio is much higher than that obtained with fluorescent indicators, allowing accurate detection and quantification of very small luminescence signals.
The Ca2+-sensitive photoprotein aequorin can be localized to specific organelles within the cell by the addition of protein targeting sequences. This strategy has been successfully used and will be briefly summarized below.
2.1. Cytosol
Although non-targeted aequorin has been extensively used as a cytosolic probe, the 22-kDa apoaequorin diffuses into the nucleus. Fusion of luciferase to the N-terminal of apoaequorin prevents permeation through the nuclear pore complex and passage to the nucleoplasm [3]. In addition, this fusion resulted in an increased stability of the aequorin protein in the cytosol [4].
2.2. Nucleus
A nuclear-targeted aequorin was first introduced by fusing aequorin to a fragment of the glucocorticoid receptor that contained a nuclear localization signal (NLS) [5]. An inducible version that included the hormone binding domain was later developed [6]. The chimeric protein is localized in the cytosol in the absence of glucocorticoids, and translocate to the nucleus upon hormone binding. Using both constructs, the authors found indistinguishable resting Ca2+ concentrations in nucleus and cytosol. An alternative strategy for efficient targeting of
an independent regulation of [Ca2+]N under some conditions [9].
2.3. Mitochondria
A mitochondria-targeted aequorin was originally constructed by fusing the pre-sequence of subunit VIII of human cytochrome c oxidase in frame at the N-terminus of apo-aequorin [2]. The encoded polypeptide is composed of the cleavable mitochondrial presequence, six amino acids of the mature mitochondrial polypeptide and the photoprotein aequorin. As an alternative, the presequence of subunit IV of cytochrome c oxidase can also be employed. A tandem duplication of the presequence has been shown to improve the mitochondrial localization [10]. These
chimeras are available both with the wild-type- and with a mutated version of aequorin, in which a substitution (D119A) was introduced in one of the Ca2+ binding sites of the photoprotein that reduces 20-fold the Ca2+ affinity of the photoprotein [11] (see section 2.5). The use of low affinity aequorins was essential to demonstrate that the Ca2+ concentration within the
mitocondrial matrix can reach milimolar levels repeatedly and without apparent damage [12]. More recently, a lower affinity aequorin (see section 3) has been expressed in the mitochondrial matrix [13]. Noteworthy, the mitochondrial matrix is alcaline (pH around 8.0) and this makes aequorin more adequate than other fluorescent Ca2+ sensors, because of the relative insensitivity of the bioluminescent emission to pH variations. A systematic comparison among the
performance of three mitochondrial Ca2+ probes (rhod-2, pericam and aequorin) concluded that aequorin was the most reliable indicator [14].
the cytosolic surface of the outer mitochondrial membrane. In the first case, aequorin was fused to glycerol phosphate dehydrogenase, an integral protein of the inner mitochondrial membrane, with a large C-terminal tail protruding on the outer side of the membrane [15]. In the second case, the N-terminal region of the human translocase protein 20 of the outer mitochondrial membrane was fused with aequorin [16]. In the first study, it was demonstrated that the mean [Ca2+] sensed by the probe in response to Ca2+ release from InsP3-sensitive ER channels is slightly higher than average [Ca2+]C, whereas in the second, no significant difference was observed.
The amount of photons emitted by aequorin in a single cell is low and this hinders
bioluminescence imaging. A harder task is monitoring Ca2+ dynamics inside organella (see section 5). By using a combination of viral vector high expression system and a photon counting camera [17], spontaneous mitochondrial Ca2+ oscillations could be detected in single pituitary cells in response to stimulation with hypothalamic factors [18] or in single pancreatic islets challenged with high glucose [19]. Even more challenging is imaging intraorganellar Ca2+ in vivo. Transgenic mice conditionally expressing the Ca2+-sensitive bioluminescent reporter GFP-aequorin targeted to the mitochondrial matrix were injected intraperitoneally with native
coelenterazine [20]. In this study authors succeeded recording mitochondrial Ca2+ rises in muscles of freely moving animals.
2.4. Plasma membrane
inner layer of the plasma membrane, and mutated aequorin was used for these purposes [21]. A subregion of the plasma membrane, the caveolae, is the target of a recent probe composed of caveolin-1 fused to the N-terminus of mutated aequorin [23]. The authors find that caveolar Ca2+ responses differed substantially from those reported by the probe SNAP25–aequorin in the plasma membrane.
2.5. Endoplasmic/sarcoplasmic reticulum
The first attempt to express aequorin in the ER was reported by Kendall et al. in the early nineties [11]. These authors added the calreticulin signal sequence to the N-terminus, and the peptide Lys-Asp-Glu-Leu (KDEL) [24] to the C-terminus of the apoaequorin in order to target the expression of aequorin to the ER and to prevent its secretion into the cytosol. As a proline located at the C-terminus of aequorin is reported to be important for light emission [25], they suggested that having a KDEL sequence might affect the activity of aequorin. Indeed, the level of [Ca2+] in the ER recorded ranged between 1 and 5 µM, far less than expected for the Ca2+ concentration in the ER ([Ca2+]ER). These authors also introduced a point mutation (D119A) which reduced 20 fold the Ca2+ affinity of the photoprotein respect to the wild type [26].
will be retained in the lumen of the ER. Other chimeric protein containing the invariant chain of class II major histocompatability complex fused to aequorin localized in the ER [28].
The earliest measurements in the ER were made using aequorin reconstituted with wild-type coelenterazine [27]. However, with the high [Ca2+] found in the ER/SR, aequorin gets very rapidly consumed. A crucial improvement was the reconstitution with the synthetic
coelenterazine n, which causes a lower affinity of the photoprotein for Ca2+, so it gets consumed more slowly than with wild-type coelenterazine [29]. The combination of a mutated apo-aequorin containing a D119A substitution in the third EF-hand domain reconstituted with coelenterazine n has proven a valuable tool in the study of ER Ca2+ signalling in the last decades (reviewed in [30]) (see section 4). More recently other aequorin mutants of lower Ca2+ affinity have been targeted to ER [31, 32]. These allow measurements of [Ca2+] in the millimolar range for long periods of time, without problems derived from aequorin consumption. The mutant containing the substitutions N28L/D119A is particularly interesting because it displays such a low affinity for Ca2+ that it can be used without the need to deplete the ER of Ca2+ before reconstituting with the cofactor [31].
A delivery strategy specific for the sarcoplasmic reticulum [33] was designed by fusing the resident protein calsequestrin to the N-terminus of a low-affinity aequorin [34].
2.6. Golgi apparatus
of this organelle (6.0-6.5 pH). The pioneer study employed a chimeric aequorin consisting of a fragment of the sialyltransferase fused to mutated aequorin [35]. The fusion polypeptide is retained in the lumen of the Golgi apparatus due to the 17 amino acid membrane-spanning
domain of the sialyltransferase, a resident protein of the lumen of the trans-Golgi network (TGN). This aequorin probe has been useful in several studies to establish the Golgi as a Ca2+ store and to characterize the role of secretory pathway Ca2+ ATPase 1 (SPCA1) [36] and sarco-endoplasmic reticulum Ca2+- ATPase (SERCA) [37] in accumulation of Ca2+ in this organelle. Although Golgi apparatus is a heterogeneous organelle composed of three main subcompartments (cis-, medial, and trans-Golgi), most of the existing studies consider it as a homogeneous compartment. This, together with the missexpression of the probe due to over-expression can probably account for the conflicting results on functional expression of InsP3Rs or SERCA in the Golgi apparatus[38]. We have recently addressed the issue of heterogeneity by developing two new specific aequorin probes, one for trans- and the other for cis/medial-Golgi. We used the mutated D119A aequorin fused to a fragment of galactosyltransferase or acetylglucosaminyltransferase for targeting to the trans- or cis-Golgi, respectively [39]. Our results show that both cis- and trans-Golgi accumulate Ca2+ to high concentrations (200–300 μM) through SERCA and SPCA1, respectively. In
addition, we found a diffusionally isolated trans-Golgi network subcompartment that takes up Ca2+ at lower concentrations (50 µM) through SERCA. The lower affinity probe GAP1, mentioned above for ER measurements, has also been expressed to the trans-Golgi, where it efficiently reported Ca2+ dynamics by luminescence [32] or fluorescence imaging [40].
2.7. Secretory vesicles
calcium measurements in acidic organelles such as the secretory granules or the endo-lysosome. An aequorin targeted to the secretory granule was developed and used in neuroendocrine cells to measure intra-granular Ca2+ concentration via fusion of mutated (D119A) aequorin to vesicle associated membrane protein (VAMP2/synaptobrevin) [41]. This probe was originally combined with coelenterazine n to measure secretory vesicle of pancreatic cells [42] or, later, with native coelenterazine for measurements in PC12 [43] or chromaffin cells [44]. These studies show that the secretory vesicles have a high Ca2+ content, in the range of tens of micromolar, which is releasable during agonist stimulation. An alternative strategy utilized to measure Ca2+ in the secretory granules of PC12 cells utilized a chimera of chromogranin A fused to aequorin [45].
2.8. Endo-lysosome
Recently, a new probe comprised a fragment of cathepsin D fused to the N-terminus of the mutated (D119A) aequorin has been developed to target aequorin to the endo-lysosomal system [46].
2.9. Peroxisome
The targeting strategy to the peroxisomal lumen was based on the fusion of the canonical peroxisomal targeting signal (PTS1), the tripeptide SKL, to the C-terminus of the aequorin protein [47]. Surprisingly, the C-terminal fusion in this chimera does not quench the luminescent properties of aequorin.
The approach adopted to target functional aequorins to gap junctions was to attach aequorin to the carboxyl tail of connexin 32 or connexin 43 [48, 49]. These chimeras were designed to measure the level of free cytoplasmic Ca2+ along the protein trafficking pathway and at the subplasmalemmal region.
3. Calibration of aequorins
The apoaequorin protein (AEQ) binds, in the presence of molecular oxygen, to the
prosthetic group coelenterazine (Clz) (Reaction 1). Upon binding of Ca2+, active aequorin (AEQ-Clz) decomposes into apoaequorin, coelenteramide (Cld) and CO2 with emission of blue light (Reaction 2):
AEQ + Clz + O
2AEQ -Clz
AEQ + Cld + CO
2+ Light
(1)
(2)
+ Ca
2+Reaction 1 is slow and reverts very slowly, so, in practice, it is irreversible. In order to be activated, aequorin expressed in cells must be reconstituted with coelenterazine by incubating cells with the cofactor during 1-2 hours in the absence of external Ca2+ prior to measurements. Reaction 2 is exponentially activated by Ca2+ with a Hill coefficient of 2-3 [30].
Due to consumption of the probe along the measurement, quantification and calibration of aequorin bioluminescence signal requires an analysis a bit more complex than that of
aequorin consumption (“burning”), thus reducing the remaining active form of aequorin before performing the experiment. Therefore, luminal Ca2+ must be depleted prior to reconstitution of the ER-targeted aequorin with coelenterazine and kept low during reconstitution. A low Ca2+ affinity AEQ system composed of mutated aequorin (ermutAEQ) and coelenterazine n [29] was used in the experiment of Fig. 1; in this way, the probe affinity matches the high [Ca2+] found in the ER lumen (see below). The experiment is started by the addition of Ca2+ (1 mM; Ca1 in the figure) in order to allow refilling of the Ca2+-depleted ER. Ca2+ uptake by the ER is evidenced by the slow increase of luminescence emission (Fig. 1A). Emission signal (dotted line) reached a maximum at about 2 min, and then decayed at 0.3-0.4 % per second. This decay reflects the rapid consumption of active aequorin exposed to the high [Ca2+] of the refilled ER. At 4.5 minutes after Ca2+ addition about 70% of the active aequorin has already been consumed (not shown). The experiment is typically ended by cell lysis with digitonin in the presence of excess Ca2+ (10 mM) in order to accomplish complete burning of the residual aequorin (this phase is not shown in Fig. 1A). This last step takes 10-15 min and it is necessary for computing the total luminescence (cps) of the sample in order to normalize the emission values (see below).
Direct analysis of raw data (dotted trace in Fig. 1A) can be confusing because two variables, [Ca2+]ER and aequorin consumption, are acting simultaneously along the experiment. In order to
remove eliminate the influence of aequorin consumption, data must be normalized by dividing the light emission at each time-point (L, in cps) by the total luminescence remaining in the cells at that defined time (LTOTAL). The ratio L/LTOTAL is proportional to [Ca2+]ER and independent of previous aequorin consumption. This normalization requires the cps remaining in the cells at each time point areLTOTAL is computed by subtracting the cumulative emitted cps from the total
of such a database can be downloaded from:
http://www.generabiotec.com/aequorins/AEQ_cps_ERGA3.xls
The plot of L/LTOTAL·(s-1) vs time provides a comprehensive account of [Ca2+]ER changes (continuous trace in Fig. 1A): Ca2+ is taken up into the ER where it reaches an steady state at about minute 4, which is sustained until full consumption of aequorin. The larger the
consumption, the more imprecise becomes L/LTOTAL computation. Underestimates of the total luminescence will lead to a declining L/LTOTAL value at the steady state; this artefact often occurs in long protocols when the researcher does not patiently wait long enough to collect the total residual cps at the end of the experiment. A faster procedure to estimate the total counts value by extrapolation has been reported elsewhere [32].
The L/LTOTAL values can be calibrated in Ca2+ concentrations by three alternative procedures: i) by measuring L/LTOTAL values in cellular lysates at known [Ca2+] [32]; ii) in cells expressing nuclear or cytosolic aequorin permeabilized to Ca2+with digitonin; these aequorins are not
washed out under these conditions, and the cells can beare perfused with solutions containing known [Ca2+] concentrations; or iii) in situ by measurements in living cells whose [Ca2+], [Mg2+], [Na+], [K+] and [H+] are have been carefully clamped using the adequate ionophores [40]. In the experiment of Fig. 1A the estimated[Ca2+]ER at the steady state was about 600 µM. It should be noted that the accuracy of Ca2+ calibrations is limited as they restit relies uponin many
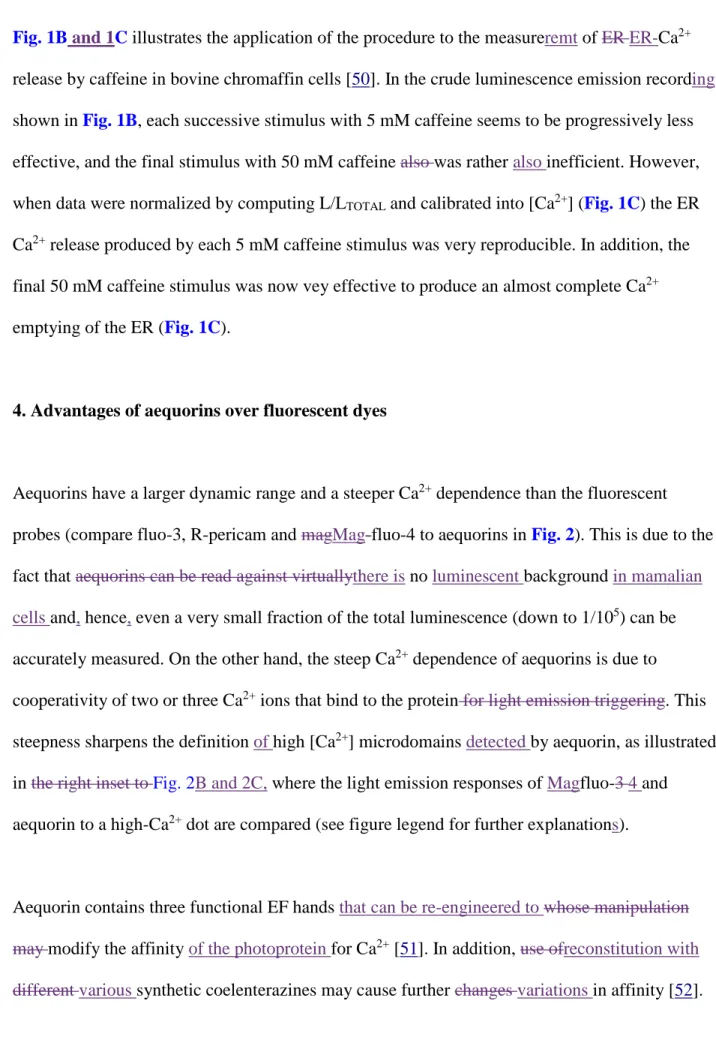
Fig. 1B and 1C illustrates the application of the procedure to the measureremt of ER ER-Ca2+ release by caffeine in bovine chromaffin cells [50]. In the crude luminescence emission recording
shown in Fig. 1B, each successive stimulus with 5 mM caffeine seems to be progressively less effective, and the final stimulus with 50 mM caffeine also was rather also inefficient. However, when data were normalized by computing L/LTOTAL and calibrated into [Ca2+] (Fig. 1C) the ER Ca2+ release produced by each 5 mM caffeine stimulus was very reproducible. In addition, the final 50 mM caffeine stimulus was now vey effective to produce an almost complete Ca2+ emptying of the ER (Fig. 1C).
4. Advantages of aequorins over fluorescent dyes
Aequorins have a larger dynamic range and a steeper Ca2+ dependence than the fluorescent probes (compare fluo-3, R-pericam and magMag-fluo-4 to aequorins in Fig. 2). This is due to the fact that aequorins can be read against virtuallythere is no luminescent background in mamalian cells and, hence, even a very small fraction of the total luminescence (down to 1/105) can be accurately measured. On the other hand, the steep Ca2+ dependence of aequorins is due to cooperativity of two or three Ca2+ ions that bind to the protein for light emission triggering. This steepness sharpens the definition of high [Ca2+] microdomains detected by aequorin, as illustrated in the right inset to Fig. 2B and 2C, where the light emission responses of Magfluo-3 4 and aequorin to a high-Ca2+ dot are compared (see figure legend for further explanations).
By combination of wild type or mutated (D119A) aequorin with either native coelenterazine or coelenterazine n measurements [Ca2+] can be performed measured in a very wide range,from 10 -8 to 10-3 M, using just three aequorin/coelenterazine combinations (systems 1, 2 and 3 in Fig. 2)
[12]. Fusion of aequorin to GFP enables comfortable monitoring of probe localization in live living cells and improves protein stability and luminescence yield [53] with minor changes of affinity (system 4; Fig. 2; system 4).
Mismatch between of the probe affinity and the [Ca2+ ]concentration in the target domain to be monitored can induce serious errors in the measurements and bias the interpretation of the resultsphysiological. Fig. 3A illustrates light emission by in HeLa cells expressing active a mutated GFP-aequorin targeted to the ER (ermutGA)(with some more affinity for Ca2+ than ermutAEQ, see curve 4 in Fig. 2 Javier, esta info aqui despista) during a long-term (40 min)
measurements. Cells were perfused at t=0 with medium containing 1 mM Ca2+in order to allow ER refilling. The time courses of light emission in linear (dotted blue trace) and semilogarithmic plots (continuous black trace) are compared in Fig. 3A. The luminescence emission reached a
maximum was reached in less than 2 min, and the luminescencethen decreased very rapidly with a t1/2 of 1.2 min., so that luminescenceup to a dropped to 10 % of the original value in 4 min, . and sSuch a rapid decay in the signal often limited limits the design of many experimental protocols experimentsthat would require longer time of recording. The time courses of light emission in linear (dotted blue trace) and semilogarithmic plots (continuous black trace) are
compared in Fig. 3A. In the semilogarithmic trace, the fitted slope (dotted red trace) corresponds to the first order rate constant for emission decay, and; it seems clear that it decreases
decay corresponds to a pool of aequorin amounting containing less than 2 % of the original counts, probably stored expressed in damaged or, atypical cisternae or vesicles containing a much smaller Ca2+ concentration (schematized in the inset to of Fig. 3A), and this could lead to
misinterpretation of the results of the experiment.
In order to conduct longer experiments and to accomplish a more accurated and straightforward calibration, new extra-low affinity aequorins have been constructed for use in high [Ca2+] environments. Lower affinity was engineered achieved by three amino acid substitutions,
(D119A, D117A and D163A, ) in the AEQ moiety of GAP, resulting into GAP1. This probe was conveniently tagged for expression into the ER of mammalian cells. The distribution of the GFP fluorescence was consistent with expression in ER and functional tests confirmed proper
performance of the probe in this organelle. Combining this new GAP1 chimera with
coelenterazine n enabled reliable measurements in the 100-2000 µM range, very adequate for the expected luminal steady-state levels (calibration curve 5 in Fig. 2). The t1/2 for aequorin
consumption rate during ER refilling was increased 10 fold with regard to that of GA (red trace in
Fig. 3B;compare to dotted blue trace). In addition, now normalization as L/LTOTAL was possible
and allowed reliable estimates of [Ca2+]ER for morein protocols loner than 30 minutes (green trace
in Fig. 3B) [32].
5. Aequorin luminescence imaging
focused on methodological aspects of luminescence imaging [54]. Low noise, high dynamic range and 16-bit readout are, in our hands, essential requirements for quantitative measurements. The use of high sensitivity photon-counting cameras allowed us to successfully image subcellular Ca2+ dynamics [18, 55]. The newer electron-multiplying CCD cameras are also able to detect luminescence emission. Calibration As described above, calibration of the photoluminescent signal into [Ca2+] requires computation of the fraction of the total luminescence that is emitted at each time-point (see above). For this reason, every each experiment must be finished ended by cell lysis in the presence of excess Ca2+ to release the residual luminescence. In our experience, the total counts are difficult to read without camera saturation with less than 16-bit readout.
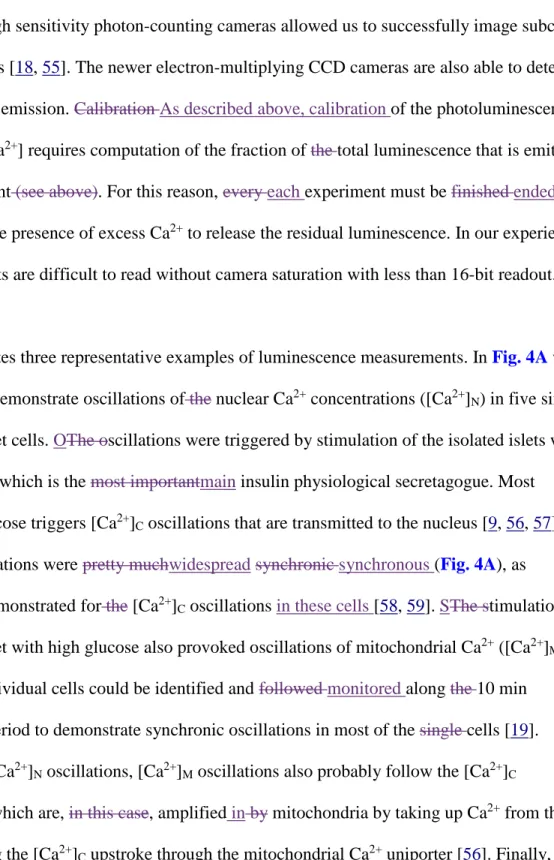
Fig. 4 illustrates three representative examples of luminescence measurements. In Fig. 4A we
were able to demonstrate oscillations of the nuclear Ca2+ concentrations ([Ca2+]N) in five single pancreatic islet cells. OThe oscillations were triggered by stimulation of the isolated islets with high glucose, which is the most importantmain insulin physiological secretagogue. Most
probably, glucose triggers [Ca2+]C oscillations that are transmitted to the nucleus [9, 56, 57]. The [Ca2+]N oscillations were pretty muchwidespreadsynchronic synchronous (Fig. 4A), as
previously demonstrated for the [Ca2+]C oscillations in these cells [58, 59]. SThe stimulation of pancreatic islet with high glucose also provoked oscillations of mitochondrial Ca2+ ([Ca2+]M)(Fig. 4B). Nine individual cells could be identified and followed monitored along the 10 min
single cell during one [Ca2+]M peak is illustrated in the frames on top of the panel. These cells are known to exhibit spontaneous electric activity, which, in term, drives [Ca2+]C oscillations by Ca2+ entry during the action potentials, and the increased [Ca2+]C promotes mitochondrial uptake [60]. Stimulation with tyrotrophin-releasing hormone (TRH) stimulates increased both the electric
activity and the [Ca2+]M activity [18].
6. Fluorescent aequorins
The family of GFP-aequorin chimeras named GAP for “GFP-Aequorin Protein”, does also exhibit Ca2+-dependent green fluorescence. Although the mechanism is not fully understood yet, it seems unrelated to luminescence, as coelenterazine is not required [40]. The bBinding of Ca2+
brings aboutyields a leftward shift of the GAP excitation spectrum towards shorter wavelengths,
and which that allows enables ratiometric measurements. GAPs have been successfully targeted to cytosol, nucleus, mitochondria, ER and Golgi apparatus [40]. The affinity for Ca2+ can also be engineered to match the expected [Ca2+] concentrationsof in the target locations to be measured, and GAP variants of the fusion protein withvariousCa2+affinities for Ca2+ofhave been
constructed (0.2 µM (for GAP), 17 17 µM for (GAP1) and 450 µM (for GAP3) have been constructed [40, 61]. In contrast to other Ca2+ sensors based on fusions with calmodulin or
troponin, the two component of GAPs, GFP and aequorin, are jellyfish proteins and do not have mammalian homologues. Therefore, the probeGAP sensorsshould beis expected to be orthogonal and not interfere with endogenous proteins such as calmodulin or troponin. Transgenic animals expressing GAPs in the ER (mice) or SR (flies) have been generated and no phenotypic
Transgenic animals for genetically encoded Ca2+ indicatorsGECIs are well suited for ex vivo and in vivo measurements of Ca2+ dynamics. Fig. 5 illustrates measurements hippocampal neurons in acute hippocampal slices from a transgenic mouse mice expressing ER-targeted GAP3 (erGAP3)
in neurons [61]. CThe cytosolic Ca2+ was measured simultaneously using rhod-3. Challenge with the neurotransmitter acetylcholine [44], decreased [Ca2+]ER with simultaneous increase of
[Ca2+]C, unequivocally demonstrating neurotransmitter-induced Ca2+ release selectively located at the cornus ammonis 1 (CA1) region, where the expression of the muscarinic acetylcholine
receptors had been previously reported [62, 63]. Therefore, the use of this new tool enables functional mapping of neurotransmitters (or other agonists) acting by releasing calcium from the
intracellular storesER, and this can be only indirectly assessed by measurements of [Ca2+]C.
Fig. 6 shows in vivo measurements in transgenic flies expressing erGAP3 in the sarcoplasmic
reticulum of skeletal muscles, . The indicator and GAP3 fluorescence can be easily readly
in [Ca2+]ER levels and their functional consequences are presently currently being studied with
this indicator in several physiological and pathological conditions.
Author contributions
Data were collected by M.R.P., P.N-N. and J.R.R. Manuscript was written by J.G.S. and M.T.A. All authors have read and approved the published manuscript.
Conflict of interest
The authors have no conflict of interest concerning this manuscript.
Acknowledgements
We thank Miriam D. García Cubillas and Jesús Fernández by excellent technical assistance. This work was supported by grants from the Spanish Ministerio de Economía y Competitividad (BFU2014-53469P) and the Instituto de Salud Carlos III (TerCel,
REFERENCES
[1] O. Shimomura, Discovery of green fluorescent protein (GFP) (Nobel Lecture), Angew Chem Int Ed Engl, 48 (2009) 5590-5602.
[2] R. Rizzuto, A.W. Simpson, M. Brini, T. Pozzan, Rapid changes of mitochondrial Ca2+ revealed by specifically targeted recombinant aequorin, Nature, 358 (1992) 325-327.
[3] M.N. Badminton, J.M. Kendall, G. Sala-Newby, A.K. Campbell, Nucleoplasmin-targeted aequorin provides evidence for a nuclear calcium barrier, Exp Cell Res, 216 (1995) 236-243.
[4] M.N. Badminton, G.B. Sala-Newby, J.M. Kendall, A.K. Campbell, Differences in stability of recombinant apoaequorin within subcellular compartments, Biochem Biophys Res Commun, 217 (1995) 950-957.
[5] M. Brini, M. Murgia, L. Pasti, D. Picard, T. Pozzan, R. Rizzuto, Nuclear Ca2+ concentration measured with specifically targeted recombinant aequorin, EMBO J, 12 (1993) 4813-4819.
[6] M. Brini, R. Marsault, C. Bastianutto, T. Pozzan, R. Rizzuto, Nuclear targeting of aequorin. A new approach for measuring nuclear Ca2+ concentration in intact cells, Cell Calcium, 16 (1994) 259-268.
[7] P. Chamero, I.M. Manjarres, J.M. Garcia-Verdugo, C. Villalobos, M.T. Alonso, J. Garcia-Sancho, Nuclear calcium signaling by inositol trisphosphate in GH3 pituitary cells, Cell Calcium, 43 (2008) 205-214.
[8] P. Chamero, C. Villalobos, M.T. Alonso, J. Garcia-Sancho, Dampening of cytosolic Ca2+ oscillations on propagation to nucleus, J Biol Chem, 277 (2002) 50226-50229.
[9] M.T. Alonso, J. Garcia-Sancho, Nuclear Ca(2+) signalling, Cell Calcium, 49 (2011) 280-289.
[10] L. Filippin, M.C. Abad, S. Gastaldello, P.J. Magalhaes, D. Sandona, T. Pozzan, Improved strategies for the delivery of GFP-based Ca2+ sensors into the mitochondrial matrix, Cell Calcium, 37 (2005) 129-136.
[11] J.M. Kendall, R.L. Dormer, A.K. Campbell, Targeting aequorin to the endoplasmic reticulum of living cells, Biochem Biophys Res Commun, 189 (1992) 1008-1016.
[12] M. Montero, M.T. Alonso, E. Carnicero, I. Cuchillo-Ibanez, A. Albillos, A.G. Garcia, J. Garcia-Sancho, J. Alvarez, Chromaffin-cell stimulation triggers fast millimolar mitochondrial Ca2+ transients that modulate secretion, Nat Cell Biol, 2 (2000) 57-61.
[13] S. de la Fuente, R.I. Fonteriz, P.J. de la Cruz, M. Montero, J. Alvarez, Mitochondrial free [Ca(2+)] dynamics measured with a novel low-Ca(2+) affinity aequorin probe, Biochem J, 445 (2012) 371-376.
[14] R.I. Fonteriz, S. de la Fuente, A. Moreno, C.D. Lobaton, M. Montero, J. Alvarez, Monitoring mitochondrial [Ca(2+)] dynamics with rhod-2, ratiometric pericam and aequorin, Cell Calcium, 48 (2010) 61-69.
[15] R. Rizzuto, P. Pinton, W. Carrington, F.S. Fay, K.E. Fogarty, L.M. Lifshitz, R.A. Tuft, T. Pozzan, Close contacts with the endoplasmic reticulum as determinants of mitochondrial Ca2+ responses, Science, 280 (1998) 1763-1766.
[17] C. Villalobos, M.T. Alonso, J. Garcia-Sancho, Bioluminescence imaging of calcium oscillations inside intracellular organelles, Methods Mol Biol, 574 (2009) 203-214.
[18] C. Villalobos, L. Nunez, P. Chamero, M.T. Alonso, J. Garcia-Sancho, Mitochondrial [Ca(2+)] oscillations driven by local high [Ca(2+)] domains generated by spontaneous electric activity, J Biol Chem, 276 (2001) 40293-40297.
[19] I. Quesada, C. Villalobos, L. Nunez, P. Chamero, M.T. Alonso, A. Nadal, J. Garcia-Sancho, Glucose induces synchronous mitochondrial calcium oscillations in intact pancreatic islets, Cell Calcium, 43 (2008) 39-47.
[20] K.L. Rogers, S. Picaud, E. Roncali, R. Boisgard, C. Colasante, J. Stinnakre, B. Tavitian, P. Brulet, Non-invasive in vivo imaging of calcium signaling in mice, PLoS ONE, 2 (2007) e974.
[21] R. Marsault, M. Murgia, T. Pozzan, R. Rizzuto, Domains of high Ca2+ beneath the plasma membrane of living A7r5 cells, EMBO J, 16 (1997) 1575-1581.
[22] C. Daguzan, M.T. Nicolas, C. Mazars, C. Leclerc, M. Moreau, Expression of membrane targeted aequorin in Xenopus laevis oocytes, Int J Dev Biol, 39 (1995) 653-657.
[23] I. Pulli, T. Blom, C. Lof, M. Magnusson, A. Rimessi, P. Pinton, K. Tornquist, A novel chimeric aequorin fused with caveolin-1 reveals a sphingosine kinase 1-regulated Ca(2)(+) microdomain in the caveolar compartment, Biochim Biophys Acta, 1853 (2015) 2173-2182.
[24] S. Munro, H.R. Pelham, A C-terminal signal prevents secretion of luminal ER proteins, Cell, 48 (1987) 899-907.
[25] M. Nomura, S. Inouye, Y. Ohmiya, F.I. Tsuji, A C-terminal proline is required for bioluminescence of the Ca(2+)-binding photoprotein, aequorin, FEBS Lett, 295 (1991) 63-66.
[26] J.M. Kendall, G. Sala-Newby, V. Ghalaut, R.L. Dormer, A.K. Campbell, Engineering the CA(2+)-activated photoprotein aequorin with reduced affinity for calcium, Biochem Biophys Res Commun, 187 (1992) 1091-1097.
[27] M. Montero, M. Brini, R. Marsault, J. Alvarez, R. Sitia, T. Pozzan, R. Rizzuto, Monitoring dynamic changes in free Ca2+ concentration in the endoplasmic reticulum of intact cells, EMBO J, 14 (1995) 5467-5475.
[28] D. Button, A. Eidsath, Aequorin targeted to the endoplasmic reticulum reveals heterogeneity in luminal Ca++ concentration and reports agonist- or IP3-induced release of Ca++, Mol Biol Cell, 7 (1996) 419-434. [29] M.J. Barrero, M. Montero, J. Alvarez, Dynamics of [Ca2+] in the endoplasmic reticulum and cytoplasm of intact HeLa cells. A comparative study, J Biol Chem, 272 (1997) 27694-27699.
[30] J. Alvarez, M. Montero, Measuring [Ca2+] in the endoplasmic reticulum with aequorin, Cell Calcium, 32 (2002) 251-260.
[31] S. de la Fuente, R.I. Fonteriz, M. Montero, J. Alvarez, Ca2+ homeostasis in the endoplasmic reticulum measured with a new low-Ca2+-affinity targeted aequorin, Cell Calcium, 54 (2013) 37-45.
[33] V.A. Barr, K.M. Bernot, S. Srikanth, Y. Gwack, L. Balagopalan, C.K. Regan, D.J. Helman, C.L. Sommers, M. Oh-Hora, A. Rao, L.E. Samelson, Dynamic movement of the calcium sensor STIM1 and the calcium channel Orai1 in activated T-cells: puncta and distal caps, Mol Biol Cell, 19 (2008) 2802-2817.
[34] M. Brini, F. De Giorgi, M. Murgia, R. Marsault, M.L. Massimino, M. Cantini, R. Rizzuto, T. Pozzan, Subcellular analysis of Ca2+ homeostasis in primary cultures of skeletal muscle myotubes, Mol Biol Cell, 8 (1997) 129-143.
[35] P. Pinton, T. Pozzan, R. Rizzuto, The Golgi apparatus is an inositol 1,4,5-trisphosphate-sensitive Ca2+ store, with functional properties distinct from those of the endoplasmic reticulum, EMBO J, 17 (1998) 5298-5308.
[36] K. Van Baelen, J. Vanoevelen, G. Callewaert, J.B. Parys, H. De Smedt, L. Raeymaekers, R. Rizzuto, L. Missiaen, F. Wuytack, The contribution of the SPCA1 Ca2+ pump to the Ca2+ accumulation in the Golgi apparatus of HeLa cells assessed via RNA-mediated interference, Biochem Biophys Res Commun, 306 (2003) 430-436.
[37] J. Vanoevelen, L. Raeymaekers, J.B. Parys, H. De Smedt, K. Van Baelen, G. Callewaert, F. Wuytack, L. Missiaen, Inositol trisphosphate producing agonists do not mobilize the thapsigargin-insensitive part of the endoplasmic-reticulum and Golgi Ca2+ store, Cell Calcium, 35 (2004) 115-121.
[38] V. Lissandron, P. Podini, P. Pizzo, T. Pozzan, Unique characteristics of Ca2+ homeostasis of the trans-Golgi compartment, Proc Natl Acad Sci U S A, 107 (2010) 9198-9203.
[39] F.J. Aulestia, M.T. Alonso, J. Garcia-Sancho, Differential calcium handling by the cis and trans regions of the Golgi apparatus, Biochem J, 466 (2015) 455-465.
[40] A. Rodriguez-Garcia, J. Rojo-Ruiz, P. Navas-Navarro, F.J. Aulestia, S. Gallego-Sandin, J. Garcia-Sancho, M.T. Alonso, GAP, an aequorin-based fluorescent indicator for imaging Ca2+ in organelles, Proc Natl Acad Sci U S A, 111 (2014) 2584-2589.
[41] K.J. Mitchell, P. Pinton, A. Varadi, C. Tacchetti, E.K. Ainscow, T. Pozzan, R. Rizzuto, G.A. Rutter, Dense core secretory vesicles revealed as a dynamic Ca(2+) store in neuroendocrine cells with a vesicle-associated membrane protein aequorin chimaera, J Cell Biol, 155 (2001) 41-51.
[42] K.J. Mitchell, F.A. Lai, G.A. Rutter, Ryanodine receptor type I and nicotinic acid adenine dinucleotide phosphate receptors mediate Ca2+ release from insulin-containing vesicles in living pancreatic beta-cells (MIN6), J Biol Chem, 278 (2003) 11057-11064.
[43] A. Moreno, C.D. Lobaton, J. Santodomingo, L. Vay, E. Hernandez-SanMiguel, R. Rizzuto, M. Montero, J. Alvarez, Calcium dynamics in catecholamine-containing secretory vesicles, Cell Calcium, 37 (2005) 555-564. [44] J. Santodomingo, L. Vay, M. Camacho, E. Hernandez-Sanmiguel, R.I. Fonteriz, C.D. Lobaton, M. Montero, A. Moreno, J. Alvarez, Calcium dynamics in bovine adrenal medulla chromaffin cell secretory granules, Eur J Neurosci, 28 (2008) 1265-1274.
[45] N.R. Mahapatra, M. Mahata, P.P. Hazra, P.M. McDonough, D.T. O'Connor, S.K. Mahata, A dynamic pool of calcium in catecholamine storage vesicles. Exploration in living cells by a novel vesicle-targeted
chromogranin A-aequorin chimeric photoprotein, J Biol Chem, 279 (2004) 51107-51121.
reticulum and acidic organelles: implications for NAADP-dependent Ca(2)(+) signalling, Cell Calcium, 57 (2015) 89-100.
[47] F.M. Lasorsa, P. Pinton, L. Palmieri, P. Scarcia, H. Rottensteiner, R. Rizzuto, F. Palmieri, Peroxisomes as novel players in cell calcium homeostasis, J Biol Chem, 283 (2008) 15300-15308.
[48] P.E. Martin, C.H. George, C. Castro, J.M. Kendall, J. Capel, A.K. Campbell, A. Revilla, L.C. Barrio, W.H. Evans, Assembly of chimeric connexin-aequorin proteins into functional gap junction channels. Reporting intracellular and plasma membrane calcium environments, J Biol Chem, 273 (1998) 1719-1726.
[49] C.H. George, J.M. Kendall, A.K. Campbell, W.H. Evans, Connexin-aequorin chimerae report cytoplasmic calcium environments along trafficking pathways leading to gap junction biogenesis in living COS-7 cells, J Biol Chem, 273 (1998) 29822-29829.
[50] M.T. Alonso, M.J. Barrero, P. Michelena, E. Carnicero, I. Cuchillo, A.G. Garcia, J. Garcia-Sancho, M. Montero, J. Alvarez, Ca2+-induced Ca2+ release in chromaffin cells seen from inside the ER with targeted aequorin, J Cell Biol, 144 (1999) 241-254.
[51] J.F. Head, S. Inouye, K. Teranishi, O. Shimomura, The crystal structure of the photoprotein aequorin at 2.3 A resolution, Nature, 405 (2000) 372-376.
[52] O. Shimomura, B. Musicki, Y. Kishi, S. Inouye, Light-emitting properties of recombinant semi-synthetic aequorins and recombinant fluorescein-conjugated aequorin for measuring cellular calcium, Cell Calcium, 14 (1993) 373-378.
[53] V. Baubet, H. Le Mouellic, A.K. Campbell, E. Lucas-Meunier, P. Fossier, P. Brulet, Chimeric green
fluorescent protein-aequorin as bioluminescent Ca2+ reporters at the single-cell level, Proc Natl Acad Sci U S A, 97 (2000) 7260-7265.
[54] S.E. Webb, K.L. Rogers, E. Karplus, A.L. Miller, The use of aequorins to record and visualize Ca(2+) dynamics: from subcellular microdomains to whole organisms, Methods Cell Biol, 99 (2010) 263-300. [55] L. Nunez, L. Senovilla, S. Sanz-Blasco, P. Chamero, M.T. Alonso, C. Villalobos, J. Garcia-Sancho, Bioluminescence imaging of mitochondrial Ca2+ dynamics in soma and neurites of individual adult mouse sympathetic neurons, J Physiol, 580 (2007) 385-395.
[56] M.T. Alonso, C. Villalobos, P. Chamero, J. Alvarez, J. Garcia-Sancho, Calcium microdomains in mitochondria and nucleus, Cell Calcium, 40 (2006) 513-525.
[57] C. Villalobos, A. Nadal, L. Nunez, I. Quesada, P. Chamero, M.T. Alonso, J. Garcia-Sancho,
Bioluminescence imaging of nuclear calcium oscillations in intact pancreatic islets of Langerhans from the mouse, Cell Calcium, 38 (2005) 131-139.
[58] R.M. Santos, L.M. Rosario, A. Nadal, J. Garcia-Sancho, B. Soria, M. Valdeolmillos, Widespread
synchronous [Ca2+]i oscillations due to bursting electrical activity in single pancreatic islets, Pflugers Arch, 418 (1991) 417-422.
16 (2002) 343-353.
[61] P. Navas-Navarro, J. Rojo-Ruiz, M. Rodriguez-Prados, M.D. Ganfornina, L.L. Looger, M.T. Alonso, J. Garcia-Sancho, GFP-Aequorin Protein Sensor for Ex Vivo and In Vivo Imaging of Ca(2+) Dynamics in High-Ca(2+) Organelles, Cell Chem Biol, 23 (2016) 738-745.
[62] D. Fernandez de Sevilla, A. Nunez, M. Borde, R. Malinow, W. Buno, Cholinergic-mediated IP3-receptor activation induces long-lasting synaptic enhancement in CA1 pyramidal neurons, J Neurosci, 28 (2008) 1469-1478.
[63] J.M. Power, P. Sah, Nuclear calcium signaling evoked by cholinergic stimulation in hippocampal CA1 pyramidal neurons, J Neurosci, 22 (2002) 3454-3462.
[64] M.J. Allen, T.A. Godenschwege, Electrophysiological recordings from the Drosophila giant fiber system (GFS), Cold Spring Harb Protoc, 2010 (2010) pdb prot5453.
[65] D.G. Allen, J.R. Blinks, F.G. Prendergast, Aequorin luminescence: relation of light emission to calcium concentration--a calcium-independent component, Science, 195 (1977) 996-998.
[66] I.M. Manjarres, P. Chamero, B. Domingo, F. Molina, J. Llopis, M.T. Alonso, J. Garcia-Sancho, Red and green aequorins for simultaneous monitoring of Ca2+ signals from two different organelles, Pflugers Arch, 455 (2008) 961-970.
FIGURE CAPTIONS
Fig. 1. Analysis of a representative experiments measuring Ca2+ dynamics in the ER. A. HeLa cells expressing low Ca2+ affinity GFP-D119AAEQ [65] and reconstituted with coelenterazine n were perfused with Ca2+-free medium. At the moment shown by the arrow perfusion was
switched to saline containing 1 mM CaCl2 to allow refilling of the intracellular Ca2+ storesER. At
the end of the recording cells were perfused with 10 mM CaCl2 and 100 µM digitonin in order to permeabilize the cells and burn the residual aequorin (not shown). Temperature was 22 ºC. Dotted line, crude photoluminescence emission expressed as counts per second (cps) (scale at left); continuous trace, same data normalized as L/LTOTAL·S-1 (scale at right); further details on how to compute these values are explained in the main text. B and C. Responses of adrenal chromaffin cells expressing ER-targeted mutated aequorin reconstituted with coelenterazine n to challenges with caffeine; 4 consecutive 5 mM stimuli followed by a 50 mM stimulus are shown. The crude luminescence record is shown in Bwhereas and the calibrated [Ca2+]ER is shown in C. Panels B and C were reproduced with permission from Alvarez & Montero [30].
Fig. 2. Comparison of the calibration curves of various aequorin systems and three florescent indicators (fluo-3, R-pericam and magfluo-4). A.Aequorin systems shown are: (1) wild-type aequorin with native coelenterazine, (2) wild-type aequorin with coelenterazine n, (3) low Ca2+ affinity D119A mutated aequorin and coelentarazine n. System 4 corresponds to the fusion GFP-D119AAEQ (also named mutGA) reconstituted with coelenterazine n, and system 5 to the low Ca2+
is modelled at right. Dissipation of the hot spot from the centre was assumed to follow the function: Sx = S0·exp(−k·x), where S0 is the maximum Ca2+ concentration at the hot spot, k the space constant and x is the distance. The fluorescnce and photoluminescence profiles have been modelled according to the calibration curves shown assuming maximum brightness at the centre of the dot (further details in [56]).
Fig. 3. Adequation Matching of aequorin consumption kinetics to organellar Ca2+ level and duration of the experiment. A. Measurements of [Ca2+]ER evolution with low Ca2+ affinity GFP-D119AAEQ [65]. Experimental details as in Fig.1A. Ca2+ (1 mM or 10 mM) added as shown.
Dotted blue line, raw luminescence in cps (linear scale, left). Black continuous line,
semilogharithmic representation of the same data (log scale, right). Estimation of the fist order rate constants for consumption at each phase is shownin red. Values for t1/2 are in minutes. The inset shows the simplest explicative model of the output: two pools with different Ca2+ contents giving different and aequorin consumption rates. B. Comparison of luminescence emission kinetics of GAP (dotted blue line) and GAP1 (red continuous line). The t1/2 values (in minutes) are shown at right. The green trace shows the L/LTOTAL values (s-1, scale at right). For further explanations, see the main text.
mitochondrial Ca2+oscillations in 9 single pancreatic β cells within a Langerhans islet expressing mitochondria-targeted aequorin. The upper panels show, from left to right, brightfield, and pseudocolor-coded cumulative aequorin bioluminescence images (integration of the
luminescence emission during the whole experiment; scale at right). The size of each image box is 200x200 µm. Reproduced with permission from [19]. C. The trace represents spontaneous oscillations of mitochondrial Ca2+ in a single anterior pituitary cell expressing mitochondria-targeted aequorin. The images corresponding to one single oscillation are shown on top. Photonic emissions, coded in pseudocolor, have been superimposed to the brightfield image. Time
sequence goes from left to right and from top to bottom. Interval between images was 10 s. The size of each image box is 10x10 µm. Reproduced with permission from [17].
Fig. 5. Functional mapping of acetylcholine responses in hippocampal slices ex vivo.Frame sequence during stimulation with acetylcholine (ACh; 200 µM, 30 s) in acute hippocampal slices from erGAP3 transgenic mice (line 10; P7). Cornus ammonis regions (CA) and the upper blade of dentate gyrus [67] are visible. Measurements of ER- (erGAP3) and cytosolic- (rhod-3) Ca2+ were performed simultaneously. Frames were acquired every 10 s. Upper row: ER Ca2+ release, evidenced by the decrease of the GAP signal selectively in CA1, during ACh stimulation. Calibration bar, 200 µm. Lower row, coordinated increase of Rhod-3 fluorescence, indicating increase of [Ca2+]C by release from the ER. Reproduced with permission from [61]
Fig. 6 In vivomonitoring of [Ca2+]SR dynamics with erGAP3 during muscle contraction in the living fly. (A and B). Specific expression of erGAP3 (green fluorescence) in the thoracic muscles of Mhc-erGAP3 fly. Lateral views of brightfield and fluorescence were superimposed
were stimulated via the giant fibre at various frequencies with 5-10 V / 30-50 ms stimuli.
Calibrations bars in both images are 500 µm. (C). Individual SR Ca2+ release events seen during stimulation at low frequency (0.5 Hz). Reciprocal responses of the GAP3 fluorescence excited at
0 1 2 3 4 0.000 0.001 0.002 0.003 0.004 0.005 0.006 0 200 400 600 800 1000 1200 1400 1600
Luminescence (cps)
L/L
TO T A L(s
-1)
Minutes
A
Ca1
[Ca
2+]
ER(
μ
M)
Luminescence (cps)
C
B
Ca 1mM
EGTA Caf 5 mM Caf 5 mM Caf5 mM Caf
5 mM Caf
50 mM
digitonin Ca 10mM2+
5 min
4000 3000 2000 1000 0 600 400 200 01 0
-81 0
-71 0
-61 0
-51 0
-41 0
-31 0
-21 0
-61 0
-51 0
-41 0
-31 0
-21 0
-11 0
0L/
L
TOTAL(s
-1
)
[C a
2+] (M)
1
2
3
4
5
Fl
uo
-3
M
agf
lu
o-4
R-
P
er
ic
am
A
equorin
-4
Aequorin
Aequorin
Magfluo-4
A
B
t
1/2= 1 .2
G A
G A P 1, cps
0 .0 0 0 0
0 .0 0 0 5
0 .0 0 1 0
0 .0 0 1 5
L/
L
TOTALGAP1, L /L
TOTALTime in minutes
1 0 0
8 0
6 0
2 0
4 0
0
cps (% of m
a
x
im
u
m)
t
1/2= 1 2 min.
t
1/2= 1.2 min
0
5
10
15
20
25
30
35
40
Ca1
Ca10 + Dig.
Ca1
t
1/2= 5.0
cps (l
M ] 2+a C 4 μ M [ 5 min High glucose 2 min
L/L
TO TA L ( s -1 ) 0.000 0.001 0.002 0.003 0.004[Ca2+] M(μM)
0.46 0.63 0.88 1.22
C
B
A
High glucose High glucoseF / F
0R / R
01.4
0.8 1.0
0.4
(Rhod-3)
1
2
3
4
5
6
(erGAP3)
F / F
0
(
F
470or
F
405)
0.90 0.95 1.00
0.25 Hz
4 Hz
16 Hz
0.98 0.99 1.00 1.01 1.02
0.5 Hz
5 s
10 s
A
B
C
D
F / F
0