Defi ning mental health positively implies conceiving mental health not only as the absence of mental disability or illness but also as the presence of different psychosocial resources that contribute to the realization of the full individual potential. This positive approach to mental health is receiving increasing attention in psychological research and practice, as well as in other disciplines such as economics, health, and policy-making (De Vos, 2012; Diener, Emmons, Larsen, & Griffi n, 1985; Martínez Aldunate, Ivanovic-Zuvic Ramírez, & Unanue Manríquez, 2013; Nitsche, Bitran, Pedrals, Echeverría, & Rigotti, 2014; Thin, 2012).
In 2002, Corey Keyes formulated and operationalized a model of mental health continuum (Keyes, 2002). Unlike other models that focus on a particular area of well-being Keyes’s model includes three dimensions of mental health: emotional
(EWB), psychological (PWB) and social (SWB). EWB captures the presence of positive affect and satisfaction with life (Diener et al., 1985; Diener & Seligman, 2002; Lyubomirsky, King, & Diener, 2005). PWB focuses on the individual’s intrapersonal and interpersonal functioning (Keyes, Shmotkin, & Ryff, 2002; Ryff, 2014). SWB refl ects how well an individual functions in society. This model served as the theoretical foundation for the development of the Mental Health Continuum Scale (MHC-LF: Keyes, 2002, 2005, 2007), a 40-item self-administered questionnaire.
Subsequently, a shorter 14-item version of this scale was developed (Keyes, 2009). Unlike the original scale, MHC-SF has become popular in well-being research and assessment (Hone, Jarden, Schofi eld, & Duncan, 2014), presumably because of its brevity, in addition to its theoretical basis and comprehensive nature (Ro & Clark, 2009).
MHC-SF has been translated into different languages and validated across diverse cultural contexts (Joshanloo, Wissing, Khumalo, & Lamers, 2013; Jovanović, 2015; Karaś, Cieciuch, & Keyes, 2014; Lamers, Westerhof, Bohlmeijer, ten Klooster, & Keyes, 2011; Machado & Bandeira, 2015; Petrillo, Capone, Caso, & Keyes, 2014). While most studies confi rmed the originally proposed
ISSN 0214 - 9915 CODEN PSOTEG Copyright © 2017 Psicothema www.psicothema.com
Validation of a Spanish Version of the Mental Health Continuum-Short
Form Questionnaire
Guadalupe Echeverría, Manuel Torres, Nuria Pedrals, Oslando Padilla, Attilio Rigotti and Marcela Bitran
Pontifi cia Universidad Católica de Chile
Abstract
Resumen
Background: The Mental Health Continuum-Short Form (MHC-SF) is a multidimensional measure of well-being designed to assess emotional, psychological and social well-being. It has been translated into different languages; however, there is no validated Spanish version. Our aim was to provide the Spanish-speaking community with a validated version of the MHC-SF. Method: We translated the questionnaire into Spanish (s-MHC-SF) and assessed its validity in a sample of 3,355 Chilean adults. The data was subjected to a confi rmatory factor analysis using the original correlated-traits three-factor model and a recently described bifactor model. Results: The scores obtained with s-MHC-SF had excellent reliability (α = .94). While the correlated-traits three-factor model provided an acceptable fi t to the data, the bifactor model yielded a superior
fi t. According to measurement invariance results, both models could be used to compare scores over gender, geographical region, age, and time in the sample. Conclusion: s-MHC-SF is a valid questionnaire for the evaluation of personal well-being in Spanish-speaking populations.
Keywords: Factor analysis, statistical, mental health, well-being, surveys and questionnaires, Spanish
Validación de la versión en español del Cuestionario del Continuo de Salud Mental-Versión Corta. Antecedentes: el Mental Health Continuum-Short Form (MHC-SF) es un instrumento multidimensional diseñado para evaluar los componentes emocional, psicológico y social del bienestar personal. Ha sido traducido a varios idiomas; sin embargo, no hay una versión validada en español. Nuestro objetivo fue proveer a la comunidad hispanoparlante de una versión válida del MHC-SF. Método: MHC-SF se tradujo al español (s-MHC-SF) y se aplicó a una muestra de 3.355 adultos chilenos. Se realizó un análisis factorial confi rmatorio usando el modelo original de tres factores correlacionados y un modelo bifactorial recientemente descrito. Resultados: los puntajes obtenidos con el s-MHC-SF mostraron alta confi abilidad (α = .94). Mientras el modelo correlacionado presentó un ajuste aceptable a los datos, el bifactorial mostró un ajuste superior. Según las pruebas de invarianza de medición, ambos modelos podrían ser utilizados para comparar puntajes según sexo, edad, región geográfi ca y tiempo en la muestra. Conclusión: s-MHC-SF es un cuestionario válido para evaluar el bienestar en la población de habla hispana.
Palabras clave:análisis factorial, estadístico, salud mental, bienestar, encuestas y cuestionarios, español.
Psicothema 2017, Vol. 29, No. 1, 96-102 doi: 10.7334/psicothema2016.3
Received: January 7, 2016 • Accepted: October 25, 2016 Corresponding author: Marcela Bitran
Centro de Educación Médica - Escuela de Medicina Pontifi cia Universidad Católica de Chile 832000 Santiago (Chile)
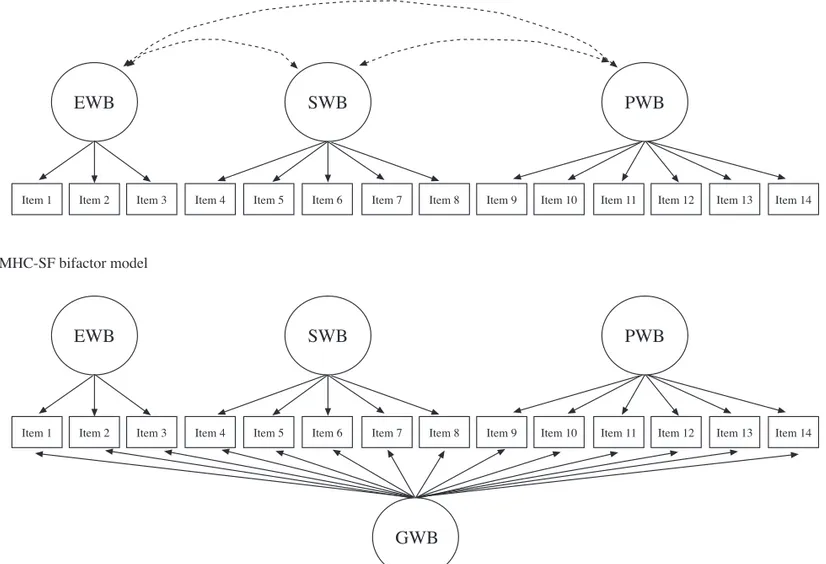
three-factor structure, two recent studies (de Bruin & du Plessis, 2015; Jovanović, 2015) questioned the goodness-of-fi t of this model and reported that a bifactor model best explains MHC-SF’s inner structure in Serbian and South African samples, respectively. A bifactor model consists of one overall factor and many domain-specifi c factors, such that each item loads both on the general factor as well as on one of the domain-specifi c factors (Reise, 2012) (see fi g. 1). From a conceptual point of view, the bifactor model seems a reasonable solution for multidimensional scales like the MHC-SF, aimed at measuring complex constructs with moderately associated components (Chen, West, & Sousa, 2006).
To our knowledge, there are no published Spanish versions of MHC-SF. To provide the Spanish-speaking community with a valid and reliable measure of personal well-being, we assessed the reliability and internal validity of a Spanish translation of the MHC-SF in a sample of Chilean adults.
Method
Participants
The sample of Chilean adults (N = 3,355) that answered the s-MHC-SF from January 2013 to July 2015 was primarily composed
of women (71%) and young adults (mean age = 33.8, SD = 12.2, range = 20 to 83 years old). Most of them (78%) had completed more than 12 years of formal education, and almost two thirds (62%) lived in the Metropolitan Region of Chile, although the sample contained residents from all 15 regions of the country. For independent model goodness-of-fi t evaluation and measurement invariance evaluation, the sample was randomly split into two samples. Sample 1 (n = 1,636), and sample 2 (n = 1,719) were statistically independent with equivalent composition by age (one-way ANOVA, p = .94), gender, geographical region, and response year (χ 2 sample independence
test, p = .47, .77, and .36 respectively).
Instrument
The Mental Health Continuum-Short Form (MHC-SF: Keyes et al., 2008) consists of 14 items that measure emotional (3 items), social (5 items), and psychological well-being (6 items). Participants are asked to rate how often they felt a certain way during the last month, on a 6-point Likert scale.
Procedure
Translation. To ensure a proper translation of the MHC-SF, we adopted the back-translation approach. Two native Spanish
Item 1 Item 2 Item 3 Item 4 Item 5 Item 6 Item 7 Item 8 Item 9 Item 10 Item 11 Item 12 Item 13 Item 14 Item 1 Item 2 Item 3 Item 4 Item 5 Item 6 Item 7 Item 8 Item 9 Item 10 Item 11 Item 12 Item 13 Item 14
EWB
SWB
PWB
EWB
SWB
PWB
MHC-SF correlated traits model
MHC-SF bifactor model
GWB
speakers independently translated the English version of the MHC-SF into Spanish. A consensual version was generated by a third native Spanish speaker. Then, this consensual version was translated back into English by one native English speaker, and compared to detect any semantic differences and determine that there was no signifi cant loss or bias in the translation process. Those invited to assist in the back-translation process jointly agreed upon the translation’s accuracy. The s-MHC-SF has been made available (Echeverría et al., 2016) for public use provided that proper credits are given to the original author of the questionnaire.
Application. The translated instrument was completed by registered users at the online platform of Aliméntate Sano [Eat Healthy] Program of the Centre for Molecular Nutrition and Chronic Diseases from the Pontifi cia Universidad Católica de Chile. Participants voluntarily answered a set of well-being questionnaires, including the MHC-SF, after providing informed consent. The online platform and the study were reviewed and approved by the Ethics Committee of our institution.
Data analysis
There were no missing values due to the application method of the questionnaire.
Four models were specifi ed for the confi rmatory factor analysis (CFA): Three fi rst-order models with one, two and three correlated factors respectively, and a nested-factor or bifactor model with three domain-specifi c factors. In the one-factor model all items load directly on a single general factor. In the two-factor model items 1-3 load on a latent variable corresponding to hedonic well-being and items 4-14 load on a latent variable corresponding to eudaimonic well-being. In the three-factor model, items 1-3 load on the latent variable of emotional well-being (EWB), items 4-8 on social being (SWB), and items 9-14 on psychological well-being (PWB) (Joshanloo et al., 2013; Karaś et al., 2014; Keyes et al., 2008; Lamers et al., 2011; Petrillo et al., 2014). In the bifactor model every item loads onto one of the three domain-specifi c factors (as specifi ed in the fi rst-order three-factor model), and also onto a general well-being (GWB) factor (de Bruin & du Plessis, 2015; Jovanović, 2015).
The correlated-traits three-factor (CTT) and the bifactor (BF) models were compared in detail. The one-factor and two-factor models were modeled for global goodness-of-fi t comparison as in previous validation studies of the MHC-SF and versions.
For all correlation-based analyses, polychoric correlation matrices built from the raw data were used. Parameter estimates in CFA were obtained using the means and variance adjusted weighted least squares estimator, scale-shifted approach (WLSMV). WLSMV was chosen because it has been reported to give optimal results with ordinal, non-normal data (Beauducel & Herzberg, 2006; Flora & Curran, 2004; Lei, 2009; Li, 2014). Polychoric correlation and WLSMV estimator also correct for potential measurement error such as censored variables (Jöreskog, 2002; Kline, 1998/2015; Muthén & Muthén, 2012).
Several fi t indices were used to evaluate and compare descriptive goodness-of-fi t: two comparative fi t indices: Comparative Fit Index (CFI) and Tucker-Lewis Index (TLI); one parsimony correction index: Root-Mean-Square Error of Approximation (RMSEA); and one absolute fi t index: Weighted Root-Mean-square Residual (WRMR).
Cutoff values were derived from simulation studies (Bentler, 1990; Browne & Cudeck, 1992; Hu & Bentler, 1999; Yu, 2002), using the following criteria: good fi t cutoff values: CFI ≥ .96, TLI ≥ .95, RMSEA ≤ .05; acceptable fi t cutoff values: CFI and TLI ≥ .90, RMSEA < .08; mediocre fi t cutoff values: if .08 ≤ RMSEA ≤ .10, with CFI and TLI ≥ .90. Meeting at least two of the three criteria just described in one level of satisfaction, and the remaining in an adjacent level (upper or lower), the model fi t was assumed as conforming to the former (Brown, 2006/2015; Hu & Bentler, 1999). Finally, if CFI or TLI < .90, or RMSEA > .10 the model were rejected. WRMR (smaller is better) was used to corroborate model comparison since it contributes to evaluating aspects of goodness-of-fi t that the other indices do not evaluate (Muthén & Muthén, 2012); nonetheless, cutoff values were not used since they have not been properly studied yet (Muthén, 2013).
For reliability measures, several coeffi cients were calculated. Cronbach’s α, and McDonald’s ω and ωt (McDonald, 1999/2013) were reported as indices of internal consistency of the respective constructs, i.e. the measure of the proportion of variance due to all common factors (ωt) or items (α and ω). Additionally, for bifactor model constructs McDonald’s ωh (as relabeled by Zinbarg, Revelle, Yovel, & Li, 2005) with respective ωs
coeffi cients were reported as indices of factor saturation (domain-specifi c reliability).
Measurement invariance over sex, age, geographical region, and response year was evaluated in Sample 2 through multi-group CFA using χ²-based likelihood-ratio test (LRT) with Satorra (2000) adjusted test statistic. For this purpose, latent variables were scaled with effects coding method (Little, Slegers, & Card, 2006). For every grouping variable, a random subsample was used to ensure equal n per group.
All statistical analyses were performed with R software 3.3.0 (R Core Team, 1997/2016). CFA was conducted with Lavaan package 0.5.20 (Rosseel, 2012).
Data and code have been made available (Echeverría et al., 2016) for reproducibility.
Results
Factorability of the data was excellent according to Bartlett’s sphericity test (χ2 = 16990, df = 91, p<.001) and
Kaiser-Meyer-Olkin (Kaiser & Rice, 1974) measure of sampling adequacy (.95). Data were not multivariate normal according to Henze-Zirkler’s, Mardia’s and Royston’s tests (p<.001).
Descriptive goodness-of-fi t indices
Based on obtained goodness-of-fi t indices (Table 1), MHC-SF one-factor or two-factor models presented an unacceptable global fi t, with RMSEA over the rejection cutoff value. The three-factor model (CTT) had an acceptable fi t with CFI and TLI on good-fi t values and RMSEA on mediocre-fi t value. The BF model had
good overall fi t with CFI and TLI in good-fi t values and RMSEA
on acceptable value. WRMR comparison was consistent with these results.
Factor loadings and reliability
In the bifactor model (Table 2), item loadings onto the general factor were all large (range = .59 - .83, p<.001). All three domain-specifi c factors had at least two salient (≥ .30) loading. Some item loadings onto domain-specifi c factors were relatively small (< .30; items 1, 4, 5, 11 and 14), but none of them was close to zero, as all parameter estimates were statistically signifi cant (p<.001). The variance of every domain-specifi c factor differed signifi cantly from zero (p<001).
Cronbach’s α indicates an excellent internal consistency of scores from both the total scale and its subscales for both models (Table 2). Coeffi cient ω for subscale internal consistency also exhibited excellent indices, the same in both models (reported only for CTT). The ωt internal consistency coeffi cient presented excellent internal consistency for both models in both samples.
Factor saturation indices (domain-specifi c reliability) were calculated only for the bifactor model since ωh and ωs are -by
defi nition- zero for non-hierarchical models. The high value of the ωh coeffi cient indicates very high saturation of the general factor; thus, a sizable proportion of reliable variance in the scale scores was accounted for by the general well-being factor, and therefore a small portion of reliable variance in the scale scores could be accounted for by the domain-specifi c factors (cf. Brunner, Nagy, & Wilhelm, 2012; Reise, 2012).
Measurement Invariance through multi-group CFA
Alternative fi t indices (CFI, RMSEA) for confi gural invariance were acceptable in the CCT and the BF models when analyzed by gender, geographical region, age and year-of-response groups (Table 3). Likelihood-ratio test indicates sustainable loadings’ and intercepts’ measurement invariance (p>.05) for every grouping variable. Age was the only one of these grouping variables that showed to be a statistically signifi cant source of population heterogeneity in factor score means.
Discussion
The aim of this study was to assess the reliability and validity of a Spanish version of the MHC-SF (s-MHC-SF) in a sample of Chilean adults. We used Confi rmatory Factor Analysis to evaluate and compare the fi t of the originally proposed three correlated factors model and that of a recently described bifactor model (de Bruin & du Plessis, 2015; BF: Jovanović, 2015).
CTT model displayed acceptable goodness-of-fi t indices, better than those of a single factor or a two-factor model. All factor loadings were large and statistically signifi cant, and similar or larger than those reported in previous validations studies in other cultures (Joshanloo et al., 2013; Karaś et al., 2014; Lamers et al., 2011; Petrillo et al., 2014). These results contrast with the fi ndings
Table 1
CFA Global goodness-of-fi t indices (Both samples)
Model SBχ² (df) SB/ dfχ² CFI TLI RMSEA [90% CI] WRMR
Sample 1
Single factor 3368.9 (77) 43.8 .915 .899 .162 [.157, .166] 3.66 Two factors 2828.3 (76) 37.2 .929 .914 .149 [.144, .154] 3.32 Three factors 1256.6 (74) 17.0 .969 .962 .099 [.094, .104] 2.05 Bifactor 465.74 (63) 7.4 .990 .985 .063 [.057, .068] 1.10
Sample 2
Single factor 3312.6 (77) 43.0 .913 .897 .156 [.152, .161] 3.62 Two factors 2770.8 (76) 36.5 .928 .914 .144 [.139, .148] 3.27 Three factors 1191.4 (74) 16.1 .970 .963 .094 [.089, .098] 1.99 Bifactor 489.8 (63) 7.8 .989 .983 .063 [.058, .068] 1.14
Note: SBχ² = Satorra-Bentler scaled chi-square, df = degrees of freedom, CFI = Comparative fi t index. TLI = Tucker-Lewis index. RMSEA = Root-mean-square error of approximation. WRMR = Weighted root-mean-square residual
Table 2
CFA Standardized factor loadings and strength indices (Sample 1)
Item & dimension
Correlated-Traits model Bifactor model
EWB SWB PWB total EWB SWB PWB GWB total
01. Happiness .81 .29 .74
02. Interest .88 .30 .81
03. Life Satisfaction .88 .44 .81
04. Social contribution .80 .17 .68
05. Social integration .70 .30 .60
06. Social actualization .82 .60 .62
07. Social acceptance .73 .53 .59
08. Social coherence .78 .62 .61
09. Self-acceptance .80 .36 .75
10. Mastery .80 .31 .70
11. Positive relations .82 .26 .77
12. Personal growth .82 .26 .74
13. Autonomy .81 .49 .67
14. Purpose in life .89 .09 .83
Cronbach’s α .89 .86 .93 .94 .89 .86 .93 .94 .94
McDonald’s ω(t/h/s) ω=.87 ω=.85 ω=.91 ωt=.95 ωs=.16 ωs=.31 ωs=.11 ωh=.86 ωt=.94
reported by Jovanović (2015) in Serbian population, where the CTT model did not meet acceptable fi t indices.
On the other hand, the bifactor solution introduced by Jovanović (2015) and de Bruin & du Plessis (2015) modeled our data better than the CTT model, displaying good to excellent fi t indices. There were no reasonable indicators of psychometric irrelevance of any of the domain-specifi c factors when including the general factor in the model (cf. Chen et al., 2006). Thus, after adjustment for the general being factor, all three well-being subscales of the MHC-SF still account for some additional, unique variance in the indicators. This capability of the bifactor model to account for general and domain-specifi c variance simultaneously, with a better fi t to the data, is a good reason to prefer it over the CTT model. Since MHC-SF is a broad measure aimed at measuring a complex construct consisting of moderately associated factors, it can be argued that the BF model has theoretical and methodological bases for better score estimation and interpretation of the s-MHC-SF.
In this set of results, the reliability of the s-MHC-SF scores with the CTT model was high both for the entire scale as well as for the specifi c subscales. With the BF model, total and general reliability were good, while domain-specifi c reliability was considerably lower. Even though the multidimensionality of data was supported by the size of factor loadings, and goodness-of-fi t of the BF model, the variance explained over and above the general factor was relatively low for SWB, and low for EWB and PWB. These results suggest caution while interpreting subscale
scores, and instead encourages the interpretation of a general score as it was suggested by the scale author (Keyes, 2009). Thus, the general construct of mental health as measured by the s-MHC-SF seems acceptable to be used as a measure of well-being in the Chilean population.
As shown by the measurement invariance tests, both the CTT and BF models could be used to compare parameter estimates over gender, geographical region, age and from one year to another. Since age showed to be a source of population heterogeneity, individual differences between younger and older people should be interpreted with caution. These fi ndings extend the work by Joshanloo et al. (2013), who demonstrated measurement invariance of the MHC-SF CTT model across cultures.
Future studies should address issues such as a more exhaustive evaluation of model specifi cation, identifi cation of sources of domain-specifi c insuffi cient saturation, and consequential factor loadings and subscale factors reliability enhancement. Also, an examination of convergent validity comparing the s-MHC-SF with other well-being measures should be undertaken.
One of the strengths of this study is the large sample size: 3,355 Chilean adults, including residents of the 15 regions of Chile with ages ranging between 20 and 83 years old. However large, this is a convenience sample and as such it is not representative of the Chilean population. Among the sample´s biases are the predominance of females and young people, with a presumably high level of education. A motivation bias cannot be ruled out as all subjects voluntarily registered in a self-care program.
Table 3
Likelihood-ratio test (χ² difference test) for Multi-group Measurement Invariance (Sample 2)
Invariance level
Correlated-traits Bifactor
χ² (df) Δχ² [CFI] Δdf
[RMSEA] p (>χ²) χ² (df) Δχ² [CFI]
Δdf
[RMSEA] p (>χ²)
Gendera
Confi gural 436.3 (145) [.969] [.093] 213.3 (122) [.984] [.074]
Loadings 482.2 (159) 2.87 2.92 .398 273.8 (150) 4.95 4.72 .385 Intercepts 489.2 (212) 1.00 9.96 >.999 267.0 (202) -0.97 9.96 >.999
Means 529.6 (215) 3.33 1.59 .134 328.3 (206) 5.31 1.96 .068
Response Yearb
Confi gural 580.5 (145) [.972] [.092] 228.6 (122) [.988] [.066]
Loadings 612.2 (159) 1.66 2.62 .573 266.7 (150) 2.65 4.30 .663 Intercepts 635.0 (212) 3.18 9.78 .973 289.4 (202) 3.17 9.78 .974
Means 652.2 (215) 1.34 1.57 .401 311.6 (206) 1.80 1.87 .378
Geographic Regionc
Confi gural 520.5 (216) [.971] [.094] 229.2 (181) [.987] [.069]
Loadings 587.1 (244) 2.19 3.78 .668 444.6 (237) 10.58 6.67 .138 Intercepts 611.4 (350) 1.54 10.41 .999 387.1 (341) -3.64 10.41 >.999
Means 684.1 (356) 2.78 1.73 .204 458.0 (349) 2.82 2.12 .265
Aged
Confi gural 745.9 (216) [.966] [.088] 259.9 (181) [.990] [.061]
Loadings 857.1 (244) 4.57 3.85 .314 457.2 (237) 10.39 6.10 .115 Intercepts 1,045.0 (350) 13.13 9.72 .199 521.8 (341) 4.51 9.72 .910 Means 1,304.5 (356) 9.76 1.56 .004 948.0 (349) 16.41 1.84 <.001
A more representative sample, additional test-retest studies, longitudinal cohorts, cross-cultural research, and other multi-group CFA analysis should provide additional information on this translated questionnaire when applied in mental health and well-being studies.
In this study, we report several approaches for determining the validity and reliability of the scores obtained with the Spanish version of MHC-SF. We conclude that in our sample of Chilean adults the s-MHC-SF behaves at least as reliably as other language versions of the questionnaire do in other cultures. In sum,
s-MHC-SF showed to be a valid version of the MHC-s-MHC-SF; thus, it may prove useful in the evaluation of well-being of Spanish-speaking populations, in particular, within the Latin American region.
Acknowledgements
We are grateful to Fundación Banmédica, to Fondo Nacional de Desarrollo Científi co y Tecnológico (FONDECYT, Grant # 1150340) and to Corey Keyes for his authorization for the translation of the MHC-SF.
References
Beauducel, A., & Herzberg, P. Y. (2006). On the Performance of Maximum Likelihood Versus Means and Variance Adjusted Weighted Least Squares Estimation in CFA. Structural Equation Modeling: A Multidisciplinary Journal, 13(2), 186-203.
Bentler, P. M. (1990). Comparative fi t indexes in structural models.
Psychological Bulletin, 107(2), 238-246.
Browne, M. W., & Cudeck, R. (1992). Alternative Ways of Assessing Model Fit. Sociological Methods & Research, 21(2), 230-258. Brown, T. A. (2015). Confi rmatory factor analysis for applied research.
New York: The Guilford Press.
Brunner, M., Nagy, G., & Wilhelm, O. (2012). A tutorial on hierarchically structured constructs. Journal of Personality, 80(4), 796-846. Chen, F. F., West, S. G., & Sousa, K. H. (2006). A Comparison of Bifactor
and Second-Order Models of Quality of Life. Multivariate Behavioral Research, 41(2), 189-225.
de Bruin, G. P., & du Plessis, G. A. (2015). Bifactor analysis of the mental health continuum-short form (MHC-SF). Psychological Reports,
116(2), 438-446.
De Vos, M. (2012). The unbearable lightness of happiness policy. In P. Booth (Ed.), ... and the pursuit of happiness: Wellbeing and the role of government (pp. 181-200). Westminster, UK: The Institute of Economic Affairs (IEA).
Diener, E., Emmons, R. A., Larsen, R. J., & Griffi n, S. (1985). The Satisfaction With Life Scale. Journal of Personality Assessment,
49(1), 71-75.
Diener, E., & Seligman, M. E. P. (2002). Very happy people. Psychological Science, 13(1), 81-84.
Echeverría, G., Torres-Sahli, M., Pedrals, N., Padilla, O., Rigotti, A., & Bitran, M. (2016). Data, Instrument and Code for validation of s-MHC-SF [Data fi le and documentation]. http://doi.org/10.6084/ m9.fi gshare.3370828
Flora, D. B., & Curran, P. J. (2004). An empirical evaluation of alternative methods of estimation for confi rmatory factor analysis with ordinal data. Psychological Methods, 9(4), 466-491.
Hone, L. C., Jarden, A., Schofi eld, G. M., & Duncan, S. (2014). Measuring
fl ourishing: The impact of operational defi nitions on the prevalence of high levels of wellbeing. International Journal of Wellbeing, 4(1), 62-90.
Hu, L., & Bentler, P. M. (1999). Cutoff criteria for fi t indexes in covariance structure analysis: Conventional criteria versus new alternatives.
Structural Equation Modeling: A Multidisciplinary Journal, 6(1), 1-55.
Jöreskog, K. G. (2002). Censored variables and censored regression. Retrieved from http://www.ssicentral.com/lisrel/techdocs/censor.pdf Joshanloo, M., Wissing, M. P., Khumalo, I. P., & Lamers, S. M. A. (2013).
Measurement invariance of the Mental Health Continuum-Short Form (MHC-SF) across three cultural groups. Personality and Individual Differences, 55(7), 755-759.
Jovanović, V. (2015). Structural validity of the Mental Health Continuum-Short Form: The bifactor model of emotional, social and psychological well-being. Personality and Individual Differences, 75, 154-159. Kaiser, H. F., & Rice, J. (1974). Little Jiffy, Mark IV. Educational and
Psychological Measurement, 34(1), 111-117.
Karaś, D., Cieciuch, J., & Keyes, C. L. M. (2014). The Polish adaptation of the Mental Health Continuum-Short Form (MHC-SF). Personality and Individual Differences, 69, 104-109.
Keyes, C. L. M. (2002). The mental health continuum: From languishing to
fl ourishing in life. Journal of Health and Social Behavior, 43(2), 207-222. Keyes, C. L. M. (2005). Mental illness and/or mental health? Investigating
axioms of the complete state model of health. Journal of Consulting and Clinical Psychology, 73(3), 539-548.
Keyes, C. L. M. (2007). Promoting and protecting mental health as
fl ourishing: A complementary strategy for improving national mental health. The American Psychologist, 62(2), 95-108.
Keyes, C. L. M. (2009). Atlanta: Brief description of the mental health continuum short form (MHC-SF). Retrieved from https://www.aacu. org/sites/default/fi les/MHC-SFEnglish.pdf
Keyes, C. L. M., Shmotkin, D., & Ryff, C. D. (2002). Optimizing well-being: The empirical encounter of two traditions. Journal of Personality and Social Psychology, 82(6), 1007-1022.
Keyes, C. L. M., Wissing, M., Potgieter, J. P., Temane, M., Kruger, A., & van Rooy, S. (2008). Evaluation of the mental health continuum-short form (MHC-SF) in setswana-speaking South Africans. Clinical Psychology & Psychotherapy, 15(3), 181-192.
Kline, R. B. (2015). Principles and practice of structural equation modeling. New York: The Guilford Press.
Lamers, S. M. A., Westerhof, G. J., Bohlmeijer, E. T., ten Klooster, P. M., & Keyes, C. L. M. (2011). Evaluating the psychometric properties of the Mental Health Continuum-Short Form (MHC-SF). Journal of Clinical Psychology, 67(1), 99-110.
Lei, P.-W. (2009). Evaluating estimation methods for ordinal data in structural equation modeling. Quality & Quantity, 43(3), 495-507. Li, C.-H. (2014). The performance of MLR, USLMV, and WLSMV
estimation in structural regression models with ordinal variables
(Doctoral dissertation, Michigan State University). Available from ProQuest Dissertations and Theses database. (UMI No. 3620406) Little, T. D., Slegers, D. W., & Card, N. A. (2006). A Non-arbitrary
Method of Identifying and Scaling Latent Variables in SEM and MACS Models. Structural Equation Modeling: A Multidisciplinary Journal, 13(1), 59-72.
Lyubomirsky, S., King, L., & Diener, E. (2005). The benefi ts of frequent positive affect: Does happiness lead to success? Psychological Bulletin, 131(6), 803-855.
Machado, W. de L., & Bandeira, D. R. (2015). Positive Mental Health Scale: Validation of the Mental Health Continuum - Short Form.
Psico-USF, 20(2), 259-274.
Martínez Aldunate, D., Ivanovic-Zuvic Ramírez, F., & Unanue Manríquez, W. (Eds.) (2013). La felicidad: evidencias y experiencias para cambiar nuestro mundo [Happiness: Evidence and experiences to change our world]. Santiago, Chile: Ediciones de la Sociedad de Neurología, Psiquiatría y Neurocirugía.
McDonald, R. P. (2013). Test Theory: A Unifi ed Treatment. Psychology Press (Original work published 1999).
Muthén, L. K., & Muthén, B. O. (2012). Mplus User’s Guide (Seventh). Los Angeles, CA.
Nitsche, M. P., Bitran, M., Pedrals, N., Echeverría, G., & Rigotti, A. (2014). Positive psychosocial factors and cardiovascular health. Revista Médica de Chile, 142(10), 1316-1323.
Petrillo, G., Capone, V., Caso, D., & Keyes, C. L. M. (2014). The Mental Health Continuum-Short Form (MHC-SF) as a Measure of Well-Being in the Italian Context. Social Indicators Research, 121(1), 291-312. R Core Team. (2016). R: A language and environment for statistical
computing. Vienna, Austria: R Foundation for Statistical Computing. Reise, S. P. (2012). Invited Paper: The Rediscovery of Bifactor Measurement
Models. Multivariate Behavioral Research, 47(5), 667-696.
Ro, E., & Clark, L. A. (2009). Psychosocial functioning in the context of diagnosis: Assessment and theoretical issues. Psychological Assessment, 21(3), 313-324.
Rosseel, Y. (2012). Lavaan: An R Package for Structural Equation Modeling. Journal of Statistical Software, 48(1), 1-36.
Ryff, C. D. (2014). Psychological well-being revisited: Advances in the science and practice of eudaimonia. Psychotherapy and Psychosomatics, 83(1), 10-28.
Satorra, A. (2000). Scaled and Adjusted Restricted Tests in Multi-Sample Analysis of Moment Structures. In: Heijmans RDH, Pollock DSG, Satorra A eds. Innovations in Multivariate Statistical Analysis (pp. 233-247). Boston, MA: Springer US.
Thin, N. (2012). Counting and recounting happiness and culture: On happiness surveys and prudential ethnobiography. International Journal of Wellbeing, 2(4), 313-332.
Yu, C.-Y. (2002). Evaluating cutoff criteria of model fi t indices for latent variable models with binary and continuous outcomes (Doctoral dissertation). University of California Los Angeles. Retrieved from http://ww.statmodel2.com/download/Yudissertation.pdf
Zinbarg, R. E., Revelle, W., Yovel, I., & Li, W. (2005). Cronbach’s α, Revelle’s