Reorganization of functional connectivity as
a correlate of cognitive recovery in acquired
brain injury
Nazareth P. Castellanos,
1Nuria Paúl,
2Victoria E. Ordóñez,
1Olivier Demuynck,
3Ricardo Bajo,
1Pablo Campo,
1Alvaro Bilbao,
4Tomás Ortiz,
2Francisco del-Pozo
1and Fernando Maestu
1,51 Laboratory of Cognitive and Computational Neuroscience, Centre for Biomedical Technology (CTB), Universidad Politécnica de Madrid, Madrid, 28660, Spain
2 Department of Psychiatric and Medical Psychology, Medicine School, Universidad Complutense de Madrid, 28040, Spain 3 Department of Signals, Systems and Radiocomunications, Universidad Politécnica de Madrid, 28040, Spain
4 National Centre for Brain Injury Treatment (CEADAC) Madrid, 28034, Spain
5 Department of Basic Psychology II - Cognitive Process, Universidad Complutense de Madrid, 28223, Spain
Correspondence to: Nazareth P. Castellanos,
Laboratory of Cognitive and Computational Neuroscience, Centre for Biomedical Technology,
Campus de Montegancedo 28660, Universidad Politécnica de Madrid, Spain
E-mail: [email protected]
Cognitive processes require a functional interaction between specialized multiple, local and remote brain regions. Although these interactions can be strongly altered by an acquired brain injury, brain plasticity allows network reorganization to be principally responsible for recovery. The present work evaluates the impact of brain injury on functional connectivity patterns. Networks were calculated from resting-state magnetoencephalographic recordings from 15 brain injured patients and 14 healthy controls by means of wavelet coherence in standard frequency bands. W e compared the parameters defining the network, such as number and strength of interactions as well as their topology, in controls and patients for two conditions: following a traumatic brain injury and after a rehabilitation treatment. A loss of delta- and theta-based connectivity and conversely an increase in alpha- and beta-band-based connectivity were found. Furthermore, connectivity parameters approached controls in all frequency bands, especially in slow-wave bands. A correlation between network reorganization and cognitive recovery was found: the reduction of delta-band-based connections and the increment of those based on alpha band correlated with Verbal Fluency scores, as well as Perceptual Organization and Working Memory Indexes, respectively. Additionally, changes in con-nectivity values based on theta and beta bands correlated with the Patient Competency Rating Scale. The current study provides new evidence of the neurophysiological mechanisms underlying neuronal plasticity processes after brain injury, and suggests that these changes are related with observed changes at the behavioural level.
Keywords: brain injury; functional connectivity; magnetoencephalography; plasticity
Introduction
Brain plasticity has been described as the brain's ability to evolve, an intrinsic property of the nervous system that persists through-out life and plays an important role in maturity, development and acquisition of new skill processes. Importantly, plasticity becomes fundamental for functional recovery from a brain injury (Nudo, 1996, 2006; Leocani, 2006), being the mechanism underlying the potential capability of the brain to compensate for lesions. Acquired brain injury constitutes one of the leading causes of mortality and disability around the world, leaving motor and cog-nitive sequels that vary depending on aetiology, extent and sever-ity of damage (Katz et al., 2006). In particular, cognitive deficits are the main sources of disability after traumatic brain injury and stroke, so rehabilitation strategies to promote their recovery and reduce their disability are needed (Cicerone et al., 2000, 2005), and must be designed to take full advantage of plasticity (Butz et al., 2009). In order to treat cognitive deficits, neuropsychologic-al rehabilitation has been developed as a systematic, functionneuropsychologic-ally oriented therapeutic intervention, based on the assessment and understanding of a patient's cognitive deficits, emotional or be-havioural regulation problems and functional disabilities. Currently, it is possible to find a large amount of literature that supports the benefits of various types of cognitive interventions with traumatic brain injury patients (Cicerone et al., 2000; 2005; Halligan and Wade, 2005; Katz et al., 2006; McCabe et al., 2007; Turner-Stokes, 2008). However, the debate is still open, as it is empha-sized by Cicerone (Cicerone et al., 2000) and Rholing's group (Rholing et al., 2009) in their systematic reviews about the topic.
The study of the cerebral mechanisms underlying brain injury and their plastic changes could boost our knowledge about neural recovery. Nowadays, the increased use of neuroimaging tech-niques is enhancing our understanding of brain damage and neur-onal plasticity (Wilson, 2008). Several works show evidence of neuronal reorganization following traumatic brain injury and re-covery (for a review see Muñoz-Céspedes et al., 2005) but have also noted the heterogeneity of results from activation measures. Researchers have used a variety of tasks and techniques and con-sequently there is a corresponding diversity of results (Kelly et al., 2006). It is necessary to study this problem from another point of view, probably by means of the changes in the interaction be-tween brain areas, and not just by measurements of local changes in activation patterns.
A possible framework to study brain strategies for brain injury recovery is based on the idea that the brain is a complex network of dynamical systems with abundant interactions between local and more remote brain areas (Várela et al., 2001). More than a half century ago Hebb (1949) suggested that neuronal cortical connections can be remodelled by our experience. Since then, plasticity in the cerebral cortex has been studied in depth (Bennett et al., 1964; Rosenzweig et al., 1966; Kolb et al., 1995), for example in learning (Merzenich et al., 1984) and in response to brain lesions (Jenkins and Merzenich, 1987; Florence et al., 1998). A focal brain lesion induces changes in adjacent and other remote, but interconnected, brain regions (Lee and van Donkelaar, 1995; Nudo, 1996; Witte and Stall, 1997).
A mechanism proposed as responsible for functional remodelling in local and distant brain regions could be the rewiring of its ana-tomical connections by retraining, compensating and/or substitut-ing brain functionsubstitut-ing (Wilson, 2008). A new approach is to study the impact of a lesion on the brain by means of the functional interactions ('functional connectivity') that take place between brain regions (Quigley et al., 2001; Stam et al., 2002; Salvador et al., 2005). In the study of such interactions between brain areas the concept of functional connectivity has emerged, referring to the statistical interdependencies between physiological time series recorded in various brain areas simultaneously (Aertsen et al., 1989). Functional connectivity is, probably, an essential tool for the study of brain functioning (Tononi and Edelman, 1998; Singer, 1999; Bressler, 2002; Várela et al., 2001) and its deviation from healthy patterns could be used as an indication of lesion. Electroencephalographic and magnetoencephalographic (MEG) recordings have been shown to be reliable techniques for the study of functional connectivity (Várela et al., 2001; Schnitzler and Gross, 2005, Guggisberg et al., 2008). For example, function-al connectivity from such continuous time series have demon-strated alterations in functional connectivity of Alzheimer's disease (Stam et al., 2002), multiple sclerosis (Cover et al., 2004, 2006) and patients with brain injury (Bartolomei et al., 2006a; Douw et al., 2008; Nakamura et al., 2009; Cao and Slobounov, 2010).
The present study was developed with the aim of quantifying functional connectivity changes in patients with traumatic brain injury, who underwent resting-state MEG recordings following traumatic brain injury and after a rehabilitation treatment, com-pared with control subjects. We calculated, by means of the time averaged wavelet coherence, the interaction between the whole-head MEG signals (Figs 1A-C) in the standard frequency bands. To quantify differences with respect to those from healthy con-trols, we proposed a measure of distance-to-control connectivity patterns that helped us to study how altered these connectivity parameters were following a traumatic brain injury and how, as expected, they were after recovery. In order to link the neuro-physiological evaluation of patients with their cognitive ability, we correlated changes in connectivity parameters with changes in neuropsychological test scores. Finally, network architecture in pa-tients in both conditions were checked to see if they were distin-guishable or not from control topology by means of a linear discriminant analysis (Fig. 1C), with the aim of evaluating whether reorganization of the network occurs during recovery. The current study would like to provide, for the first time, evidence of the neurophysiological mechanisms underlying the process of neuronal plasticity after brain Injury, and test whether those changes In functional connectivity at the neurophysiological level are related with changes observed at the behavioural level.
Materials and methods
Subjects
UJ
Time domain
B Experimental design
PreData collection and analysis
Post
Spectral-connectivity domain
Control
/
Lesion
Neuropsychological rehabilitati Time
3,8 months 14 months
C Connectivity parameters
Topology
Number of links
ifU lift
Links weight
n&t
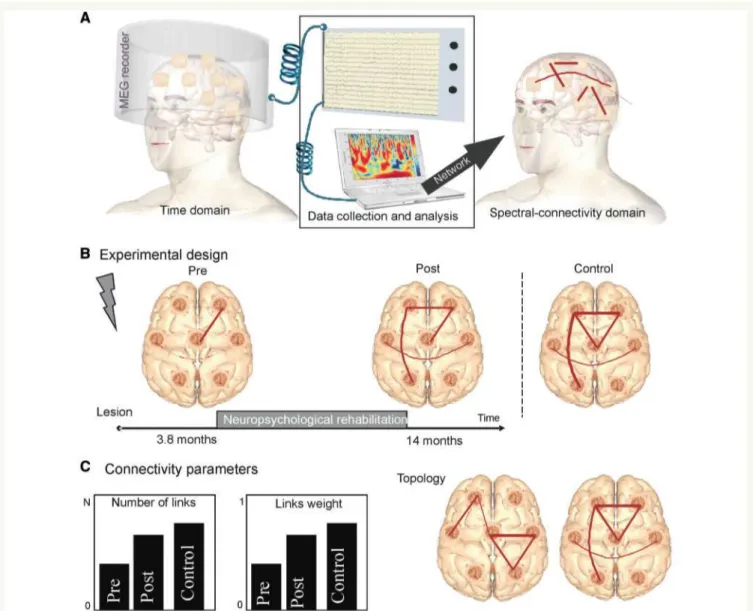
Figure 1 (A) Transformation from time domain (148 MEG time series are recorded) to Connectivity domain (a posterior connectivity analysis was performed in order to infer the functional connectivity between each pair of signals). (B) Illustration of experimental protocol and hypothesis: functional connectivity patterns from patients with traumatic brain injury were calculated a few months after
injury (pre-rehabilitation condition). After a neuropsychological rehabilitation (post-rehabilitation) the connectivity pattern of the same group of patients was calculated. These pre- and post-rehabilitation networks were compared with those from the group of healthy controls. (C) Parameters defining a network: the number of links (3, 4 and 5 for pre-rehabilitation, post-rehabilitation and control networks in B, respectively) and the weight of these links (coded in the networks from B as the thick coupling lines). The proposed measure, distance-to-control connectivity pattern, Dp°entr°¡.t aims to quantify differences by means of both connectivity parameters (number and
weight). We hypothesize that connectivity parameters of post-rehabilitation networks are closer than pre-rehabilitation networks to those parameters of control networks (illustrative bar diagrams), i.e. Dp°"frol <Dp°entral. Differences between patient and control group networks
could also be due to differences in the topology (architecture) of the network. We show two examples of topologies where the con-nectivity parameters such as number of links (5 in this case) and weight (all lines have the same thickness) are equivalent but their architectures are very different. Linear discriminant analysis aims to capture differences in the sense of topology.
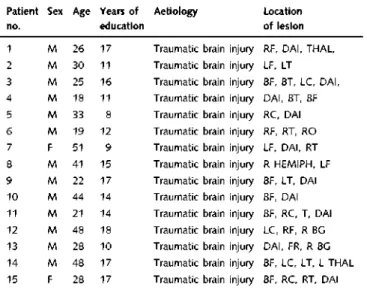
underwent a neurorehabilitation) and 14 healthy controls. Patients had suffered severe traumatic brain injury, according to the period of post-traumatic amnesia (Lishman, 1968). All patients showed severe cognitive impairments in several domains such as attention, memory and executive function. Mean age of the patients was 32.13 years (18, 51), and the mean level of education was 13.7 years (8, 18). Mean time since injury at the beginning of the study was 3.8 months (2, 6), and the neurorehabilitation program lasted for an averaged period of 9.4 months (7, 12). Values in brackets refer to
range. Table 1 summarizes the demographic and clinical profile of the patients. Experimental and healthy control groups were matched for age (31.93), educational level (15.57) and gender. Exclusion criteria for the selection of all participants included previous medical history of psychiatric disease and extended psychoactive drug consumption.
Table 1 Demographic and clinical profile of patients included in the study
Patient no. 1 2 3 4 5 6 7 8 9 10 11 12 13 14 15 Sex M M M M M M F M M M M M M M F Age 26 30 25 18 33 19 51 41 22 44 21 48 28 48 28 Years of education 17 11 16 11 8 12 9 15 17 14 14 18 10 17 17 Aetiology Traumatic brain Traumatic brain Traumatic brain Traumatic brain Traumatic brain Traumatic brain Traumatic brain Traumatic brain Traumatic brain Traumatic brain Traumatic brain Traumatic brain Traumatic brain Traumatic brain Traumatic brain injury injury injury injury injury injury injury injury injury injury injury injury injury injury injury Location of lesion
RF, DAI, THAL, LF, LT BF, BT, LC, DAI, DAI, BT, BF RC, DAI RF, RT, RO LF, DAI, RT R HEMIPH, LF BF, LT, DAI BF, DAI BF, RC, T, DAI LC, RF, R BG DAI, FR, R BG BF, LC, LT, L THAL BF, RC, RT, DAI M = male; F = female; R = right; L = left; B = bilateral, F = frontal; T = temporal; C = central; O = occipital; DAI = diffuse axonal injury; THAL = thalamus; BG = basal ganglia.
were measured once, assuming that brain networks do not change in their structure in less than one year, as demonstrated previously in young (Damoiseaux ef a/., 2006) and elderly subjects (Beason-Held ef a/., 2009).
All participants or legal representatives gave their written informed consent to participate in the study. The study was approved by the Local Ethics Committee.
Neuropsychological rehabilitation
program and neuropsychological
assessment
All study patients completed a neurorehabilitation program that was adapted to each individual's requirements. This program was con-ducted in individual sessions attempting to offer an intensive neuropsychological-based rehabilitation, provided in 1 h sessions for 3-4 days a week. In some cases, cognitive intervention was coupled with other types of neurorehabilitation therapies according to the pa-tient's profile (physiotherapy, speech therapy or occupational therapy). Depending on the severity and deficit features of each case, strategies of restitution, substitution and/or compensation were applied as well as training in daily living activities, external aids or the application of behavioural therapy. Patients and controls underwent a neuropsycho-logical assessment, in order to establish their cognitive status in mul-tiple cognitive functions (attention, memory, language, executive functions and visuospatial abilities) as well as their functioning in daily life. All subjects completed the Wechsler Adult Intelligence Scale III (WAIS-III; Wechsler, 1997), the Wechsler Memory Scale Revised (Wechsler, 1987), the Brief Test of Attention (Schretlen, 1997), the Trail Making Test (Reitan, 1992), the Stroop Colour Word Test (Golden, 1978), the Wisconsin Card Sorting Test (Heaton,1991), the Verbal Fluency Test (Gladsojo ef a/., 1999), the Tower of Hanoi (Édouard, 1983), the Zoo Map Test (from the Behavioral Assessment of the Dysexecutive Syndrome; Wilson ef a/.,
1996) and the Patient Competency Rating Scale (PCRS; Prigatano ef a/., 1991). This last scale is formed from 30 items related to differ-ent daily living activities (basic and instrumdiffer-ental activities as well as social skills and cognitive and emotional issues) and the patient's level of competency on a five-point Likert scale.
Magnetoencephalographic recordings
Magnetic fields were recorded using a 148-channel whole-head mag-netometer (4D-MAGNES® 2500 WH, 4-D Neuroimaging) confined in a magnetically shielded room. Raw data were collected using a sam-pling rate of 169.45 Hz and band-pass filtered between 0.1 and 50 Hz. MEG data were submitted to an interactive environmental noise re-duction procedure. Fields were measured during a no task eyes-open condition. Time-segments containing eye movement or blinks (as indi-cated by peak-to-peak amplitudes in the electro-oculogram channels in excess of 50 uV) or other myogenic or mechanical artefacts were rejected and time windows not containing artefacts were visually selected by experienced investigators, up to a segment length of 12 s. Digitized MEG data were imported into MATLAB Version 7.4 (Mathworks, Natick, MA, USA) for analysis with custom-written scripts.
Analysis
Wavelet coherence
Wavelet transform can be used as an alternative to Fourier transform for the performance of time-spectral analysis when dealing with non-stationary time series (Mallat, 1998). By using wavelet transform, we can perform a time-frequency analysis of rhythmic components in a MEG signal, and hence estimate the wavelet coherence for a pair of signals, a normalized measure of association between two time series (Torrence and Compo, 1998; Grinsted ef a/., 2004). The global wave-let coherence, C j can be obtained by time averaging local (time-dependent) coherence
C%(p) = \jo Cxy(p,z)dz
where C (p,z) is the wavelet coherence between signals x(f) and y(t) at the p scale and ztime-localization, T is the length of the signal (Percival, 1995) with time-predominant connectivity values. To evalu-ate the significance level we use a surrogevalu-ate data test (Theiler ef a/., 1992; Schreiber and Schmitz, 2000, Korzeniewska ef a/., 2003) with Monte Carlo simulation to establish a 95% confidence interval and avoid spurious couplings. Global wavelet coherence, C j was then averaged in the following frequency bands: S (1-4) Hz, 9 (4-8) Hz, a (8-13) Hz and p (13-30) Hz for all combinations of the 148 signals. Further spatial averaging in whole head was done: in frontal, central, right and left temporal and occipital regions to obtain local connec-tions within a brain area, and long-distance connecconnec-tions between two different brain regions (frontal and central; frontal and right temporal; frontal and left temporal; frontal and occipital; central and right tem-poral; central and left temtem-poral; central and occipital; right temporal and left temporal; occipital and right temporal; occipital and left temporal).
connectivity parameters. Distance-to-control connectivity pattern is therefore given by:
ncontrol _ ^ c o n t r o l — BCpost WQontrol — W Cp 0s t '-'post — 7T^
ec„
wc„
A similar equation is defined for Dp°"tro1 . This measure was calculated
separately for each local and long-distance connection and each fre-quency band. Small values of D™"'™^ indicate that patient's connect-ivity pattern parameters were close to those shown by the control group, and hence restoration of functional connectivity had taken place; whereas large values of D™"'™^ suppose deviation from control parameters. We hypothesize that the connectivity pattern parameters of post-rehabilitation condition will be closer to the parameters of healthy controls than those exhibited by patients following a brain injury, i.e. Dp°"ttrol<Dp°"tro1. The procedure is illustrated in
Figs 1B and C.
Linear discriminant analysis
Connectivity pattern parameters (such as number of connections and their weight) could be just one of the causes of differences in functional connectivity between patients' conditions and healthy controls, as quantified above by D™"'™^. However, there could also be differences related to the network architecture (Fig. 1C). To study how the network topology reorganizes in both patient conditions, we utilized a discriminant technique able to identify sub-jects as separated groups according to the network topology. For this purpose Fisher-LDA has been proposed as an information reduction technique which preserved the discriminant data for classification, emerging from the question of how labelled information can be utilized for finding informative projections (Ripley, 1996; Jaakkola and Haussler, 1999; Huan and Ramaswamy, 2004; Maindonald and Braun, 2007; Lehmanna ef a/., 2007). The solution of Fisher-discriminant is the election of a specific direction to project data into one-dimensional space. As a measure of distance between centres of groups the statistic D2 of Mahalanobis was used, calculated from the variance-covariance matrix.
Statistical analysis
In order to increase statistical power and reduce the effect of non-Gaussian distribution, we normalized connectivity values by means of a logarithmic transformation (Gasser ef a/., 1982; Pivik ef a/., 1993). A Kruskal-Wallis test was used to compare control, pre- and post-rehabilitation conditions at P<0.05 (see Brookes ef a/., 2005; Kilner ef a/., 2009; Campo ef a/., 2010, for a similar statistical approach). Neuropsychological data were analysed using the statistical program SPSS 15.0, and ANOVA analysis (P<0.05) was used in order to iden-tify differences among the control group and each stage (pre- and post-rehabilitation) of the patient group.
Results
Neuropsychological results
Pre-rehabilitation results in the neuropsychological assessment indicate that patients with traumatic brain injury had scores that were statistically lower compared with both control subjects and patients post-rehabilitation in most of the tests used (asterisks and points in Figs 2A and B). All neuropsychological results at post-rehabilitation followed a trend towards improvement
in comparison with pre-execution in the tests analysed (better per-formance and reaction time reduction). Post-rehabilitation results are statistically similar to those of controls in most of the tests (asterisks in Figs 2A and B). Regarding the cognitive processes implicated in the results obtained, there was a statistical improve-ment in attentional skills (Trail Making Test and Brief Test of Attention), memory processes (Wechsler Memory Scale Revised, Working Memory Index), executive functions (Wisconsin card sorting test) and PCRS. In addition, some measures of the post-assessment relating to attention, memory and executive functions did not show statistically significant differences with the control group. The recovery effect has been produced in five of six tests exposed (Fig. 2B) and five of nine global indexes (Fig. 2A).
Distance-to-control connectivity pattern
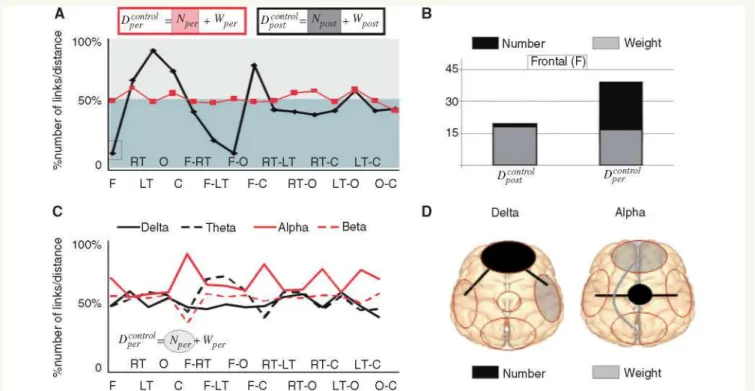
We have proposed a measure of distance-to-control connectivity pattern, which takes into account the two parameters defining the connectivity pattern: number and weight of connections, as defined by D?¡£'r£[t. Figure 3 shows the distance-to-control
param-eters in patients before, Dp°entrol (lower panels), and after
rehabili-tation, D^Hl'01 (upper panels), for each local and long-distance link, per spectral band. The most remarkable results are found in the delta spectral band, where distance-to-control reaches greater re-ductions from the pre- to the post-rehabilitation group. The high-est Dp°entrol are localized in local connections within central (62%
higher than control) and right temporal (66%) regions and in long-distance connections as right temporal-central (60%), right temporal-frontal (55%), central-occipital (50%) and frontal-central (57%). Connections where the highest reduction in distance-to-control occurred were: 57% from Dp°entrol to
D^!*01 within right temporal with Dc°Qfo1 2.7%, being the lowest value and hence the most close to control values; 68% in occipital where Dp°"frol converged to 13%; 59% in frontal;
72% in frontal-right temporal leading Dc°¿*d to 8%; 69% in left temporal-occipital where Dp°"ttrol reached 1 1 % ; 60% in
frontal-left temporal; 82% in frontal-occipital; 53% in frontal-cen-tral; and 67% in occipital-central. Pre-rehabilitation distance-to-control, Dp°entrol, in the delta band had a negative
sign, i.e. both the number of connections and their weight in pre-rehabilitation patients are higher than in controls, a contrary effect to that which occurred in the other frequency bands, prin-cipally in the alpha spectral band. The main difference with the controls in theta-based distance-to-control is localized in connec-tions within frontal (35%) and occipital (64%) that decreases after rehabilitation to 41 and 13%, respectively. The lower Dp°"frc>l
A Index Scores of WAIS-ill and WMSR
130 120 110 100
90 80 70
-#-Conlra)
- t a i POET
- • - P R E
• •
• • ^ *
•
• >
X *
* *
"*"*
• *
•
V » 11S 107 93
PI a
tie
105 S5
VCI 117 1'1 90
WMI 111 90 84
POI 113 110 33
PSI 116 GO 70
Al 105 00 77
GMI 124 IOS 87
DRI 122 104 87
B Neuropsychological test score
150
100
Pre Post • Control
~n 1 I
TMT-B
•rn
BTA WCST - WCST -
if
Concept. Persev.
FAS PCRS
Figure 2 (A) Means of the general scores in the WAIS-III and some indexes of the Wechsler Memory Scale-R pre- (blue line) and post-rehabilitation (red line) and in controls (green line). VIQ = verbal IQ; PIQ = performance IQ; VCI = Verbal Comprehension Index; W M I = Working Memory Index; POI = Perceptual Organization Index; PSI = Processing Speed Index. Al = Attention Index; GMI = General Memory Index; DRI = Delayed Recall Index. (B) Means and statistical differences of some neuropsychological scores pre- and
post-rehabilitation and for the control group. Asterisk indicates a statistically significant difference (P<0.05) with the control group, and black dot indicates a statistically significant difference between pre- and post-rehabilitation stages. TMT-B = Trail Making Test-B (time in seconds); BTA = Brief Test of Attention (total score); WCST-Concept = percentage total score of conceptual level;
WCST-Persev = percentage total score of perseverative responses; FAS = Verbal Fluency Test (phonetic verbal fluency total score); PCRS = daily living competency (total score).
Figure 3 Distance-to-control connectivity patterns from patients pre- (lower panels) and post-rehabilitation (upper panels) per frequency band, Dp°entral and Dp°"fro1, respectively. This measure quantifies the percentage of increase (or decrease) with respect to control
are localized in connections within central area (8%), frontal-central (7.5%), right temporal-central (6.8%), left tem-poral-central (7.6%) and occipital-central (8.2%). In the beta spectral band the highest Dp°entrol value occurs in connections
within frontal (57%), occipital (51%) and frontal-left temporal (54%) areas. The highest reduction occurs in right temporal-cen-tral (68%) and frontal (48%) connections. Couplings reaching the lower Dp°"frol are connections within central (3.6%), frontal-central
(3.4%), right temporal-central (14%), left temporal-central (13%) and occipital-central (3.5%) areas.
Distance-to-control connectivity pattern has two contributions: weight and number of connections; changes in these features induce the reductions of D^t t r o l previously described. The degree
of contribution of each parameter over such distance reduction could reflect the mechanism of recovery after traumatic brain injury. To study and quantify this phenomenon, we calculated the percentage of contribution of number or weight of connec-tions over Dp°entroland Dp°"frol as well as the changes of each
par-ameter from pre- to post-rehabilitation. We defined as responsible the mechanism of recovery (to that parameter with a
statistically greater reduction from pre- to post-rehabilitation) having a non-dominant contribution degree to Dp°"fral. Figure 4C
shows the percentage of contribution of the number of connec-tions over the Dp°entrolin all frequency bands and areas. Both
number and weight parameters contribute equally (around 50% each one) to D™ntrol, i.e. the number and weight of connections
increase or decrease simultaneously after traumatic brain injury in the majority of the brain area connections and in different fre-quency bands. Only in the beta frefre-quency band can we observe a predominance of the number of connections for frontal-central, right temporal-central and left temporal-central areas coupling. However, in post-rehabilitation, one of these connectivity param-eter components has a greater contribution to recovery (distance-to-control reduction) than the other one. Local connec-tions in delta-based connectivity inside the frontal area experi-enced a reduction of distance-to-control from pre-rehabilitation values of 59%, leading 0 ^ ° ' = 10%, where only 9% is caused by differences in the number of couplings with respect to control values. This parameter has been reduced by 82% from pre-rehabilitation values, concluding that the reduction in the
A
CD
« 100% a "to "¡J5 ¡= 5 0 % "o
CD
8? 0
r\ control _
per N per + W ^ per ur\ control post N \j-W "post + "post
^Av _ \ / \ • j t ^
-7^V~W--t V N ^
/ \ I * — * — i . — '
* * ^
/ \1
J RT O F-RT F - 0 RT-LT RT-C LT-C F LT C F-LT F-C R T - 0 L T - 0 O-C
c
Delta Theta — A l p h a Beta 8 100%
c
B
"to ¡a CO
•E 5 0 %
"o
CD E
^ 0
c>
/\r+/\s\/^
y^^/C^^^^^^
V ' ^ ^
D control _ / ^ p \ w "per ^"perA "per
RT 0 F-RT F - 0 RT-LT RT-C LT-C F LT C F-LT F-C RT-0 LT-0 O-C
B
D
45
30
15
| Number | Frontal
i i
•
r\ control "postDelta
^^^
^
\
ñ c)
n
'riS
1 Number
• Weight
(F)|
•
n
rycontrol perAlpha
/ ^ ^ ^
.
[
j('W
\
1
\^ / 0 | " N
{
CU -•'
• Weight
Figure 4 Since distance-to-control depends on both number and weight of coupling, we can study which connectivity parameter is responsible for distance reduction. The responsible mechanism for recovery is defined as the parameter which has a greater reduction of its statistical values from pre- to post-rehabilitation, with a non-dominant contribution degree in D^t t r o l. (A) Percentage of contribution of the
number of connections over Dp°entrol (red line) and Dp°"frol (black line) for the delta spectral band. Both parameters equally contribute
(~50%) to D™ntrol. However, a non-equivalent behaviour is found in DE^{ml, i.e. depending on the connections in brain areas, one of the
parameters contribute more than the other over D^t t r o l. (B) For illustrative purposes, we show the detailed case of distance-to-control
reduction in local connection for the frontal area. Number and weight equally contribute to Dp°entrol, while post-rehabilitation connectivity
parameters change in a different way from ones pre-rehabilitation. Whereas the weight of coupling remains practically invariant, the number of connections reduces by 93%. We can conclude, in this case, that the reduction in the number of links within the frontal area is the responsible mechanism of recovery. (C) Percentage of contribution of the number of connections over D^tmi for all frequency bands and brain regions. For most brain areas both number and weight of connections increase (or decrease) simultaneously after traumatic brain injury. (D) Mechanism responsible for reduction in Dp°"frol in the delta and alpha spectral bands. C = central; F = frontal; LT = left temporal;
number of links in the frontal region is the responsible phenom-enon of distance-to-control reduction (example illustrated in Fig. 4A and B). Additionally, local connections in temporal lobes approached control values with reductions of distance-to-control of 68, 56 and 65% for right temporal, frontal-right temporal and frontal-left temporal, respectively. Dp°"frol in right temporal local
connections is caused mainly by the number of connections with a 70% contribution of this parameter over Dp°"fro1, whereas the
number of connections with the frontal regions is the one that causes a Dp°"fro1 of 65 and 82%, respectively. The responsible
mechanism of recovery for right temporal is the reduction in the coupling weight, as opposed to left and right temporal and frontal interactions for which the number of links is responsible. In the alpha spectral band, the number of links reduce the distance-to-control of local connections inside central (this param-eter reduces 45%) and right occipital and left temporal-occipital areas, with reductions of 59 and 47%, respectively. Weight is the responsible mechanism for local connections inside frontal (55% of reduction from pre- to post-rehabilitation values), while occipital-frontal and occipital-central connections decrease to 48 and 66%, respectively. Figure 4B summarizes the results for the delta and alpha bands. No statistically significant respon-sible mechanism was found in the theta frequency band. In the beta spectral Interval, we found a reduction of the weight of local connections In the central area (not shown).
Statistical test P-values for number and weight couplings are shown In Table 2.
Correlation between connectivity
parameters and neuropsychological
test score changes
Further post hoc analyses were performed to explore whether changes In the neuropsychological test scores of patients were related to changes In functional connectivity for all frequency bands. The correlations were computed for changes between pre- to post-rehabilitation connectivity parameters and the neuro-psychological results of each group. Subsequently, Pearson's cor-relation coefficients were calculated and i-tests were performed (P<0.001). For the delta band, significant negative correlations were found between the Verbal Fluency Test and weight connect-ivity changes between brain areas (Fig. 5A): frontal-right temporal (R = -0.69), central-left temporal (R = -0.72), central-right tem-poral (R = — 0.72), occlpital-rlght temtem-poral (R = — 0.71), frontal-occipital (R = — 0.71), right temporal (R = — 0.75). Thus the higher the reduction on delta band-based connectivity, the higher the improvement at post-rehabilitation. Alternatively, In the theta band, significant negative correlations were found between PCRS score and the number of neural connections (Fig. 5B): frontal-central (R = — 0.81), frontal-central In correlation with weight changes (R = — 0.7), central-left temporal (R = — 0.76), central-right temporal (R = — 0.76), occipital-central (R = — 0.70), occipital-central In correlation with weight changes (R= —0.7) and central (R = — 0.68). For the alpha band, significant positive correlations were found between the Perceptual Organization
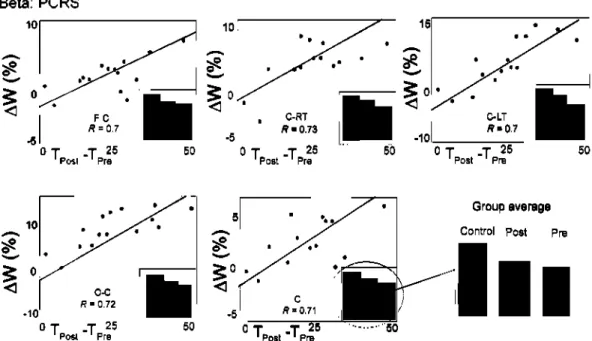
Index and the connectivity parameters In some brain areas (Fig. 6A): frontal-central number of connections (R = 0.65), central-left temporal number of connections (R = 0.81), central-right temporal number of connections (R = 0.68) and central connection weight (R = 0.71). The alpha band also showed significant positive correl-ations between the Working Memory Index (WAIS-III) and the number of connections In specific brain areas (Fig. 6B): frontal-left temporal (R = 0.82), right temporal (R = 0.7), frontal-occipital (R = 0.84), frontal-central (R = 0.72), frontal (R = 0.77) and central (R = 0.7). Finally, regarding the beta band, significant positive correlations were found between the PCRS score and brain area connectivity parameters (Fig. 7): frontal-central connec-tion weight (R = 0.74), central-left temporal connecconnec-tion weight (R = 0.79), central-left temporal number of connections (R = 0.74), central-right temporal connection weight (R = 0.74), occipital-central connection weight (R = 0.77), occipital-central number of connections (R = 0.77) and central connection weight (R = 0.72).
Topology discrimination
Table 2 P-values from Kruskal-Wallis statistical test, comparing Control and Pre-, Control and Post-; and Post- and Pre-connectivity parameters (number and weight of connections) per frequency band and areas coupled
Area F RT LT O C F-RT F-LT F-O F-C RT-LT RT-O RT-C LT-O LT-C O-C Parameter Number Weight Number Weight Number Weight Number Weight Number Weight Number Weight Number Weight Number Weight Number Weight Number Weight Number Weight Number Weight Number Weight Number Weight Number Weight
Delta (1-4) Hz Control-Pre 0.001 0.024 0.011 0.026 0.27 0.24 0.057 0.058 0.025 0.022 0.024 0.031 0.032 0.076 0.045 0.110 0.0006 0.0005 0.06 0.07 0.045 0.065 0.011 0.0006 0.064 0.07 0.008 0.008 0.01 0.01 Control-Post 0.45 0.37 0.58 0.09 0.81 0.45 0.45 0.13 0.17 0.61 0.25 0.79 0.69 0.59 0.67 0.71 0.68 0.82 0.71 0.81 0.6 0.85 0.47 0.49 0.75 0.61 0.62 0.42 0.68 0.18 Post-Pre 0.03 0.004 0.045 0.071 0.16 0.21 0.008 0.08 0.04 0.09 0.43 0.018 0.08 0.042 0.053 0.089 0.019 0.0057 0.009 0.025 0.027 0.011 0.043 0.011 0.016 0.001 0.029 0.051 0.043 0.011
Theta (4-8) Hz Control-Pre 0.47 0.003 0.16 0.003 0.17 0.12 0.21 0.005 0.27 0.21 0.55 0.81 0.36 0.35 0.36 0.86 0.38 0.25 0.10 0.53 0.22 0.51 0.08 0.06 0.001 0.23 0.05 0.21 0.25 0.19 Control-Post 0.83 0.76 0.43 0.36 0.66 0.43 0.71 0.32 0.35 0.68 0.17 0.91 0.24 0.32 0.07 0.6 0.18 0.16 0.29 0.53 0.37 0.19 0.47 0.5 0.35 0.33 0.25 0.71 0.25 0.44 Post-Pre 0.69 0.002 0.53 0.001 0.0005 0.35 0.39 0.28 0.17 0.16 0.23 0.78 0.4 0.43 0.015 0.55 0.89 0.89 0.08 0.65 0.32 0.22 0.25 0.18 0.002 0.52 0.12 0.02 0.09 0.23
Alpha (8-12) Hz Control-Pre 0.23 0.13 0.023 0.12 0.013 0.012 0.07 0.014 0.24 0.28 0.1 0.019 0.11 0.08 0.047 0.051 0.12 0.25 0.041 0.034 0.047 0.051 0.11 0.16 0.017 0.03 0.15 0.23 0.12 0.21 Control-Post 0.5 0.56 0.51 0.46 0.33 0.41 0.25 0.68 0.64 0.79 0.61 0.4 0.68 0.75 0.41 0.57 0.32 0.64 0.31 0.29 0.2 0.16 0.57 0.51 0.29 0.25 0.54 0.54 0.51 0.57 Post-Pre 0.02 0.007 0.005 0.13 0.022 0.009 0.27 0.005 0.33 0.27 0.15 0.055 0.11 0.12 0.26 0.06 0.31 0.41 0.12 0.1 0.02 0.53 0.14 0.19 0.041 0.11 0.27 0.43 0.27 0.31
Beta (12-30) Hz Control-Pre 0.096 0.27 0.21 0.031 0.068 0.17 0.06 0.023 0.25 0.44 0.22 0.27 0.004 0.01 0.07 0.004 0.68 0.33 0.11 0.12 0.01 0.12 0.52 0.35 0.04 0.08 0.35 0.08 0.55 0.61 Control-Post 0.6 0.47 0.35 0.11 0.13 0.32 0.28 0.28 0.61 0.35 0.47 0.59 0.38 0.29 0.36 0.16 0.44 0.79 0.19 0.09 0.58 0.28 0.57 0.85 0.17 0.21 0.29 0.66 0.77 0.64 Post-Pre 0.12 0.12 0.46 0.1 0.25 0.52 0.2 0.15 0.04 0.12 0.57 0.52 0.31 0.03 0.44 0.03 0.74 0.64 0.005 0.55 0.1 0.46 0.22 0.71 0.04 0.05 0.32 0.56 0.66 0.71
DiSCUSSIOri a s a ct'v'ty fr o m age-matched control subjects, it was possible to
Alpha
Perceptual organization
0 TB„ „ , - TD 20 40 o T - T 20 40 0 T _T 20 Post Pre l P o s t l pre l P o s t l P r e Working memory
40 0 T - T 20 1 Post ' Pre
40
0 T -T 10
1 D n o l ' D m
r
1IU
20 0 j _y 10
1 Dnot ' D r i
Group average
Figure 6 Correlations between changes in the number of links (AN — A/Post — A/Pre) and changes in neuropsychological test scores
(Tpost — Tpre). Changes in the number of links in the alpha spectral band-based connectivity patterns correlate with changes in the
Perceptual Organization Index (POI, upper panels) and the Working Memory Index (WMI, lower panels) of the WAIS-III. Bar diagrams show that in the alpha spectral band a decrease in the number of couplings is noticed in the pre-rehabilitation connectivity pattern, whereas the post-rehabilitation connectivity parameters approach controls. This progressive increase in the number of links from pre-rehabilitation to control reference agrees with the positive correlation found. C = central; F = frontal; LT = left temporal; O = occipital; RT = right temporal.
stages revealed a loss of local and long-distance slow band-based connectivity and an increase in higher spectral band-based connections. The reduction of delta-band-based connections and the increment of those based in the alpha band correlates with Verbal Fluency Test scores, as well as with the Perceptual Organization and Working Memory Indexes of the WAIS-III, respectively. Additionally, changes on connectivity values based on theta and beta bands correlate with the PCRS, which reflects a general improvement in a patient's ability to carry out everyday activities. Finally, network architectures in patients were checked to see if they were distinguishable from control topology by means of a linear discriminant analysis, and showed a greater similarity with respect to control topology in post-rehabilitation patients than those pre-rehabilitation. To our knowledge, the current study is the first to provide some evidence about the capability of non-invasive connectivity meas-ures to study the functionality and recovery of brain tissue in patients with traumatic brain injury compared with healthy subjects, showing that changes in functional connectivity at the neurophysiological level are related to changes observed at the behavioural level.
Pre-post comparison at the
neuropsychological level
Beta: PCRS
10
I
o
-5
10
1 °
-10
FC fl = 0.7 0 J . J 25
'Post ' Pre
* ' • * / *
o-c
R = 0.72
°T -T
25Post Pre
h
50
50 10
g
5 o
<
-5
5
g
<
-5
J** *
É ^ ** *
o T -T 25
Post ' Pre
W ^
ft = 0.71 ^ H I T _T 25
1 Post • Pre
•
50
*
5C 15
o ^
-10
* *
C-LT
» jS
•
k
o T _T 2SPost ' Pre
Group average Control Post Pre
III
50
Figure 7 Correlations between changes in connectivity parameters (AN — A/Post — A/Pre and A W = Wpost — WPre) and changes in PCRS
scores (Tpost — 7pre). Bar diagrams show that in the beta spectral band an increase in the number of couplings is noticed for connectivity
patterns pre-rehabilitation, whereas such connectivity parameters post-rehabilitation approach the control groups. This progressive increase in the weight of links from pre-rehabilitation to the control reference agrees with the positive correlation found. C = central; F = frontal; LT = left temporal; O = occipital; RT= right temporal.
Delta Theta Alpha Beta
"Pie " " C o n t r o l ' ' P r e P o s t ' Post ^ C o n t r o l I Pre C o n t r o l ' Pri
*- F
a,,F
D, •*- F. , ,
? o s i ' Post Control
Figure 8 Grey lines connecting brain areas show that we can define a 'recovery phenomenon'; where pre-rehabilitation Fisher values are distinguishable from post-rehabilitation and control values, but post-rehabilitation Fisher values are indistinguishable from control values (i.e. Fpre =¿ ^control, fpre # fpost. fpost = ^control)- Black lines connecting brain areas show that we can define an 'incomplete recovery
phenomenon', where pre-rehabilitation Fisher values are distinguishable from post-rehabilitation and control values, but post-rehabilitation Fisher values are also distinguishable from control values (i.e. FPre =¿ ^control, FfK # fpost. fpost # ^control)-R = right; L = left.
showing that patients improved in several cognitive domains such as attention, memory and executive functions in agreement with other previous reports (Cicerone et al., 2005; Rholing et al., 2009).
Pre-post comparison at the
neurophysiological level
Whether changes in neuropsychological scores are related or not to changes at the physiological level has been a matter of debate. In this work, we tried to describe and compare changes at the physiological level and at the neuropsychological level by means of
post-rehabilitation indicates recovery of the connectivity profiles related with this frequency band. The pathological increase of slow wave connectivity is widely documented in literature, for example in tumours and stroke (Bosma et al., 2008, 2009), as well as in traumatic brain injury (Lewine et al., 1999, 2007). Concerning connectivity, Bosma et al. (2008, 2009) recently demonstrated that synchronization in the theta band (as measured by synchronization likelihood and phase lag index) is significantly higher in patients with low-grade glioma than in matched healthy controls and in patients with brain tumour (Bartolomei et al., 2006a, b; Douw et al., 2008). Thus, from our results, it seems that the increased delta band coherence in patients with traumatic brain injury reflects a generalized physiological malfunctioning that diminishes with cognitive recovery. In fact, the loss of mld-(frontotemporal) and long-distance (frontooccipital) frontal con-nectivity is correlated negatively with the improvement on Verbal Fluency Test scores. Those patients with traumatic brain injury that showed greater improvement in verbal fluency were those that showed greater loss of delta band-based functional connectivity. A pathological increase of theta band functional con-nectivity compared with healthy controls has also been reported in other patient groups, such as those with Alzheimer's (Stam et al., 2006) and depressed (Fingelkurts et al., 2007) and autistic adults (Murias et al., 2007). The nature of patients' brain lesions in all of those studies varied greatly, indicating that there seems to be a very robust effect of brain injury on theta band activity. The de-crease in theta functional connectivity in patients post-rehabilitation is related to the improvement of cognitive func-tioning, as it correlates with PCRS scores. These results demon-strate that traumatic brain injury induces changes in functional connectivity that may contribute to explaining the cognitive def-icits commonly seen in this pathology (Tucha et al., 2000).
Alpha oscillations have been associated with working memory (for review see Palva and Palva, 2007) and attentional functions (Gootjes et al., 2006). Our results show that most of the connec-tions in this band sustained statistically significant changes post-rehabilitation, based on the number of connections. Additionally, local frontal and temporal as well as mid- and long-distance frontocentral and frontooccipital connections chan-ged their weight. Furthermore, when connectivity profiles were compared with the control group, patients with traumatic brain injury showed greater differences at the pre-rehabilitation stage, indicating a lower number and weight of their connections. However, post-rehabilitation patients showed a clear improve-ment, having a profile closer to that demonstrated by the control group. Alterations in frontoparietal synchrony could be an import-ant factor contributing to working memory and executive function processes, since in normal subjects working memory or direct at-tentional tasks involve transient synchronization between these two regions (von Stein and Sarnthein, 2000; Halgren et al., 2002). Our data showed a relationship between alpha band-based connections and perceptual and working memory functions. Thus, those patients with greater improvements in the number and weight of their connections also showed increased scores in the Working Memory Index and Perceptual Organization Index of the WAIS-lll. All these data could be Interpreted under the model of 'global neuronal workspace' (Dehaene et al., 1998). This model
emphasizes the Importance of the relationship between sensory regions and frontoposterlor networks in Information processing. Perceptual organization Involves both sensory and working memory abilities, Increasing the necessity of Information Integra-tion within the brain. AddiIntegra-tionally, Palva and Palva (2007) propose that the alpha band Is responsible for the synchronization of work-ing memory networks. Based on this framework, Improvements In weight and number of alpha band connections between fronto-posterlor regions could be a physiological sign of cognitive recovery.
Regarding the beta band, patients showed few changes In the number of mid-distance connections (between right temporal and occipital and central regions) when pre- and post-rehabilitation stages were compared. However, comparison with the control group revealed that the local frontal, right temporal and long-distance frontooccipital, as well as right temporal-occipital, differ-ences that were found at pre-rehabllltation were released after rehabilitation. Again, these changes In the beta band could repre-sent a physiological effect of the rehabilitation process. The correlation found between PCRS score and the decrease-Increase in connectivity In the theta and beta frequency bands, respective-ly, Is of great interest. The PCRS reflects a patient's current ability to adapt to dally living activities. PCRS scores Improved after the rehabilitation process, because patient and relative ratings became closer. We found that those patients who decreased theta and increased beta band connectivity between anterior (frontal and central) and posterior regions (temporal lobes and occipital region), respectively, were those that showed greater Improve-ments In their PCRS values. Thus, It seems that changes in antero-posterior connectivity Improve their ability to adapt to dally living activities.
Although several changes were found In the between-group comparison for post-rehabilitation patients and controls, some of the differences found pre-rehabllltation remained stable across time. While statistical differences were lost for the delta and theta bands, some differences In the alpha and beta bands were not modified after the rehabilitation process. Those differences that remain stable after rehabilitation are local and long-distance alpha and beta connections related with the left temporal lobe (left temporal-right temporal, left temporal-frontal and left tem-poral-occipital). It Is of interest to highlight that those cognitive scores that better correlate with patterns of connectivity were also those related with vlsuospatial and perceptual functions normally related to the right hemisphere. In fact, while at pre-rehabllltation both verbal and performance IQ were statistically different from the control group, after treatment only verbal IQ still showed differences between patients and controls. This could explain why left temporal lobe connectivity parameters still Indicated statistical differences between patients and controls after rehabilitation.
Mathematical and experimental
considerations
sources. Nearby MEG sensors have a high probability of capturing activity from common sources, and therefore show spurious strong correlation. Several attempts have been proposed to overcome this problem. The first approach is to study functional connectivity in source space. However, to date there is no reliable way to choose the proper model to solve the inverse problem (Hadjipapas et al., 2005; Stam et al., 2009). Another approach is the use of measures of correlation that are not sensitive to volume conduction, such as the phase lag index (Stam et al., 2007) or the imaginary part of the coherency (Nolte et al., 2004). However, we consider that volume conduction effects could not explain the group differences in the connectivity measures that we found. Our results agree with previous studies of brain injury. In this work we show that slow wave-based connectivity increases after a traumatic injury and decreases after recovery (even restoring control values). The pathological increase of slow wave-based connectivity and the increase of higher band-based connectivity have been reported in studies of tumours (Bartolomei et al., 2006a, b; Bosma et al., 2009). Moreover, in this study the postoperative decrease of theta synchronization, using phase lag index, could be interpreted as a tendency towards a more 'normal' state of the theta band after tumour resection, an idea corroborated by the decrease of seizure frequency. On the other hand, Bosma et al. (2008) reported an increase of theta band functional connectivity in patients com-pared with controls, using synchronization likelihood. This agree-ment, even using different measures of functional connectivity, is interpreted by these authors as a robustness of the results (Bosma et al., 2008). In a recent work by Stam et al. (2009), the authors compare phase lag index results with others obtained with several linear and non-linear measures, displaying a few differences but suggesting: 'Since the phase lag index results are largely in line with the previous studies we can conclude that the influence of volume conduction may have been smaller than has sometimes been suggested'. In order to check whether our results are contaminated by a common source or not, we have calculated the functional connectivity and hence the distance-to-control for pre- and post-rehabilitation and control subjects in delta band using phase lag index. As Supplementary Fig. 1 shows, the distance-to-control (in this case, only coupling strengths are taken into account) is higher pre- than post-rehabilitation. Thus, a recovery (in terms of approach to control) is also observed with phase lag index as well as with wavelet coherence. Therefore, we consider that we can be confident in our results, the pathological increase of delta band-based connectivity and the approach to control values observed in patients post-rehabilitation. Moreover, in this work we have adopted an alternative approach, analysing functional connectivity in sensor space and then grouping the sensor pairs in local and long-distance couplings. We spatially averaged sensors in five regions (frontal, right temporal, left tem-poral, central and occipital). Wavelet coherence could be influ-enced by volume conduction; however, it is less likely that such effect can explain group differences in functional connectivity be-tween patients with traumatic brain injury, both pre- and post-rehabilitation, and controls. Furthermore, our results showed changes not only in local but in long-distance connections, which are less likely to be due to volume conduction. Consequently, a general change in these regions must occur to be detected as a
group difference. Another technical limitation could be due to the influence of power on the connectivity changes. Our results showed a generalized change in the connectivity pattern in all frequency bands. However, no significant correlation has been found between power and connectivity changes in all frequency bands (Supplementary Fig. 2 and Supplementary Table 1), sup-porting the idea that the connectivity changes reported in this work are not affected by spectral changes. This absence of cor-relation could also be an argument to support that a common source does not alter the functional connectivity, since a common source could be expected to alter signal power. On the other hand, because a direct relation between the position of the sensor and the immediate brain region underneath cannot be fully assumed, we should take into account that the labels of brain regions used to describe profiles of connectivity could be subjected to some spatial deviations. However, to limit this effect we have clustered the signals in the sensor space into five sensor groups.
The interpretation of our results could be limited because of the lack of a patient group that did not receive neuropsychological rehabilitation. In order to evaluate a general effect of rehabilita-tion, patients with traumatic brain injury should be included that do not receive rehabilitation and they should be scanned twice, with a similar interval to those patients that receive treatment. This is necessary to control for spontaneous recovery phenomena. In this case it would be very important to ensure that patients did not receive any kind of rehabilitation (i.e. motor, language, memory) for about 9-14 months, in order to act as a true control group. However, according to the Declaration of Helsinki, a treatment that has already demonstrated benefits for a particular population of patients should not be denied purely for experimental reasons. Taking into account this limitation, the current study provides new evidence for the neurophysiological mechanisms underlying the process of neuronal plasticity after brain injury but does not pre-tend to be a measure (or test) of effectiveness of rehabilitation. Future studies should evaluate whether: (i) these changes mea-sured during resting state are reproducible during cognitive task performance; (ii) patients with traumatic brain injury and stroke show similar profiles of connectivity recovery or not; (¡ii) functional connectivity measures are capable of distinguishing between dif-ferential neuropsychological and functional outcomes; and (¡v) pa-tients at different ages show a differential pattern of functional connectivity recovery. In this study we did not find correlation between connectivity changes and age (Supplementary Fig. 3). This result may be due to a lack of enough variability in age to find a statistical correlation.
catches in more detail the interplay between segregation and in-tegration mechanisms could be graph theory-based analysis (Bullmore and Sporns, 2 0 0 9 ; Nakamura et al., 2 0 0 9 , Stam, 2010). Future studies should evaluate w h e t h e r graph theory ana-lysis could improve the understanding of the mechanisms of neural plasticity induced by the rehabilitation process. Some c o m p u t a -tional models study the effect of damage and posterior recovery of brain network characteristics after injury (Honey and Sporns, 2 0 0 8 , Rubinov et al., 2 0 0 9 A l s t o t t et al., 2 0 0 9 ; Butz et al., 2009).These models agree t h a t the area producing the largest and most widespread injury-effects on functional interactions are those being highly connected. A l s t o t t and colleagues (2009) demonstrated t h a t the target attack over the frontal lobe induces a severe disruption o f the network. In the current study the ma-jority of patients showed impairment over the frontal lobe. Thus the lesion o n this brain region influences the difference between controls and patients pre-rehabilitation; and furthermore changes in the pattern of connectivity o f the frontal lobe and other regions correlate w i t h w o r k i n g memory score changes in the alpha band. Thus, the i m p r o v e m e n t o f the connectivity in this region correlates w i t h the i m p r o v e m e n t in cognitive changes.
The literature shows several examples of pathological increase and decrease of functional connectivity, w h i c h provide evidence for the idea t h a t a balance in the level o f synchronization in healthy controls is required for optimal brain f u n c t i o n i n g . This study supports several ideas: (i) t h a t reorganization o f brain net-works affects and even restores healthy functional connectivity patterns in patients w i t h traumatic brain injury; (ii) t h a t the re-organization of a n e t w o r k can be executed by means of different mechanisms, increasing (or decreasing, w h e n needed) the number or w e i g h t o f its links, and t h a t these mechanisms are responsible for composing a n e t w o r k or organizing its t o p o l o g y ; and (¡ii) w e provide evidence t h a t changes in functional connectivity at the neurophysiological level are related to changes observed at the behavioural level. These ideas have implications f o r the under-standing of brain physiology as well as i m p o r t a n t potential clinical applications.
Acknowledgements
The authors are grateful to Dr J. A. Villacorta and S. M o r a t t i for helpful discussions and S. Aurtenetxe, J. Garcia-Pacios, A . Nevado and D. del Rio for their generous help. The authors w o u l d like to thank Dr Juan M a n u e l M u ñ o z Céspedes, w h o lead this study. His ideas and personality will be always w i t h us.
Funding
MADRI.B ( C A M i + d + l project), O b r a Social CajaMadrid, MAPFRE 2 0 0 9 and IMSERSO ( 0 7 - 2 0 0 8 ) .
Supplementary material
Supplementary material is available at Brain online.
References
Aertsen A M , Gerstein GL, Habib MK, Palm G. Dynamics of neuronal firing correlation: modulation of "effective connectivity". J Neurophysiol 1989; 6 1 : 900-17.
Alstott J, Breakspear M , Hagmann P, Cammoun L, Sporns O. Modeling the impact of lesions in the human brain. PLoS Comput Biol 2009; 5: e1000408.
Bartolomei F, Bosma I, Klein M , Baayen JC, Reijneveld JC, Postma TJ, et al. How do brain tumors alter functional connec-tivity? A magnetoencephalography study. Ann Neurol 2006a; 59: 128-38.
Bartolomei F, Bosma I, Klein M , Baayen JC, Reijneveld JC, Postma TJ, et al. Disturbed functional connectivity in brain tumour patients: evaluation by graph analysis of synchronization matrices. Clin Neurophysiol 2006b; 117: 2039-49.
Beason-Held LL, Kraut M A , Resnick SM. Stability of default-mode net-work activity in the aging brain. Brain Imaging Behav 2009; 3: 123-31.
Bennett EL, Diamond M C , Krech D, Rosenzweig MR. Chemical and anatomical plasticity of brain. Science 1964; 146: 10-19.
Bosma I, Douw L, Bartolomei F, Heimans JJ, van Dijk , Postma TJ, et al. Synchronizaed brain activity and neurocognitive function in patients with low-grade glioma: a magnetoencephalography study. Neuro Oncol 2008; 10: 734-44.
Bosma I, Reijneveld JC, Klein M , Douw L, van Dijk BW, Heimans JJ, et al. Disturbed functional brain networks and neurocognitive function in low-grade glioma patients: a graph theoretical analysis of resting-state MEG. Nonlinear Biomed Phys 2009; 1: 3-9.
Bressler S. Understanding cognition through large-scale cortical networks. Curr Dir Psychol Sci 2002; 1 1 : 5 8 - 6 1 .
Brookes MJ, Gibson A M , Hall SD, Furlong PL, Barnes GR, Hillebrand A, et al. GLM-beamformer method demonstrates stationary field, alpha ERD and gamma ERS co-localisation with fMRI BOLD response in visual cortex. Neuroimage 2005; 26: 302-8.
Bullmore E, Sporns O. Complex brain networks: graph theoretical analysis of structural and functional systems. Nature Rev Neurosci 2009; 10: 186-98.
Butz M , van Ooyen A, Worgotter F. A model for cortical rewiring following deafferentation and foca stroke. Front Comput Neurosci 2009; 3: 10-2.
Campo P, Poch C, Parmentier FBR, Moratti S, Elsley JV, Castellanos NP, et al. Oscillatory activity in prefrontal and posterior regions during implicit letter-location binding. Neuroimage 2010; 49: 2807-15.
Cao C, Slobounov S. Alteration of cortical functional connectivity as a result of traumatic brain injury revealed by graph theory, ICA, and sLORETA analyses of EEG signals. IEEE Trans Neural Syst Rehabil Eng 2010; 18: 11-9.
Cicerone KD, Dahlberg C, Kalmar K, Langenbahn D M , Malee JF, Bergquist TF, et al. Evidence-based cognitive rehabilitation: recommen-dations for clinical practice. A. Physical Med Rehab 2000; 8 1 : 1596-615.
Cicerone KD, Dahlberg C, Malee JF, Langenbahn D M , Felicetti T, Kneipp S, et al. Evidence-based cognitive rehabilitation: Updated review of the literature from 1998 through 2002. A. Physical Med Rehab 2005; 86: 1681-92.
Cover KS, Stam CJ, van Dijk BW. Detection of very high correlation in the alpha band between temporal regions of the human brain using MEG. Neuroimage 2004; 22: 1432-7.
Cover KS, Vrenken H, Geurts JJ, van Oosten BW, Jelles B, Polman CH, et al. Multiple sclerosis patients show a highly significant decrease in alpha band interhemispheric synchronization measured using MEG. Neuroimage 2006; 29: 783-8.