Influence of ultrasound speckle tracking strategies for motion and
strain estimation
Ariel H. Curíale , Gonzalo Vegas-Sánchez-Ferrero , Santiago Aja-Fernández
A B S T R A C T
Speckle Tracking is one of the most prominent techniques used to estimate the regional movement of the heart based on ultrasound acquisitions. Many different approaches have been proposed, proving their suitability to obtain quantitative and qualitative information regarding myocardial deformation, motion and function assessment. New proposals to improve the basic algorithm usually focus on one of these three steps: (1) the similarity measure between images and the speckle model; (2) the transformation model, i.e. the type of motion considered between images; (3) the optimization strategies, such as the use of different optimization techniques in the transformation step or the inclusion of structural information. While many contributions have shown their good performance independently, it is not always clear how they perform when integrated in a whole pipeline. Every step will have a degree of influence over the following and hence over the final result. Thus, a Speckle Tracking pipeline must be analyzed as a whole when developing novel methods, since improvements in a particular step might be undermined by the choices taken in further steps. This work presents two main contributions: (1) We provide a complete analysis of the influence of the different steps in a Speckle Tracking pipeline over the motion and strain estimation accuracy. (2) The study proposes a methodology for the analysis of Speckle Tracking systems specifically designed to provide an easy and systematic way to include other strategies. We close the analysis with some conclusions and recommendations that can be used as an orientation of the degree of influence of the models for speckle, the transformation models, interpolation schemes and optimization strategies over the estimation of motion features. They can be further use to evaluate and design new strategy into a Speckle Tracking system.
1. Introduction
The analysis of the regional motion of the heart has proved to be of preeminent importance for the study of cardiac abnor-mal behavior. It currently plays an inarguable role in treatment and diagnosis of several pathologies, such as mitral regurgita-tion (Helmcke et al., 1987; Bargiggia et al., 1991), ischemia (Voigt et al., 2003), dyssynchrony (Suffoletto et al., 2006), myocardial quantification (McDicken et al., 1992; Amundsen et al., 2006; Nesser et al., 2009; Geyer et al., 2010) and diastolic dysfunc-tion (Ommen et al., 2000). The estimation of the features that
model regional motion can be done using different imaging modal-ities, dominant among them those based on ultrasound (US) acqui-sitions. Due to low cost and real time acquisition, echocardiogra-phy has become a widely used tool for motion and strain estima-tion, either using Doppler or non-Doppler techniques.
The term Speckle Tracking (ST) refers to all those techniques that analyze motion by tracking the intensity or the interference patterns of the US data, known as speckle, along the temporal se-quences. In the particular case when the motion is analyzed by tracking the speckle from the RF signal, these methods are referred to as Strain Imaging (O'Donnell et al., 1994; Konofagou and Ophir, 1998; Lopata et al., 2011). In what follows we will use the term ST in a global sense to denote all those methods that estimate the motion by tracking the speckle pattern in B-mode US acquisitions.
The phenomenon of the speckle can be explained by the physics of the problem of wave transmission in a tissue in US: it is produced by the reflection of the transmitted coherent ultrasound waves at fixed frequencies for different tissues. Since this pattern remains stable under the same acquisition conditions and exhibits an inherent relationship with the tissue structure, it can be tracked to estimate the motion of the tissue (Trahey et al., 1986; Burck-hardt, 1978).
Many different approaches to ST can be found in the litera-ture, where they have extensively proved to be powerful tools in order to obtain quantitative and qualitative information regarding myocardial deformation, motion and function assessment (Notomi et al., 2005; Crosby et al., 2005; Suffoletto et al., 2006). The clini-cal relevance of the motion estimation in US B-mode images has motivated the community to improve the original ST technique proposed in Robinson et al. (1982) and Trahey et al. (1988) by more complex approaches. New contributions modify the original techniques in different ways, such as the statistical modeling of speckle, using more complex registration algorithms or applying different optimization algorithms for the ST estimation. It seems clear that modifications in different steps of the process will have a different impact over the results. In addition, the influence of cer-tain methods may obliterate the complexity of previous steps. For instance, the use of certain registration algorithms could make the process highly invariant to the similarity measure used. Thus, it becomes necessary to identify the relevant relations between the different components involved in a ST method in order to clarify which component really improves the accuracy of the estimation of motion and strain, and which ones become redundant. That is, precisely, the aim and motivation behind this work.
Some previous studies about the performance of ST methods can be found in the literature. One of the first ones was carried out by Bohs and Trahey (1991), where authors showed that a clas-sical block matching registration together with the sum of the ab-solute differences -a quite simple similarity measure- could be used instead of the correlation, originally proposed by Robinson et al. (1982), achieving similar tracking results and better per-formance. Friemel et al. (1995) extended this study to include the non-normalized cross-correlation. Moreover, they showed that there was no statistically significant difference between the nor-malized cross-correlation and the sum of absolute differences at different signal to noise ratios.
In contrast to these early performance studies, in this work we propose a more global and complete approach. Instead of study-ing the influence of a particular improvement, we will analyze the system as a whole, similarly to what was done in De Craene et al. (2013) and Curíale et al. (2015) for different ST methods. How-ever, in the proposed study, we are taking into account the rela-tion between the steps and different choices taken to implement a ST method. The starting point is a prior identification of the basic parts of a ST method. The influence of the different techniques that can be used in each of these parts will be quantitatively analyzed. The techniques considered for the study are the following:
1. Different models for US data representation, some of them as-suming an underlying statistical model for the speckle.
2. Different registration philosophies, including the classic block matching and a demons approach (Thirion, 1998).
3. Different interpolation schemes such as nearest neighbor, linear and cubic.
4. The use of structural information into the deformation model by using the normalized convolution (Knutsson and Westin, 1993) and a maximum likelihood approach such as the one pro-posed in Curíale et al. (2015).
5. The use of different optimization techniques, such as coarse-to-fine refinement or an efficient second-order minimization (ESM).
These techniques will not be independently analyzed since the influence of one over the other must also be taken into account and may provide useful insights for the development of novel ST methods.
This work presents two main contributions to the ST field. First, it provides a complete study to identify which are the components of a ST method with greater influence and impact over the mo-tion and strain estimamo-tion accuracy. The second contribumo-tion is the methodology for the analysis of a ST system designed to provide an easy and systematic way to include other ST philosophies. The con-clusions and recommendations obtained in this work are intended to serve as a reference about what can be expected when improv-ing or introducimprov-ing a new strategy into a ST system. We believe that new methodologies proposed for ST should not be analyzed isolatedly anymore, but in a holistic way considering the complete pipeline. Great improvements in certain steps of a ST method can be overpassed or undermined by the choices taken in further steps as we will show in the results of this work.
2. Background
Tracking the speckle patterns in US B-mode images was first re-ported by Robinson et al. (1982), where the authors introduced a method for determining the velocity of propagation of ultrasound in tissue by comparing individuals sectors from different trans-ducer positions using the normalized cross-correlation. Inspired by this work, Trahey et al. (1988); 1987) proposed a novel technique of velocity imaging based upon measuring the direction and mag-nitude of local blood speckle pattern displacement in consecutive 2D B-mode images for blood flow detection. These displacements were estimated by using the most conceptually straightforward method, a block matching algorithm using the normalized cross-correlation as the similarity measure.
Some other metrics were proposed following the same block-matching methodology. Such is the case of Strintzis and Kokkini-dis (1997), where a maximum likelihood (ML) methodology was used to provide a suitable metric for US images based on a multiplicative Rayleigh characterization. Strintzis and Kokkinidis (1997) showed that the classical ST method was improved when considering more adequate metrics. Likewise, Cohen and Dinstein (2002) extended the metric by including the relation between the multiplicative Rayleigh characterizations of consecutive frames, which resulted in a more accurate ST method. Those incremen-tal improvements evidenced that a more detailed description of the speckle statistics provides more accurate ST methods when the block-matching methodology is adopted.
Fixed Image
Moving Image
Similarity measure
h-l ° s,
Initial Transformation
h-
5
Interpolation
Transformation Model Si
Transformation Regularization
R e g ( s ¿ ) |
Si+l
Sim(I
t,I
t-i o Si
Optimizer
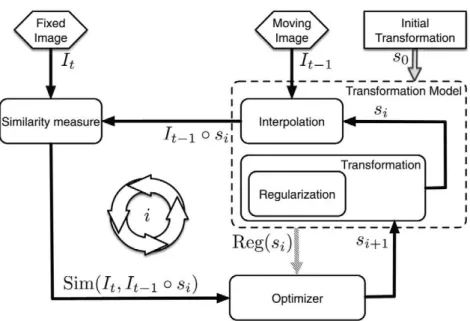
Fig. 1. Diagram of typical algorithms used in the intensity based registration methodology.
Deformation (FFD) method (Myronenko et al., 2009; Yue et al., 2009; De Craene et al., 2012; Curíale et al., 2013a), a diffeomor-phic demons scheme (Curíale et al., 2015), or to introduce the monogenic phase of the B-mode image into an optical flow ap-proach (Knutsson et al., 2005; Alessandrini et al., 2013; Tautz et al., 2013).
So, according to the proposals of the state of the art for ST, one can easily distinguish three necessary and interrelated parts within a generic ST method
1. Similarity measure: Necessary to establish the correspondence between images along the time sequence and may take advan-tage of speckle characterization in US images.
2. Transformation model: It specifies the type of motion considered between images and the way the similarity measure is intro-duced into the motion estimation.
3. Optimization strategy: It defines a strategy for optimizing the transformation model according to the similarity model.
These parts can be graphically depicted showing the generic flowchart of a ST method (Fig. 1). The diagram shows the three interrelated parts of an ST method as blocks whose inputs are the fixed image ¡t, the moving image /t_ j , and an initial
transforma-tion s0 that maps them. The initial transformation would act over
the moving image by considering interpolation and regularization in order to ensure that every location in the moving image corre-sponds to a certain location in the fixed image. The performance of the resulting transformation is then measured by a similarity measure that can make use of the statistical characterization of speckle in US images. Finally, the optimizer tries to provide the best transformation according to the similarity measure. This pro-cess is commonly done in an iterative way until some stop rule is reached, though some approaches have just one iteration.
In what follows, the state of the art methods will be analyzed according to these parts with a special emphasis on the hypotheses assumed in their definition. A summary of the methods considered in this study and the techniques applied in each part of the ST methodology are shown in Table 1.
2.1. Similarity measure
The similarity measure is responsible for establishing a corre-spondence of similitude between two or more images; in the case
of ST, images from a temporal sequence of an US acquisition. These similarity measures make use of the intensity or the speckle pat-tern, and some usually take advantage of the statistical description of speckle in US images. ST methods assume that the highest sim-ilarity is given when the optimal transformation is found.
During the past decades, different similarity measures have been proposed for ST, among them, the more extended are: the normalized cross-correlation (Robinson et al., 1982; Trahey et al., 1988; 1987); the sum of absolute differences (Bohs and Trahey, 1991; Bohs et al., 2000); the non-normalized cross-correlation (Friemel et al., 1995); the sum of squared differ-ences (Yeung et al., 1998a; 1998b; De Craene et al., 2012; Curíale et al., 2013b; Heyde et al., 2013a; 2013b; Piella et al., 2013; Som-phone et al., 2013); the mutual information (Elen et al., 2008) and the monogenic phase (Knutsson et al., 2005; Alessandrini et al., 2013; Tautz et al., 2013).
On the other hand, some authors proposed the use of statis-tical models to provide a better characterization of speckle, such as Gaussian (Cohen and Dinstein, 2002), Rayleigh (Strintzis and Kokkinidis, 1997; Cohen and Dinstein, 2002; Yue et al., 2009),
Gamma (Curíale et al., 2013a), bivariate Nakagami (Myronenko et al., 2009) and bivariate Generalized Gamma (Curíale et al., 2015).
Note that those similarity measures based on a statistical char-acterization of speckle are assuming that the deformation through time does not change the statistics of speckle, though the intensity values of the image may vary. Thus, the measures are intended to provide the most likely transformations according to the statisti-cal characterization of speckle. So, the underlying hypothesis in the definition of these metrics is "the statistical characterization provides
a better description of speckle that improves ST".
Besides, the metrics proposed by Myronenko et al. (2009) and
Curíale et al. (2015) also considered a temporal correlation within the statistical model that accounts for correlation between speckle patterns throughout the deformation. These works assume that
"temporal correlation leads to a better temporal tracking when sta-tistical models of speckle are applied".
Table 1
Overview of the most representative speckle tracking techniques and a few recent approaches. CC: Cross-Correlation, NCC: Non-normalized Cross-Correlation: SAD: Sum of absolute differences, SSD: sum of squared differences, SI: Structural Information, MP: Monogenic Phase, GG: Generalized Gamma, FFD: Free Form Deformation with B-Splines, BS: B-Splines, OF: Optical Flow, BM: Block Matching, NC: Normalized convolution. -: Not specified.
Author
Similarity model
Non-speckle model Speckle model
Transformation model
Parametric Non-parametric NC Temporal continuity
Optimization model
Non-iterative Iterative Multi-resolution
Robinson et al. (1982) Trahey et al. (1988): 1987) Bohs and Trahey (1991) Friemel et al. (1995) Strintzis and Kokkinidis (1997) Yeung et al. (1998a) Yeung et al. (1998b) Bohs et al. (2000) Cohen and Dinstein (2002) Knutsson et al. (2005) Myronenko et al. (2007) Yue et al. (2009) Myronenko et al. (2009) De Craene et al. (2012) Curiale et al. (2013a) Curiale et al. (2013b) Heyde et al. (2013b) Tautz et al. (2013) Heyde et al. (2013a) Somphone et al. (2013) Alessandrini et al. (2013) Piella et al. (2013) Curiale et al. (2015)
CC CC SAD
NCC / CC / SAD X
SSD SSD SAD X MP SSD + SI X X SSD X SSD SSD MP SSD SSD MP SSD X
X X X X
Rayleigh
X X X
Rayleigh
X X
Rayleigh
Bivariate Nakagami
X
Gamma
X X X X X X
Rayleigh Bivariate GG
X X X X X X X X X X
FFD FFD FFD FFD FFD
X
FFD
X
FFD
X X
FFD
X
OFBM OFBM OFBM OFBM OFBM OFBM OFBM OFBM OFBM OF X X X X X Diffusion X OF X Diffusion OF with BS X Diffusion
X X X X X X X X X X X X X X X
V
X X X
V
X X
V
X X X X X X X X X X X X X
V
X X X X X X X X X
X
x x x x x x x x x x x x x
X X X X X X X X X
NC
Steepest descent L-BFGS-B Steepest descent L-BFGS-B Conjugate gradient Variational L-BFGS-B NC L-BFGS-B Steepest descent Variational L-BFGS-B Variational
X X X X X
V V
X X
V
provides a better description of the deformation than just the statisti-cal characterization".
2.2. Transformation model
The transformation model defines the sort of deformation al-lowed for the ST technique, and the way the similarity measure is evaluated. A well-known example is a rigid or affine transfor-mation. However, this transformation is too restrictive to model complex motions such as heart motion, which are better described by using non-rigid transformations.1 The non-rigid transformations
could be split in two main groups according to the way the defor-mation is described: function representations and physical based models.
Function representations make use of a small number of pa-rameters and much of the mathematical framework arises from the theory of function interpolation and approximation theory. Thus, they are also known as parametric models. One good ex-ample is the Free-Form-Deformation (FFD) model, where motion is parametrized by smooth function such a B-splines. In this model, the control points and spline functions are used to establish lo-cally the correspondence between images. The FFD is computation-ally efficient and has been widely used in ST methods (Myronenko et al., 2007; 2009; Yue et al., 2009; De Craene et al., 2012; Curíale et al., 2013a; Heyde et al., 2013a; 2013b; Piella et al., 2013) due to its computational efficiency
Physical based models are dense and non-parametric transfor-mations, where the displacement field is defined in each voxel
(Holden, 2008) according to physical phenomena. Such is the case of elastic models (Bajcsy and Kovacic, 1989), fluid mod-els (Beauchemin and Barron, 1995), optical flow and diffusion models (Thirion, 1998). All these transformation models assume that the intensity level of corresponding voxels remains the same when the images are deformed.
Elastic models treat the image as a linear elastic model and deform it using forces derived from an image similarity measure. In this context, the image is deformed until an equilibrium state is reached. Since the linear elasticity assumption is only valid for small deformations, it is hard to recover large image differences. To overcome this problem, the elastic model is replaced by a fluid model which allows large and highly localized deformation.
Optical flow registration is widely used in speckle tracking and it can be divided in two general methods: block matching meth-ods (Robinson et al., 1982; Trahey et al., 1988; 1987; Bohs and Tra-hey, 1991; Friemel et al., 1995; Strintzis and Kokkinidis, 1997; Ye-ung et al., 1998a; 1998b; Bohs et al., 2000; Cohen and Dinstein, 2002; Leitman et al., 2004) and variational methods (Knutsson et al., 2005; Curíale et al., 2013b; 2015; Alessandrini et al., 2013; Somphone et al., 2013; Tautz et al., 2013).
The diffusion or demons model introduced by Thirion
(1998) can be thought as an approximation to fluid registration.
Vercauteren et al. (2009) showed that the demons algorithms could be seen as an optimization procedure for a global energy on the entire space of displacement fields. Also, they showed that demons algorithm could be adapted to provide a non-parametric diffeomorphic transformation with a second-order minimization. Recently, Curíale et al. (2015) adapted the diffeomorphic demons method for strain estimation in 3D echocardiography by introduc-ing a Generalized Gamma speckle model into the global energy to be minimized.
The transformation model also comprises the interpolation used when a point is mapped from one space into another by certain
1 An interesting review of geometric transformations for non-rigid body can be found in Holden (2008).
transformation, i.e. image values in non-integer coordinates are computed by the appropriate interpolation technique. The inter-polation used can affect the accuracy and convergence of ST. To decrease the computational time, a simple scheme such as nearest neighbor or linear interpolation is usually applied in the optimiza-tion. More complex interpolation schemes can be used for higher accuracy, among them, cubic, B-spline or sine interpolation func-tions.
Obviously, any interpolation affects to any speckle model ap-plied in combination to any of the non-rigid transformations. How-ever, most of the methods applying speckle models assume that
"interpolation has a negligible effect in the ST accuracy".
Finally, there are different approaches to constrain the trans-formation model with the main goal of improving the ST accu-racy. Some authors, for instance, introduce the temporal consis-tency into the transformation model (De Craene et al., 2012), while others make use of an extra regularization by using the normal-ized convolution proposed by Knutsson and Westin (1993) in order to constrain the transformation to relevant tissue (Curíale et al., 2013b; 2015; Somphone et al., 2013).
2.3. Optimization strategy
The motion field or tracking between two or more objects in-side the image is found by optimizing the transformation model according to the similarity measure.
This optimization can be done by using many methods, such the classical gradient descent or the steepest descent op-timization (Myronenko et al., 2007; 2009), the conjugate gradi-ent (Curíale et al., 2013a), the Broyden Fletcher Goldfarb Shannon (L-BFGS-B) (Yue et al., 2009; De Craene et al., 2012; Heyde et al., 2013a; 2013b; Piella et al., 2013) or the normalized convolution
(Knutsson et al., 2005; Tautz et al., 2013) among others. Fluid, elas-tic and diffusion models that can be described in terms of partial differential equations are commonly optimized by using variational approaches (Alessandrini et al., 2013; Somphone et al., 2013; Curí-ale et al., 2013b; 2015). All these methods are well documented in
Press et al. (2007).
Furthermore, a widely used strategy for improving the opti-mization, especially for large deformations, is to use a coarse-to-fine recoarse-to-finement (Yeung et al., 1998a; 1998b; Knutsson et al., 2005; Yue et al., 2009; Myronenko et al., 2009; De Craene et al., 2012; Curíale et al., 2013a; 2013b; Heyde et al., 2013b; 2013a; Somphone et al., 2013; Alessandrini et al., 2013; Piella et al., 2013; Tautz et al., 2013). This approach is highly recommended for the complex de-formations such is the case of the heart motion. Thus, it is ex-pected that "a coarse-to-fine refinement improves the ST accuracy".
3. Materials and methods
3.1. Methodology
The analysis of the influence of the multiple techniques used in ST methods is done according the to the different possible choices described in Section 2 within the three components of a generic ST method: the similarity measure, the transformation model and the optimization strategy (depicted in Fig. 1). The proposed anal-ysis will test the underlying hypotheses that have been identified from the methods of the state of the art:
Hypothesis 1. Similarity measures based on a speckle model
char-acterization are more reliable to real US data and improve the ST accuracy.
Hypothesis 2. Speckle models that take into account temporal
cor-relation improve ST accuracy.
Hypothesis 3. Although interpolation modifies the statistical
model assumed for characterizing the speckle pattern, it has a neg-ligible effect on the ST accuracy.
Hypothesis 4. The transformation model has greater influence on
the ST accuracy than the similarity measure.
Hypothesis 5. Structural information increases the ST accuracy
more than just the speckle model.
Hypothesis 6. A coarse to fine refinement approach improves
sig-nificantly the ST accuracy for complex motions.
Hypothesis 7. A complex interpolation scheme improves the ST
accuracy, regardless of the similarity measure selected.
Hypothesis 8. The optimization strategy has more influence in the
ST accuracy than the similarity measure.
In addition, note that there are not initial assumptions about the cross performance of improvements in different steps of the procedure, such as a better transformation model with structural information and a coarse to fine refinement. This interrelations are the key of the buildup of an efficient and accurate ST pipeline, and therefore they must also be analyzed.
In order to validate these hypotheses, a series of experiments will be conducted. Due to the impracticability of considering all the possible combinations of methods and parameters reported in literature, we will confine ourselves only to those relevant and rep-resentative for each of the three steps defined for ST. The analysis of the similarity measure will consider the sum of squared differ-ences (SSD) and other metrics based on speckle characterization (summarized in Table 1) in order to analyze the influence of the speckle statistical models on the ST performance.
On the other hand, two nonparametric transformation models will be considered in order to minimize the influence of the op-timization strategy into the final estimation. We decided to study the classic block matching and the diffusion approaches since the number of strategies used to optimize the transformation model and the number of free parameters to fix are reduced.
The quantitative evaluation will be performed by considering a realistic synthetic data as a Gold standard that will be described in
Section 3.2. The accuracy of the ST methods will be evaluated by the measuring the error (Euclidean distance) for motion and strain estimation with the ground truth.
In all the cases, the procedure to evaluate one particular hy-pothesis will be similar: a simple ST pipeline will be considered. Different configurations are used only for the method or strategy under study, i.e. that one implied by the current hypothesis. The procedures for the other methods are fixed in a simple configura-tion, so that it allows identifying the actual influence of the pa-rameter under study over the global performance. This methodol-ogy will be adjusted to the particularity of each of the analyzed
choices, and it will be described in detail for each experiment in
Section 4.
First, according to hypotheses 1 and 2, the influence of the
sim-ilarity measure is analyzed. In particular, the analysis of the
in-fluence of the similarity measure takes into account the measures described in Table 2.
Second, following hypotheses [3,4,5] and 7, the influence of the
transformation model is studied. We will consider the following
strategies:
• Transformation: Two different nonparametric transformations are taken into account: The classical Block Matching and a dif-feomorphic diffusion or Demons approach (Vercauteren et al., 2009). The reader can refer to Curíale et al. (2015) for more de-tails about the demons implementation.
• Interpolation: Three different interpolation types are considered: nearest neighborhood, linear and cubic interpolation.
• Regularization: The influence of myocardial structural informa-tion is analyzed by using the normalized convoluinforma-tion to reduce the number of possible transformations.
Finally, consistent with hypotheses 6 and 8, we evaluate the in-fluence of the optimization strategy, specifically taking into ac-count an iterative and non-iterative approach. The optimization strategy used for the block matching algorithm is based on find-ing the best correspondence within a set of blocks defined by the search radius, so it is a non-iterative approach and does not require extra interpolations. In contrast, the optimization strategy used for the diffusion-based approach makes use of a variational formula-tion which is iteratively refined and requires several interpolaformula-tions. Thus, we expect to observe different behaviors between the block matching and the demons approach for the similarity models. Fur-thermore, we study the use of an efficient second-order minimiza-tion for the demons approach and a coarse to fine refinement for both transformation models.
Along all the experiments, we decide to prioritize the tem-poral coherence along the cardiac phase instead of avoiding the frame to frame error accumulation. Therefore, the registration al-gorithms were applied frame by frame between two consecutive images in the cardiac phase. During the derivation of the speckle tracking methods the parameters for the Gamma, Nakagami and Generalized Gamma distributions were estimated. The Gamma and Generalized Gamma parameters are estimated by means of the Gamma and Generalized Gamma Mixture Model (Vegas-Sanchez-Ferrero et al., 2012; 2014). On the other hand, the temporal cor-relation of the Nakagami and Generalized Gamma distribution is estimated as it was proposed by Curíale et al. (2015).
3.2. Materials
The quantitative evaluation of the different methods is carried out by using a synthetic cardiac US data set: the public benchmark named Straus (De Craene et al., 2013). The use of synthetic data is motivated by the need of a Gold Standard that allows a numerical comparison of the actual values of strain and motion. This way, we can quantify the degree of influence of each of the studied meth-ods over the final estimation, a task that could not be done by using real data sets.
Table 2
Summary of the similarity measures studied. Constants m and p are shape parameters of the Generalized Gamma distribution; a is the shape parameter of the Gamma distribution and p is the correlation between different time frames Jt_i and Jt (details on these similarity measures can be found in (Curiale et al., 2015)).
Relationship Similarity measure References
z = /t_ i - / ,
z = /t_i//t
SSD=||z||
CD2 = log (exp(2 z + l ) ) - z
MS2 = (m + 0.5) log (cosh2 (z) - p)
- 0 . 5 log (cosh2 (z))
GGCS= (m + 0.5) log (cosh2 (z P) - p)
- 0.5 log (cosh2 (z P))
GS = a log (z + z-1 + 2)
GGS= ( m + 0.5) log ( (zv + l )2 - 4pz2t>
-2 p mlog(z) - log(z2/! + l )
Yeung et al. (1998a); 1998b); Myronenko et al. (2007)
Curiale et al. (2013b); Heyde et al. (2013a); 2013b)
Piella et al. (2013); Somphone et al. (2013)
Strintzis and Kokkinidis (1997); Cohen and Dinstein (2002)
Yue et al. (2009); Piella et al. (2013)
Myronenko et al. (2009)
Curiale et al. (2015)
Curiale et al. (2013a)
Curiale et al. (2015)
Fig. 2. Synthetic ultrasound images generated by Straus. The 3D synthetic US
im-ages are presented in three orthogonal views. The shape model is depicted in the top-right corner.
and by transmitting a Gaussian pulse with a -6 dB relative band-width of 65%. A symmetric transverse two-way beam profile was assumed, focusing at 80 mm. The simulated images consisted of 107 x 80 lines in azimuth and elevation direction over an angle of 80 x 80 degrees, resulting in a frame rate of 30 Hz due to the use of parallel beam forming. In this way, the cardiac phase for the normal case comprises 26 images. A detailed description of the data setup can be found in De Craene et al. (2013).
The Straus dataset also provides several image sequences of the normal case with different signal to noise (SNR) levels. These cases were generated to simulate the SNR levels by modifying the rela-tive amplitude of tissue with respect to blood pool scatters. This change means an increasing noise power and it is directly related with a contrast value (CNR) according to the equation (Wijk and Thijssen, 2002):
flj — flB
CNR =
J(o$+of)l2
(1)where ¡iT and ¡j,B are the average intensities value of the tissue
and blood pool, and ai and a} are their variances respectively. The
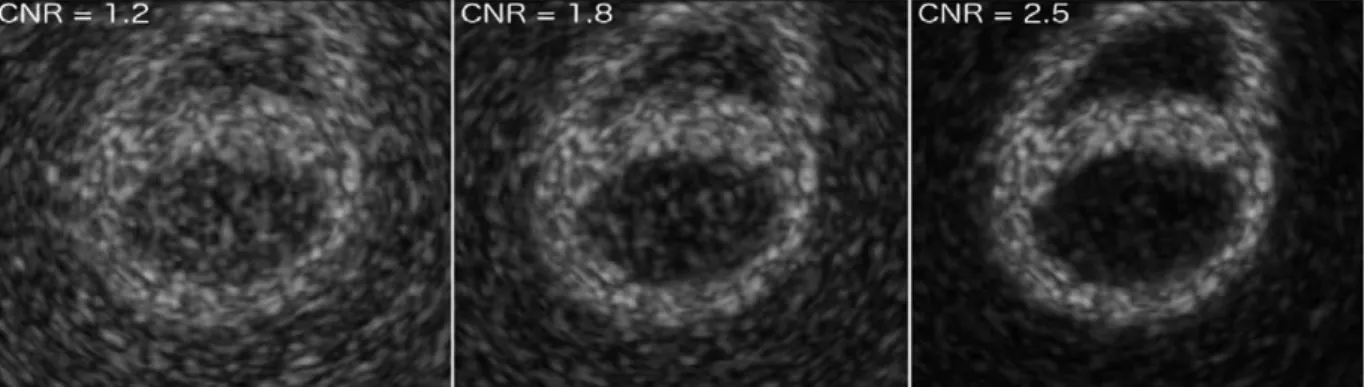
quantitative evaluation for the proposed methodology was carried out only using the normal case without pericardium to avoid the influence of pathological cases and the pericardium in the ST tech-nique. For robustness assessment of the ST techniques at different SNR levels, three different contrast to noise ratio values were used, CNR = {1.2, 1.8,2.5} (Fig. 3).
The data set provides changes in the ultrasound image intensity throughout the cardiac cycle since it makes use of a new speckle pattern realization for each 3D ultrasound b-mode image. This way, they show a more realistic behavior than considering transforma-tions over the same intensity levels across frames.
For the parameter settings of the speckle tracking methodolo-gies, the diffeomorphic demons approach is applied to the syn-thetic dataset with the parameters setting proposed by Curiale et al. (2015), and the block matching approach makes use of a block size of 3 x 3 x 3 pixels within a search region of 3 x 3 x 3 pixels. The demons approach is applied by using nLevels = 3 with a maximum of 30 iterations per level (multi-resolution strategy) or when the difference between deformations is below a tolerance TOL = 10~7. The standard deviation values used in the
regulariza-tion were determined using an independent linear search between [1, 8] mm for the regularization and [0.5, 5.5] mm for the maxi-mum step. On the other hand, the kernel sizes were selected as a tradeoff between the motion and strain accuracy and the total run-time for the Generalized Gamma mixture model. The reader can refer to Curiale et al. (2015) for the optimized values used in the demons approach.
This configuration is maintained throughout the experiments in order to see the influence of the different choices of similar-ity measures, transformation models and optimization techniques without the influence of uncontrolled confounding factors.
4. Experiments and results
Fig. 3. Synthetic ultrasound images for the Straus dataset for different signal to noise ratio simulated by modifying the relative amplitude of tissue with respect to blood
pool scatters (CNR). The 3D synthetic US images are presented in the short axis view.
Table 3
Summary of the experiments. BM: Block Matching. Int.: Interpolation type, NN: nearest neighborhood, L: linear, C: Cubic. Struct. Inf.: myocardial structural information. MR: multi-resolution, ESM: efficient second order minimization. - : Whole pipeline experiment.
Exp. 1 Exp. 2 Exp. 3 Exp. 4 Exp. 5
Similarity
Measures
All All All All All
Transformation
BM
V V V V V
Demons
V V V V V
Int.
L NN/L/C L L L
Struct.
X X
V
X
V
Inf.
Optimization
MR ESM
X
V
X
V V
X X X
V V
Hyp.
1,2,4 3, 7 5 6,8
-4.1. Effect of similarity measures and transformation models
In the following experiment, we evaluate Hypotheses 1 and
2 by studying the influence of the similarity measures and speckle models (gathered in Table 2) by testing the performance of the dif-ferent similarity measures for motion and strain estimation. Also, this experiment evaluates the Hypothesis 4 to study the influence of the transformation model over the ST accuracy.
Experiment 1. The errors in motion and strain are analyzed for
the Strauss data set for all the proposed similarity measures. A classic block matching algorithm and a simple diffeomorphic demons approach are used, (i.e. without myocardial structural in-formation or multi-resolution strategy). The results were statisti-cally analyzed by a sign test and a bootstrapping strategy with two hundred repetitions applied to a set of 100 error samples for each frame in the cardiac phase. This statistical test was chosen due to the lack of symmetry on the error difference between similarity measures for motion and strain.
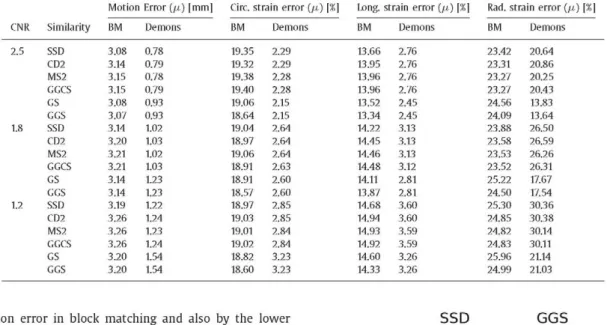
Results of the experiments are gathered in Table 4 (average er-ror along the cardiac phase). The results for the block matching approach show a subtle but still statistically significant difference between metrics based on intensity ratios (GS and GGS around 3.08 mm) and metrics based on intensity differences (CD2, MS2, GGCS2, around 3.15 mm) due to the inclusion of log-compression into the metric derivation (p-value < 10~4 in all cases). This
dif-ferences were expected since the similarity measures GS and GGS consider spatial and temporal correlation between images, how-ever the lower performance of GGCS compared to the GGS is due to the assumption of log-compression in the metric. Note that the inclusion of log-compression in this metrics implicitly assumes that intensities are actually log-compressed intensities, and the pa-rameters of the characterization must be estimated considering an idealistic logarithmic compression, whose parameters are also un-known. This fact introduces an additional confounding factor that affects negatively to the motion estimation. Additionally, the SSD metric -which does not assume any statistical model- performs as
good as the best statistical methods (3.08 mm), though it does not perform as good with the circumferential strain (13.39% for SSD vs. 19.06% for GS with p-value < lO^2; 18.64 % for GS with a p-value
< 10~4). This result means that the coarse deformation can be
per-fectly estimated with SSD. However, a more detailed metric that accounts for spatial and temporal correlation is needed to describe circumferential deformations.
As a conclusion, we can state that both Hypotheses 1 and 2 are confirmed for the block matching approach since spatial and tem-poral correlations increase the accuracy, but the log-compression assumption on the intensity labels introduce some additional un-certainty in the estimation which penalizes the estimation.
Interestingly, there is an apparent decrease of the performance of metrics GS and GGS for the radial strain error (over 24 %). This is due to the effect that most of the deformation is performed in the radial direction, which makes the radial estimation more prone to a higher number of candidates in the search window. The ones selected by these metrics are those providing a lower ratio of in-tensities, which is more sensitive to variations than the simple dif-ference of intensities. As we will see in further experiments, the optimization techniques will be of great importance when these similarity measures are used and this undesired effect can be ef-fectively avoided by using a more suitable transformation model like demons. The results obtained for demons show a great per-formance compared to the block matching method as expected. In this case, the measures that perform the best are those that con-sider the logarithmic compression into the model (CD2, MS2 and GGCS) with motion error around 0.78 mm, however those not as-suming compression (GS and GGS) obtain the most accurate strain estimate and both groups are statistically different (p-value < 10~3
Table 4
Quantitative results of Experiment 1 for average motion and strain accuracy using block matching (BM) and the simple demons approach, i.e. without a coarse-to-fine refinement and without the normalized convolution.
Motion Error (¿t) [mm] Circ. strain error (¿t) [%\ Long, strain error (¿t) [%\ Rad. strain error (¿t) [%]
Similarity SSD CD2 MS2 GGCS GS GGS SSD CD2 MS2 GGCS GS GGS SSD CD2 MS2 GGCS GS GGS BM 3.08 3.14 3.15 3.15 3.08 3.07 3.14 3.20 3.21 3.21 3.14 3.14 3.19 3.26 3.26 3.26 3.20 3.20 Demons 0.78 0.79 0.78 0.79 0.93 0.93 1.02 1.03 1.02 1.03 1.23 1.23 1.22 1.24 1.23 1.24 1.54 1.54 BM 19.35 19.32 19.38 19.40 19.06 18.64 19.04 18.97 19.06 18.91 18.91 18.57 18.97 19.03 19.01 19.02 18.82 18.60 Demons 2.29 2.29 2.28 2.28 2.15 2.15 2.64 2.64 2.64 2.63 2.60 2.60 2.85 2.85 2.84 2.84 3.23 3.23 BM 13.66 13.95 13.96 13.96 13.52 13.34 14.22 14.45 14.46 14.48 14.11 13.87 14.68 14.94 14.93 14.92 14.60 14.33 Demons 2.76 2.76 2.76 2.76 2.45 2.45 3.13 3.13 3.13 3.12 2.81 2.81 3.60 3.60 3.59 3.59 3.26 3.26 BM 23.42 23.31 23.27 23.27 24.56 24.09 23.88 23.58 23.53 23.52 25.22 24.50 25.30 24.85 24.82 24.83 25.96 24.99 Demons 20.64 20.86 20.25 20.43 13.83 13.64 26.50 26.59 26.26 26.31 17.67 17.54 30.36 30.38 30.14 30.11 21.14 21.03
the lower motion error in block matching and also by the lower circumferential and longitudinal strain error. However, the block matching method reduces its efficiency with large deformations, causing inaccurate estimation of radial strain. When a more suit-able technique which considers diffeomorphic transformation and spatial regularization is used to provide a more accurate motion estimation, the influence of the metrics is reduced to increase the spatial continuity. This is the case of metrics whose intensities are related with a difference such as the case of sum of squared dif-ferences (SSD) due to the log-compression assumption in the sta-tistical model (CD2, MS2, GGCS). However, if the stasta-tistical method does not consider the log-compression (GS and GGS) the motion estimation is reduced due to the bigger fluctuations caused by the ratio of intensities, though the strain is generally better calcu-lated because the inner regularization scheme used in the demons method includes a more suitable speckle model, which prevents from an excess of regularization (i.e. the motion estimation is more noisy but less biased by other non-related nearby motions result-ing in a better estimate of strain).
The analysis of different regularization schemes will be stud-ied in the following experiments, where we will consider multi-resolution refinements that will reduce the excess or regulariza-tion by analyzing the images at different scales. With the multi-resolution schemes, the metrics GS and GGS should show a lower motion error due to the iterative refinements at different reso-lutions which will provide better motion estimates in the radial direction (the largest deformation) without causing an excess of regularization that may cause low strain estimation performance. It is also important to note that there is an interdependence be-tween the influence of the similarity measure and the transforma-tion/optimization model, which is a side effect of the operations involved in the metric and the relationship of the moving image and the fixed image. This effect will be further investigated in the section named "Discussion on the interdependences".
So far, we have shown that the similarity measures have cer-tain influence in each transformation model separately. However, if we consider the deformation model itself for both approaches, it remains clear that a more accurate deformation model obtains better results for both motion and strain estimates. As an example,
Fig. 5 shows the motion errors along the cardiac phase for both approaches, block matching and demons, using a simple similarity measure (SSD) for all the CNR considered. Likewise, Fig. 4 shows the spatial circumferential strain error for three speckle models
SSD GGS GGCS
Fig. 4. Global circumferential strain accuracy for the squared sum of differences
(SSD) and the Generalized Gamma similarity measures with and without compres-sion (GGCS and GGS) for the Straus dataset within the 17 segment model at end-systole and CNR = 2.5.
(SSD, GGS, GGCS) within the 17-segments model AHA. These re-sults confirm the importance of the transformation model for mo-tion and strain ST accuracy, which confirms the Hypothesis 4.
4.2. Effect of interpolation and transformation models
The deformation defined by the transformation model implies an interpolation of intensities in one of the images. Different inter-polation strategies can be adopted which may show different re-sults on the ST accuracy, as Hypothesis 3 states. To analyze this influence, the following experiment is done:
Experiment 2:. The motion and strain accuracy are evaluated by
using three different interpolation strategies: nearest neighbor-hood, linear and cubic. Both transformation methods are consid-ered together with a multi-resolution optimization strategy.
The multi-resolution approach is applied in this experiment to increase the number of interpolation steps to amplify the influence of different interpolation schemes and to analyze the performance of similarity measures when the regularization schemes are more accurate. The differences between interpolation types were statis-tically analyzed, as in the previous experiment.
Motion error for Block Matching SSD
1 ! I ! i ! I I ! 1 i H ! ' Motion error for Demons SSD
E 16
— CNR= 1.2 — CNR=1.8
CNR=2.5
: 1 : T
1
1 : : : :
! Í !
> - - * ^ 7 + T T - T t
tr^kñ^SM-áífÉpr
t
+1 t t í t
rL i ^ T i l ^
TT
yL
i
ffl*
jllPt
rl TL ±
|
-T 1 i i
Hf
1 2 3 4 5 6 7 8 9 10 11 12 13 14 15 16 17 18 19 20 21 22 23 24 25 26 27
Time
Fig. 5. Motion accuracy of the transformation models studied, block matching and demons, for the squared sum of differences along the cardiac phase for the Straus dataset to different signal to noise ratio levels CNR e [1.2, 1.8, 2.5]. The cardiac frame at end-systole is shown as a vertical dash line.
Table 5
Global average motion and strain error for the Straus dataset by interpolation types: nearest neighborhood, linear and cubic.
CNR 2.5 1.2 Similarity SSD CD2 MS2 GGCS GS GGS SSD CD2 MS2 GGCS GS GGS
Average motion error, ¡x [mm
Block matching Nearest 0.98 0.99 0.99 0.99 1.01 1.01 1.24 1.25 1.25 1.26 1.36 1.30 Linear 0.96 0.97 0.97 0.97 0.98 0.99 1.21 1.22 1.22 1.22 1.29 1.26 Cubic 0.96 0.96 0.96 0.96 0.98 0.99 1.18 1.19 1.19 1.19 1.27 1.25 ] Demons Nearest 0.83 0.84 0.83 0.83 0.79 0.79 1.23 1.24 1.23 1.23 1.04 1.04 Linear 0.74 0.75 0.74 0.75 0.70 0.70 1.21 1.22 1.21 1.21 1.02 1.02 Cubic 0.76 0.78 0.77 0.78 0.73 0.73 1.21 1.23 1.22 1.22 1.04 1.05
Average circumferential strain
Block matching Nearest 18.91 19.15 19.07 19.04 18.54 17.71 19.43 19.79 19.75 19.65 19.16 18.35 Linear 18.95 18.95 18.99 18.92 18.43 17.72 19.48 19.96 19.90 19.92 19.29 18.66 Cubic 18.80 18.74 18.69 18.69 18.09 17.45 19.25 19.61 19.60 19.57 19.14 18.36 error, ¡x Demons Nearest 2.65 2.66 2.67 2.66 2.26 2.28 3.10 3.09 3.10 3.09 2.58 2.58 [%] Linear 2.29 2.29 2.27 2.27 1.92 1.92 2.91 2.92 2.90 2.89 2.35 2.35 Cubic 2.31 2.28 2.26 2.25 1.92 1.92 2.29 2.90 2.86 2.86 2.35 2.35
differences between the interpolation types under the block matching approach, this means that the patch strategy used in the block matching methodology does not take advantage of finer interpolation schemes and the similarity measures behave in the same fashion as they did without any multi-resolution scheme.
On the other hand, some significant differences are found us-ing the demons approach (p-value < 10~2), where the linear and
cubic schemes show differences with respect to the nearest neigh-borhood. This was an expected result since the demons transfor-mation model requires interpolations in each iteration. However, no significance difference was found between linear and cubic in-terpolation and, thus, more complex inin-terpolations do not imply a significant improvement. This result confirms Hypothesis 7, though it shows that the complexity of the interpolation is not a guaranty of better results.
When we analyze together the metrics and the transforma-tion model the importance of joint effects between the similarity measure and the transformation model is confirmed. Note that metrics GS and GGS showed the worse results for motion estima-tion when no multi-resoluestima-tion scheme was applied (see Table 4).
However, the motion error is reduced due to the more accurate es-timations of large deformations while the strain error still remains the best estimated. This improvement is due to a better regulariza-tion performed during the multi-resoluregulariza-tion scheme, which avoids an excess of regularization for these similarity measures.
4.3. Effect of myocardial structural information
The main purpose of a regularization step is to constrain the transformation model to ensure the existence of a solution. Be-sides, it is possible to introduce myocardial structural information
in the transformation by using the normalized convolution to regu-larize the transformation and improve the ST accuracy. In this sec-tion, the Hypothesis 5 is evaluated by studying the influence of the regularization over the ST accuracy:
Experiment 3:. The myocardial structural information is
intro-duced by using the normalized convolution and a myocardial tis-sue classification as implemented in Curíale et al. (2015).
Results obtained for motion error are shown in Table 6, where we can see a significant improvement of the motion estimation for the demons approach. However, this improvement is not so clear when the block matching method is considered. This fact evidences the importance of the transformation model and the techniques used for interpolating and regularizing the data. The demons phi-losophy makes use of several regularizations throughout iterations. Thus, considering structural information in each of the regular-izations prevent from over regularization and reduces accumula-tive errors, since the regularization is focusing into the myocar-dial tissue instead of other non-relevant structures. This observa-tion confirms the results in De Craene et al. (2013), where this ef-fect was already pointed out. The almost negligible efef-fect observed in block matching shows that the performance of this method can-not be easily improved without any multiresolution approach that may take advantage of more regularization steps. We will see this combined effect in the following experiments. The results worsen when the CNR is reduced mainly due to the difficulties of estimat-ing structural information from noisy images.
Table 6
Global average motion, circumferential strain and radial strain error for the Straus dataset with (Struct. Info.) and without (Simple) myocardial structural information. The relative improvement is shown between parenthesis.
CNR 2.5 1.2 Similarity SSD CD2 MS2 GGCS GS GGS SSD CD2 MS2 GGCS GS GGS
Average motion error and improvement Block matching, ii [mm] (%)
Simple 3.08 3.14 3.15 3.15 3.08 3.07 3.19 3.26 3.26 3.26 3.20 3.20 Struct. Info. 3.08 (0.2%; 3.14 (0.2%) 3.14 (0.2%; 3.14 (0.2%; 3.07 (0.2%; 3.07 (0.2%; 3.19 (0.0%) 3.26 (0.0%; 3.26 (0.0%; 3.26 (0.0%; 3.20 (0.0%; 3.19 (0.0%) Demons, ii Simple 0.78 0.79 0.78 0.79 0.93 0.93 1.22 1.24 1.23 1.24 1.54 1.54 [mm] (%) Struct. Info. 0.61 (21.4%) 0.62 (22.4%; 0.61 (21.1%) 0.62 (22.0%) 0.68 (26.9%; 0.68 (27.0%) 1.19 (3.0%) 1.20 (3.2%) 1.19 (3.0%) 1.20 (3.1%) 1.49 (3.2%; 1.49 (3.1%)
Average circ. strain error and Block matching, ¡i [%] (%)
Simple 19.35 19.32 19.38 19.40 19.06 18.64 18.97 19.03 19.01 19.02 18.82 18.60 Struct. Info. 19.07 (1.4%) 19.07 (1.2%; 19.13 (1.3%) 19.13 (1.4%) 18.88 (1.0%; 18.51 (0.7%; 18.97 (0.0%; 19.02 (0.1%; 19.01 (-0.0%; 19.01 (0.0%) 18.83 (-0.0%) 18.60 (-0.0%; improvement Demons, ii Simple 2.29 2.29 2.28 2.28 2.15 2.15 2.85 2.85 2.84 2.84 3.23 3.23 [%] (%) Struct. Info. 2.17 (5.6%) 2.15 (6.0%; 2.17 (5.2%; 2.15 (5.6%; 2.04 (5.3%; 2.03 (5.3%; 2.85 ( - 0 . 1 % ; 2.85 (0.0%) 2.84 (-0.0%) 2.84 (0.0%) 3.19 (1.2%) 3.19 (1.2%)
Average rad. strain error and Block matcliing, ¡i [%] (%)
Simple 23.42 23.31 23.27 23.27 24.56 24.09 25.30 24.85 24.82 24.83 25.96 24.99 Struct. Info. 23.38 (0.2%) 23.39 (-0.3%; 23.33 (-0.3%; 23.32 (-0.2%; 24.68 (-0.5%; 24.33 (-1.0%; 25.29 (0.0%) 24.83 (0.1%) 24.83 (-0.0%) 24.84 (-0.0%; 25.97 (-0.0%; 24.97 (0.1%) improvement Demons, ii Simple 20.64 20.86 20.25 20.43 13.83 13.64 30.36 30.38 30.14 30.11 21.14 21.03 [%] (%) Struct. Info. 16.31 (21.0%) 16.38 (21.5%; 16.21 (19.9%; 16.28 (20.3%; 13.11 (5.2%) 13.04 (4.4%) 30.15 (0.7%) 30.14 (0.8%) 29.91 (0.7%; 29.87 (0.8%; 21.30 (-0.7%; 21.19 (-0.7%) Table 7
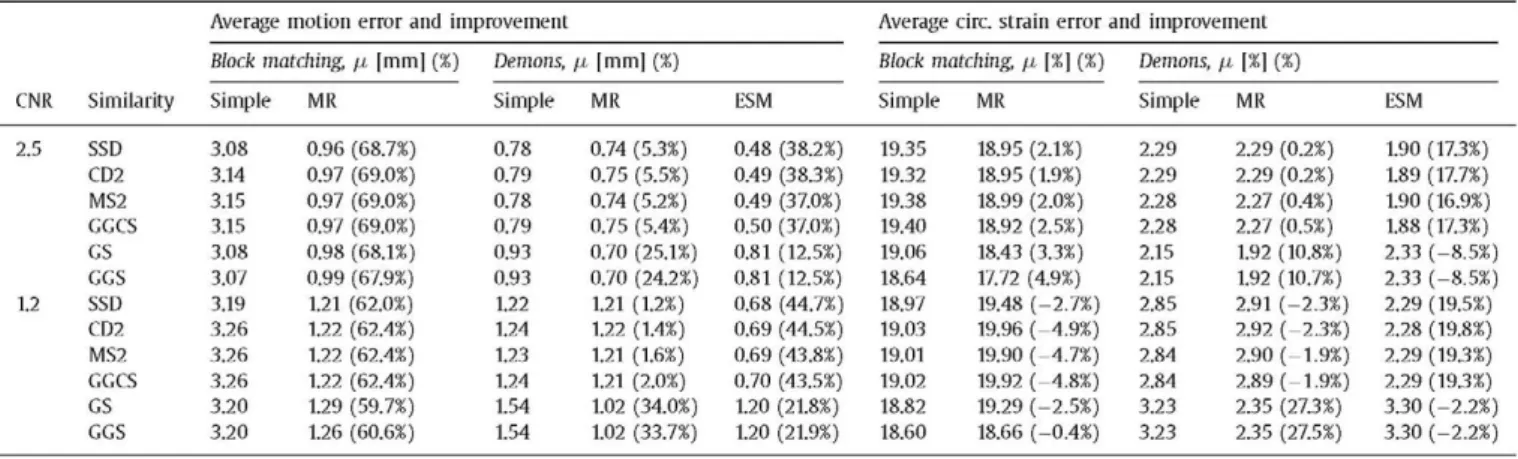
Average displacement and circumferential strain error, ¡x, on the Straus dataset for the multi-resolution refinement (MR) and an efficient second-order minimization (ESM). For comparison purpose, it is presented the simplest block matching and demons implementation. The relative improvement is shown between parenthesis.
CNR 2.5 1.2 Similarity SSD CD2 MS2 GGCS GS GGS SSD CD2 MS2 GGCS GS GGS
Average motion error and improvement
Block matching, ¡x [mm] (%)
Simple MR 3.08 3.14 3.15 3.15 3.08 3.07 3.19 3.26 3.26 3.26 3.20 3.20 0.96 (68.7%) 0.97 (69.0%) 0.97 (69.0%) 0.97 (69.0%) 0.98 (68.1%) 0.99 (67.9%) 1.21 (62.0%) 1.22 (62.4%) 1.22 (62.4%) 1.22 (62.4%) 1.29 (59.7%) 1.26 (60.6%) Demons, Simple 0.78 0.79 0.78 0.79 0.93 0.93 1.22 1.24 1.23 1.24 1.54 1.54
ix [mm] (%)
MR 0.74 (5.3%) 0.75 (5.5%) 0.74 (5.2%) 0.75 (5.4%) 0.70 (25.1%) 0.70 (24.2%) 1.21 (1.2%) 1.22 (1.4%) 1.21 (1.6%) 1.21 (2.0%) 1.02 (34.0%) 1.02 (33.7%) ESM 0.48 (38.2%) 0.49 (38.3%) 0.49 (37.0%) 0.50 (37.0%) 0.81 (12.5%) 0.81 (12.5%) 0.68 (44.7%) 0.69 (44.5%) 0.69 (43.8%) 0.70 (43.5%) 1.20 (21.8%) 1.20 (21.9%)
Average circ. strain error
Block matching, ¡x [%] (%)
Simple MR 19.35 19.32 19.38 19.40 19.06 18.64 18.97 19.03 19.01 19.02 18.82 18.60 18.95 (2.1%) 18.95 (1.9%) 18.99 (2.0%) 18.92 (2.5%) 18.43 (3.3%) 17.72 (4.9%) 19.48 (-2.7%) 19.96 (-4.9%) 19.90 (-4.7%) 19.92 (-4.8%) 19.29 (-2.5%) 18.66 (-0.4%) and improvement Demons, Simple 2.29 2.29 2.28 2.28 2.15 2.15 2.85 2.85 2.84 2.84 3.23 3.23
IX [%] (%)
MR 2.29 (0.2%) 2.29 (0.2%) 2.27 (0.4%) 2.27 (0.5%) 1.92 (10.8%) 1.92 (10.7%) 2.91 (-2.3%) 2.92 (-2.3%) 2.90 (-1.9%) 2.89 (-1.9%) 2.35 (27.3%) 2.35 (27.5%) ESM 1.90 (17.3%) 1.89 (17.7%) 1.90 (16.9%) 1.88 (17.3%) 2.33 (-8.5%) 2.33 (-8.5%) 2.29 (19.5%) 2.28 (19.8%) 2.29 (19.3%) 2.29 (19.3%) 3.30 (-2.2%) 3.30 (-2.2%)
structural information is just a technique recommendable when the probabilistic tissue characterization provides good estimates.
4.4. Effect of multi-resolution and efficient second order minimization strategies
The tracking in ST is usually carried out by optimizing the transformation model according to a similarity measure. In this section, the influence of the strategy selected for optimization is analyzed by evaluating the Hypotheses 6 and 8. In particular, we will focus on two popular methodologies: a coarse to fine refine-ment (multi-resolution) and an efficient second-order minimiza-tion (ESM) proposed for demons in Vercauteren et al. (2009). To that aim, the following experiment is proposed:
Experiment 4:. The multi-resolution strategy is evaluated for both
the block matching and demons approaches using a linear interpo-lation scheme. On the other hand, the efficient second-order mini-mization is only evaluated for the diffusion approach.
Table 7 shows the average error for both strategies at two sig-nal to noise levels (CNR = {1.2, 2.5}). The multi-resolution philoso-phy shows a tremendous improvement for the block matching ap-proach in the motion estimation, obtaining errors below 1 mm. This substantial improvement makes the multi-resolution block matching a technique with similar results than the simple version of demons for motion estimation. However, the strain error is not equally reduced when circumferential strain is considered. This in-teresting result is due to the great improvement observed in the radial direction, but the not so good improvement in the circum-ferential direction, where the multi-resolution block matching al-gorithm still fails.
In general we can conclude that the coarse to fine refinement improves the motion estimation significantly for both methods. However, the strain error slightly improves and it can get even worse in low CNR scenarios. This interesting behavior of demons shows that the iterative optimization of the displacement fields al-ready behaves as the multi-resolution philosophy. There are some interesting exceptions that show a noticeable improvement with those metrics not considering log compression (GS and GGS). This behavior also confirms the importance of the metrics during the regularization steps of demons. Note that the metrics GS and GGS provide a more suitable speckle model which prevents from over regularization. Thus, the multi-resolution scheme leverages this better characterization of speckle to reduce the cumulative error during the multi-resolution approach, resulting in an improvement of both motion and strain estimation.
In conclusion, Hypothesis 6 is discarded in general since the coarse to fine approach improves the motion estimation, though there are some metrics such as GS and GGS where the multi-resolution scheme is especially recommended.
Regarding the second-order minimization, Table 7 shows a gen-eral improvement in motion estimation and also in strain estima-tion. However, this minimization scheme is more unstable for met-rics whose relation is established as a ratio, which cause worse re-sults in the strain estimation, though the motion error is reduced due to the regularization scheme of demons. Thus, Hypothesis 8 can be also rejected in general, since it is just recommendable when metrics involving difference of intensities (see Table 2).
4.5. Performance of the complete ST pipeline
Table 8
Average motion and circumferential strain error, ¡x, on the Straus dataset for block matching and demons approach with (All) and without (Simple) all the strategies.
CNR
2.5
1.2
Similarity
SSD CD2 MS2 GGCS GS GGS SSD CD2 MS2 GGCS GS GGS
Average motion error and improvement
Block matching, ¡x [mm] (%)
Simple All
3.08 3.14 3.15 3.15 3.08 3.07 3.19 3.26 3.26 3.26 3.20 3.20
0.97 (68.7%) 0.98 (68.9%) 0.98 (68.9%) 0.98 (68.9%) 0.98 (68.0%) 0.99 (67.8%) 1.21 (62.1%) 1.22 (62.6%) 1.22 (62.6%) 1.22 (62.5%) 1.29 (59.8%) 1.26 (60.7%)
Demons,
Simple
0.78 0.79 0.78 0.79 0.93 0.93 1.22 1.24 1.23 1.24 1.54 1.54
ix [mm] (%)
All
0.48 (38.2% 0.49 (38.9% 0.48 (37.8% 0.49 (38.3% 0.51 (45.0% 0.51 (45.0% 0.57 (53.1% 0.58 (53.2% 0.58 (52.5% 0.59 (52.6% 1.08 (29.6% 1.08 (30.0%
Average circ. strain error and improvement
Block matching, ¡x [%] (%) Demons,
Simple
19.35 19.32 19.38 19.40 19.06 18.64 18.97 19.03 19.01 19.02 18.82 18.60
All
18.85 (2.6%) 18.92 (2.0%) 18.88 (2.6%) 18.88 (2.7%) 18.37 (3.7%) 17.59 (5.6%) 19.46 (-2.6% 19.87 (-4.4% 19.87 (-4.6% 19.95 (-4.9% 19.35 (-2.8% 18.71 (-0.6%
Simple
2.29 2.29 2.28 2.28 2.15 2.15 2.85 2.85 2.84 2.84 3.23 3.23
IX [%] (%)
All
2.07 (9.7%) 2.06 (10.0%) 2.07 (9.5%) 2.06 (9.7%) 1.96 (8.9%) 2.07 (3.6%) 2.21 (22.3%) 2.20 (22.8%) 2.21 (22.2%) 2.20 (22.6%) 3.16 (2.3%) 3.14 (2.9%)
methods are strongly related to other methods along the ST pipeline. The aim of this section is to provide a deeper analysis of the ST accuracy where all the components are combined by means of the following experiment:
Experiment 5. A complete ST pipeline is evaluated for the Strauss
data set with the following configuration: (1) using all the sim-ilarity measures proposed; (2) both transformation approaches, block matching and demons; (3) the use of myocardial struc-tural information; (4) a multi-resolution approach; and (5) an ef-ficient second-order minimization. Three different contrast values are considered, CNR = {1.2,1.8,2.5}.
Results for experiment are collected in Table 8. We will de-note as "All" to the complete pipeline (with structural information, multi-resolution and ESM in the demons transformation) and
"Sim-ple" to the simplified pipeline described in Experiment 1. At first
glance, these results show a significant improvement in motion estimation when all strategies are applied together. This improve-ment can go up to 68% in the case of block matching. However, if factors that are actually contributing to this improvement are carefully checked in Table 7, one can see that the multi-resolution scheme is the key factor whereas the structural information does not play a relevant role for this transformation approach in block matching. This result confirms the behavior already commented in experiment 3, where the importance of regularization steps to re-duce cumulative errors was pointed out. Regarding the strain ac-curacy for block matching, the results shown in Table 7 compared to those of Table 8 evidence no significant improvement with the multi-resolution scheme which shows that structural information does not provide a better refinement than the one obtained from multi-resolution for strain estimation.
On the other hand, the demons approach shows an overall im-provement when all the strategies are used. When results obtained for demons in Table 7 and Table 8 are compared, one can see that the motion estimation is not significantly increased in met-rics based on difference of intensities. However, those based on ra-tios (GS and GGS) improve their accuracy to almost the same level as the rest of metrics (0.51 mm) with a better ST estimate. These results show that the combination of structural information and the ESM technique increases the motion estimation accuracy (from 0.68 mm and 1.02 mm respectively to 0.51 mm). However, note that the structural information can cause an increase of motion er-ror when the characterization of tissue is poorly estimated in low CNR scenarios (CNR = 1.2), going from 1.49 mm with structural information (Table 6); 1.02 mm with multi-resolution (Table 7) to 1.08 mm with all strategies. This behavior shows that these metrics are more sensitive to structural information and its performance
depends on two important steps of the approach: (1) the regular-ization methodology, which improves with structural information; (2) the optimization scheme, which gets worse when the ESM op-timization method is applied. However, the metrics related as dif-ference of intensities show a different behavior: they are sensitive to the structural information (e.g. from 0.78 m to 0.61 mm, see
Table 6, SSD metric) though the efficient second-order optimiza-tion performs a better result (e.g. from 0.78 m to 0.48 mm, see
Table 8, SSD metric). The combination of both approaches struc-tural information and ESM provides a similar result in motion es-timation, though the strain gets worse due to an excess of regu-larization due to the normalized convolution (e.g. from 2.29% circ. strain, to 1.90% with ESM and 2.07% with both ESM + structural information, see Table 7 and 8, SSD metric).
Most of the errors measured so far have been given as an aver-age of values along time and space. In what follows we try to have a deeper insight on how the errors are distributed along the car-diac cycle. For the sake of simplicity, only two similarity measures are considered (GGS and GGCS) for the demons approach. Results of the experiments 1 and 5 along the cardiac phase are depicted in
Fig. 6. This comparison allows us to see the effect of both metrics throughout the cardiac cycle.
We first focus on the boxplot shown for the higher CNR = 2.5, where there is an increment of the mean error and variance along the cardiac phase due to the frame-to-frame error accumulation as expected. Note that the GGCS measure shows a more robust be-havior with the simple implementation. The error remains below 1 mm with a smaller variance than GGS. This result confirms the importance of considering the logarithmic compression into the metric for motion estimation.
When the complete system is considered (structural informa-tion + ESM), GGCS still outperforms GGS for moinforma-tion, but the differ-ences along the cycle have been reduced due to the influence of a better regularization into the ST accuracy mainly due to the good performance of the ESM technique with metrics based on differ-ences of intensities.
Demons GGS
E " E
P in
L_
LU
0.5
CNR=1.8 CNR=2.5
i
Demons GGCS
\ \
y y.
y-. y-. y-. j
;...-¡^Jon<y..., r
i : : : : : : : : : : : : : : :
""T~t + ; t ! T T t t | } ! i | J
T-I+T-I*T-fH-fii-f
i 4. J. + t i- r T 4J Lr TLrlTLrJT
! : : : : : : : : : : : : : : :
! ! i
1 2 3 4 5 6 7 8 9 10 11 12 13 14 15 16 17 18 19 20 21 22 23 24 25 26 27
Time
£ 1 . 5 E 2 1.0
0.5
0.0
— CNR=1.2 — CNR-1.8 CNR=2.5
:: : 1
!
:
WL
— ! i/^1
Demons GGS All
T T f i ' ' ' ;
i
[ T :
|T| i-h rh A-i . l , - T t T ^ ás- í ! t 1 J T f T U I
t - t ó ^ - ^ : ! : "LtJ li, Lr, LrLr T
i ; ; ; ; ; ; ; ; ; : ; ; ; ; ; ; ; ; ; ; ; ; ; ; ;
1 2 3 4 5 6 7 8 9 10 11 12 13 14 15 16 17 18 19 20 21 22 23 24 25 26 27
Time
£ 1.5 E e i.o LU
— CNR=1.2 — CNR=1.8
CNR=2.5
r
-<--: -<--: 1 j T i g ^ *
Demons GGCS All
+• •>
i
i
!
+ .
1
'
! : : : :
t f r H ^ l - i Í L r ' n r1! T i-h
1 2 3 4 5 6 7 8 9 10 11 12 13 14 15 16 17 18 19 20 21 22 23 24 25 26 27
Time
Fig. 6. Motion error along the cardiac phase for the Straus dataset at different signal to noise ratio (CNR = {1.2,1.8, 2.5}). The boxplots are for the highest signal to noise ratio (CNR = 2.5). The median error for the different noise levels and the end-systole are depicted as color lines and a vertical dash line, respectively.
All in all, results show that a complete system usually improves the accuracy of the estimation of motion and strain. However, the different pieces we use to build the complete system must be care-fully analyzed. Even when each step improves the accuracy, the fi-nal results might be non-optimal. The goodness of each step will strongly depend on the similarity measure used, the transforma-tion method and the optimizatransforma-tion technique. What is more, results show that many times the best solution is obtained by only im-proving one of the steps of the process.
Influence of the pipeline in pathological cases
In order to get a deeper insight of the relation between the in-fluence of the different strategies into the complete ST pipeline, in this section we study the ST accuracy in scenarios with differ-ent pathological cases (four ischemic and two asynchronous) for CNR=2.5. A detailed description about the pathological cases can be found in De Craene et al. (2013).
Fig. 7 shows the global motion error for the ischemic cases and the circumferential strain error for the dyssynchrony cases, where the errors of pathological cases show a similar behavior than those obtained for the normal case. i.e. all the methods have similar mo-tion and strain accuracy with the excepmo-tion of those derived from the intensity ratio (GS and GGS) which seem to be more sensitive. Therefore, the same conclusions derived for the normal case can be applied for pathological cases. So, in summary, the results ob-tained for pathological cases do not offer a different analysis than the one already described for normal cases.
4.6. Discussion on the interdependences
In the previous sections we have seen that the performance of some methods is strongly related to other methods along the ST pipeline. In order to get a better insight into these relations, in this section we summarize results pointed out in previous sections pointing out their interrelations with other steps.
Table 9 shows the partial contribution of each of the methods to the estimation of motion and strain for the metrics GGCS and GGS in order to see the importance of the relationship between intensities on the optimization techniques applied in other stages of the method. The gain of each of the methods is expressed as a percentage. This table clearly shows how different strategies af-fect in a different way the final result. Note that, for the similar-ity measure GGCS, the use of structural information has no effect over the BM approach, while it improves 22% when using demons as was pointed out in experiment 3. This behavior was associated to the lack of a proper regularization scheme in the BM approach, which is confirmed due to the improvement up to 69% obtained when multi-resolution is applied in the BM approach. However, note that the structural information does not provide any further information to the multi-resolution approach since the result ob-tained applying both together remains the almost the same (68.9
%). This behavior evidences that the resolution achieved with
sim-ple block matching is very reduced to describe the comsim-plex defor-mation of the heart. The multi-resolution scheme overcomes par-tially this lack of resolution since it achieves a better following of radial deformation, though the circumferential deformation is poorly estimated and causes a poor circumferential strain estima-tion. A similar conclusion can be obtained for the case of the GGS metric. However, in this case we can observe a reduction of the strain error which is due to the better description of the GGS met-ric to the statistics of speckle.

![Fig. 5. Motion accuracy of the transformation models studied, block matching and demons, for the squared sum of differences along the cardiac phase for the Straus dataset to different signal to noise ratio levels CNR e [1.2, 1.8, 2.5]](https://thumb-us.123doks.com/thumbv2/123dok_es/6823159.835293/10.892.80.836.85.291/accuracy-transformation-studied-matching-squared-differences-cardiac-different.webp)