Counting Malaria Parasites with a two-stage EM based algorithm using
crowsourced data
Margarita Cabrera-Bean , Alba Pagés-Zamora , Carles Diaz-Vilor , Maria Postigo-Camps , Daniel Cuadrado-Sánchez , Miguel Angel Luengo-Oroz
Abstract— Malaria eradication of the worldwide is currently
one of the main WHO's global goals. In this work, we focus on the use of human-machine interaction strategies for low-cost fast reliable malaria diagnostic based on a crowdsourced approach. The addressed technical problem consists in detecting spots in images even under very harsh conditions when positive objects are very similar to some artifacts. The clicks or tags delivered by several annotators labeling an image are modeled as a robust finite mixture, and techniques based on the Expectation-Maximization (EM) algorithm are proposed for accurately counting malaria parasites on thick blood smears obtained by microscopic Giemsa-stained techniques. This ap-proach outperforms other traditional methods as it is shown through experimentation with real data.
Index Terms—Crowdsourcing, Malaria thick smear, EM
algorithm, robust clustering.
I. INTRODUCTION
Malaria is a serious infectious disease that is widespread in tropical and subtropical regions around the equator. Manual microscopic examination of Giemsa-stained thick and thin blood films is the gold standard approach to diagnose this disease. However, reliable detection of malaria parasites in microscopic images demands for trained technicians result-ing in a very expensive and time consumresult-ing strategy. There-fore, automated methods for enumeration and identification of malaria parasites in an unsupervised manner are highly advised (see [1] for a comprehensive review).
The vast majority of automated processes have been developed using thin blood films since the parasite specie of the infection becomes easier to identify as the parasites remain inside Red Blood Cells (RBCs). Thus, different image processing strategies using thin blood films are found in [2], [3], [4], [5], [6], and most of them follow a similar workflow. After the image acquisition and digitalization there is a pre-processing or filtering step to reduce the noise and smooth the image. Afterwards, in the image segmentation step, RBCs are delimited using, for instance, circular Hough transform [2], Otsu thresholding and watershed [3] or gradient edge techniques [4], [5]. The feature extraction step, generally,
consists on assigning some features related to size or color to each identified potential RBC, and finally, in the classifier step, the parasites are sorted into species by applying a classification algorithm, such as SVM [3], a feedforward Neural Network (NN) [5] or a recursive NN [6].
Still, the reliability in detecting and counting parasites is higher with thick blood films due to its higher concentration of parasites. For instance, this is exploited in [7] where, after an image segmentation process, the stained chromatin regions are identified as potential parasites, and their size is used as the feature to classify them into positive or negative. Accuracy achieved both on positive and negative rate outperforms, in some cases, automated methods using thin films.
To the best of our knowledge, [8] and [9] are two innova-tive projects that have gone one step further in the automation process of malaria diagnostics by the development of human-machine algorithms based on processing crowdsourced data. Through dedicated on-line gaming platforms, these projects offer digitized blood images through the web to volunteers who deliver their tags to be processed by a central de-cision algorithm. Whereas in [8], [10] single-cell images of thin smears are uploaded to the platform and a binary decision on each RBC is taken based on multiple gamers, the approach in [9] is based on a new tool for parasite counting on thick blood smears. In [9], clicks of several gamers located around the same position and pointing at potential parasites are firstly grouped together. A quorum algorithm is implemented afterwards to label each group as positive or negative. Although good accuracy results were reported in [9], some open issues remain unsolved as the analysis of crowdsourcing potential to count parasites with more heterogeneous recorded images and the exploration of more complex algorithms to combine the clicks of several gamers. Our work addresses these challenges, analyzing images taken from thick blood smears in heterogeneous environment conditions and applying strategies based on the Expectation-Maximization (EM) algorithm [11] in both, the potential parasites identification stage and the final labeling process of each potential parasite.
II. TWO-STEP ALGORITHM
Our approach consists of two stages: an unsupervised soft clustering of the tags where potential parasites are identified, followed by a labeling of those potential parasites for a final decision. The algorithm for the first stage has been presented by one of the authors and tested with synthetic data in [12], whereas for the second stage we design a detection algorithm based on [13], considered a pioneering work on latent variable models applied to crowdsourcing. In this work, these two algorithms are linked together and tested on Malaria parasite quantification using crowdsourced data. For the sake of clarity, we continue with some notation and a brief description of the proposed clustering algorithm. Afterwards, we present an intermediate step that links the results of the clustering stage to the detection stage, and finally we present the detection stage.
A. Clustering Stage
Let's assume that clicks of R gamers tagging a digitized microscopic blood image are available. The number of clicks delivered by the rth gamer is denoted by Nr for r =
1, • • • , R, and the set of clicks of gamer r is given by A7,, :=
{xr¡i £ R2 x l; V i = 1, ..,Nr}. Fig. 1 shows with crosses the
clicks of 20 gamers in an image. These clicks are modeled as a mixture of M Gaussian components, which correspond to the potential malaria parasites, plus a uniformly distributed random variable that captures outliers corresponding to tags marked by inexpert or malicious gamers. Assuming indepen-dence among gamers, the likelihood function of all clicks
X := {X\, • • • , XR\ is therefore given by
R Nr M
*Er,ii tymi 2-*m) r=l i=l ?7i=l
+ (1 -Pr)gu(Xrti) (1)
where N{xr¿\ pm, Sm) is the likelihood function of click
xr¡i given the mth Gaussian component with mean pm
and covariance matrix Sm for m = 1 , . . . , M; {7rm; Vm =
1, • • • , M} are the probability of occurrence of the Gaussian components or potential parasites; gu(-) is the pdf of a 2-dimensional uniformly distributed random variable with support the set of pixels' coordinates of the image; and
{pr;Vr=l, • • • , R} is the probability that a click provided
by gamer r corresponds to one potential parasite. Vector 6\ gathers the set of all unknown parameters, namely
61:=[M;ii1;...;iiM;vec('£,1);...;vec('£,M);TT1;...;TTM;p1;...;pR}.
(2) Interestingly, the set of parameters {iv;Vr = 1,---,R} provides gamers' reliability; the more pr is close to 1, the
more reliable is the rth gamer.
The clustering algorithm presented in [12] estimates the parameter vector in (2) by maximizing the log-likelihood function in (1) using a numerical approach based on the EM algorithm. The proposed algorithm initializes #i con-veniently, and operates in an iterative fashion alternat-ing between an expectation (E) step and a maximization
(M) step. In the £-step it basically updates the value of
{ar i;Vr,«}, which denotes the a posteriori probability that
click {a:r,¿;Vr, i} corresponds to a potential parasite given
a previous parameter estimate. In the Af-step the parameter estimates in (2) are updated for being used in the next iteration. The estimation of the number of Gaussian com-ponents or potential parasites M is incorporated into the algorithm by: (a) assuming a Dirichlet-type prior for the {7rm; Vm=l, • • • , M} that promotes sparsity in the mixture,
and (b) computing the Bayesian Information Criterion as a criterion to terminate EM iterations and to select M. Further details of the algorithm can be found in [12]. The clustering algorithm obtains an estimated value of the parameters which is denoted by 6\, in such a way that not only assigns soft labels of each tag to clusters, but also rates gamers according to their performance, given by {j3r;Vr = 1, • • • ,R}, and
estimates the optimum number of potential parasites in M.
B. Intermediate Step
After clustering, some preliminary tasks are implemented before the detection algorithm. Firstly low reliable tags, i.e.,
{xr¡i; Vr, i} such that ár¡i < 0.5, are discarded from the data
set. Then, a set of vectors {ym £ Rf i x l; Vm = 1, • • • , M},
is generated such that the rth entry yTm = 1 if there exists a
tag xr¿ £ Xr that satisfies
ftmN(xr,i; fim, Sm) > 7rnAf(xrti;fin,'En);Wn^m 'KvrJ* \Xr^ij P m o ^m) ^ TTmV* \Xr,ji P m o - ^ m j : *3 T1 ^
Otherwise, yTm = 0. So, the click associated to
the mth Gaussian component if the Maximum A Posterior
probability of click xr¡i given the mth Gaussian component
is the highest with respect to the set of clicks Xr of the
gamer rth and is the highest with respect to the Gaussian
component nth,Vn £ {Í...M}. Vector ym can be seen
as a set of R binary labels given by the gamers to the
mth potential parasite. So, after assigning labels following
the previous procedure, the data set in the second stage is
y:={yi,...,VM}.
C. Detection Stage
In the detection stage, we apply an EM algorithm based on the work in [13]. This algorithm infers the gamers accuracy in terms of the sensitivity and specificity parameters, the prior probabilities and the unobserved true labels from the gamers' tags in a jointly manner. In our case, the distribution of each vector ym is modeled as a mixture of two
fi-dimensional Bernoulli distributions, the positive if the mth
potential parasite has been generated by a true parasite and the negative otherwise, with ¡i and (1 - ¡i) as their prior probabilities. We associate these probabilities to a binary random variable w, i.e. Pr{uj = 1} = ¡J,. The likelihood function of the data set y is then parametrized by 62 •= {/x,pi,po} where { p i , p0} £ RRxl model the
and r = 1 , . . . , R. Under these assumptions the likelihood function of the dataset y is
M
h(y;02)= I ] UBi(ym;pi) + (i-M)Bo(ym;po) (3)
where Bk(ym',Pk) is the conditioned probability function of
a multivariate Bernoulli distribution, i.e., for k e {0,1} and m = 1,...,M,
R
B1(ym;Pl) = l[(pi)y^(i-p^1 -yrm)
r=\ R
B0(ym,Po) = n(/°o)( 1"w ;')(i -Po)y
-Since a closed-form maximization of f2(y; 02) is not
pos-sible, we resort to the EM algorithm. For this, we associate a latent variable vm = {0,1} with each vector ym so that if
vm = 1 means that the mth cluster is a parasite, and vm = 0
otherwise. The complete likelihood function is given in (4).
f(y,v-,e
2) =
Mn (A*Bi(ym;Pi)rm((i -M)Bo(ym;PO)) ( i - «m)
(4)
where V := {«i, . . . , « ¿ } is estimated by iterating till convergence steps (5) and (6).
• £-Step: The expectation of the logarithm of the likeli-hood function in (4) with respect to the latent variables conditioned to the observed variables y and given a previous estimate of 62 is obtained.
Q(82;82) = Evlog( f(y,V;82))
This step basically requires the computation of the posterior probability of the latent variables as follows.
Pr{vm = \\y-e2}
A*-Bi(2/m; P i )
(5)
M-Bi(ym; pi) + (l - iJ-)B0(ym; po)
• Af-Step: The conditional expectation obtained in the E-step is maximized with respect to the parameters 6-2 i.e. 62 = argmaxe2 Q(62;62) and leads to
Pi = Z ^ m = l vmym .
1 M
7 7 1 = 1
~r E m = l ( ! - « m ) ( l - ¿ ) ™ M
Em =l ( l - « m )
(6)
To improve the robustness of the overall procedure, the initial value of the variables im, V m are computed from the
estimated probabilities of the M potential parasites identified in the first stage, as vm = 77rm, where 7 is a normalization
constant that sets the maximum value in V to 1.
The final hard counting of the parasites is obtained by quantifying the soft label vm to {0,1}, i.e. if vm > 0.5
the mth potential parasite is labeled as positive, otherwise is
labeled as negative.
III. RESULTS AND DISCUSSION
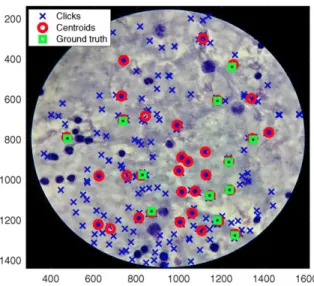
In this section, we apply the two-stage algorithm to digitized images that were tagged by volunteers through the MalariaSpot platform [9]. The first digitized smear (Fig. 1) comes from the Health Investigation Centre of Manhica, Mozambique. For the acquisition of the image, the Malar-iaSpot team used a Nokia Xperia Z2, a conventional light microscope (Zeiss, model AX05COP2), and a on market plastic adapter to attach and align the cellphone camera to the ocular lens of the microscope. It is important to note that using mobile phones decreases image quality compared to using the standard technology for clinical image acquisition. This is an extra challenge to the study. The digitized smears have been analyzed more than 5,000 times by non-expert volunteers. The ground truth were previously identified and located by experts in this image.
A second image is presented in Fig. 2. It has been recorded by the standard method, a camera mounted on the microscope. This image is better quality so it has been included in this work as a benchmark example.
To analyze the results we count true/false posi-tives/negatives denoted by TP, FP, TN and FN. For instance, TPC denotes true positives after the clustering
stage and FNd denotes false negatives after the detection
stage. Variable Np denotes the number of parasites or ground
truth. Using these measures, results are presented through the sensitivity, i.e. the fraction of ground truth that are identified as parasites and denoted as Sc at the clustering stage and as
Sd at the detection stage. Similarly we give the precision at
the clustering stage, Pc, as the fraction of potential parasites
that are positive and the precision at the detection stage, Pd,
as the fraction of diagnosed parasites that are positive indeed.
Sc = TP C
sa
Np '
TPd
Pc = Tpc
Tpc 1 ppc '
N„ pd
TPd (7)
TPd + FPd
A. Clustering results
In Fig. 1 we show results of one single trial for the Outliers-EM (OEM) algorithm presented in Section II-A, ap-plied over a thick blood smear. The ground truth consists of
Np = 12 parasites. The OEM algorithm was initialized with
M = 50 centroids. By processing the clicks of 20 gamers, M = 33 potential parasites (final number of centroids) were
identified, divided into 12 TPC and 21 FPC. A second
example with Np = 14 parasites, is shown in Fig. 2, where
processing the clicks of 21 volunteers, M = 18 potential parasites (final number of centroids) were identified, divided into 14 TPC and 4 FPC.
POO 400 600 800 1000 1200 1400
| X Clicks W ^ ^ ^ ^ J ^ ^
O Centroids L x ^ ^ ^ ^ ^ ^ ^ ^ ^ H
D Ground truth \ v J »\, ^ ^ ^ ^ ^ ^ H
^ r
x *
^
^ B
V ^ H
P
xx
> •
x
x xx (r*
*&
m
1
x\
•
*
in 0\
mx
> •
kk
* >$<
ap«
xx^»0 ^
*
^
^3^f.-fc¡*s¿ii
fckL*>x
^ x xJ" "x^JÜJÉ
^ ^ ^TABLE I
CLUSTERING SENSITIVITY&PRECISION. IMAGES II ( F I G . 1), 12 ( F I G . 2)
400 600 800 1000 1200 1400 1600
Fig. 1. Example using the clicks delivered by 20 gamers; Ground Truth and Potential Parasites (Centroids).
100 •A)() 300 400 500 600 700 800 900 1000 X
o
Di § I X
-_**x -1 Clicks Centroids Ground truth X y
3*
X X &A
X X • (XX>o , •
x<x x
& X X X • < X
\ ' " ^ x X
m
' • x
•
X
I I I <f>x X * X X J JÉ lífí ' • ^ 1
J
x&j
X J
J
x x
200 400 600 800 1000 1200
Fig. 2. Example using the clicks delivered by 11 gamers; Ground Truth and Potential Parasites (Centroids).
using 20 and 50 gamers and averaging 1000 random trials. In each trial the games have been selected at random. For OEM and EMC the number of potential parasites is equal to Mc = M, whereas for K-means the number of potential
parasites Mc is the number of clusters and has been selected
as twice the average number of clicks per gamer. Notice that at the clustering stage it is crucial to achieve a large sensitivity in order to not miss true parasites, otherwise there would be no option to identify them in the second stage. At a lesser extent, higher values of precision are preferred to improve results after the detection stage. As it can be seen in Table I, OEM outperforms the other two algorithms both in sensitivity and in precision. Interestingly, using 50 gamers, the sensitivity of OEM is almost equal to 1 meaning that the identified potential parasites include all ground truth after the clustering stage without decreasing
Clustering Stage K-Means 11 EMC 11 OEM 11 K-Means 12 EMC 12 OEM 12 Sc 20 gamers 0.6933 0.6525 0.9350 0.9900 0.9391 0.9989 pc 20 gamer) 0.2608 0.3087 0.4265 0.4243 0.8539 0.9084 Sc 50 gamers 0.7025 0.8108 0.9992 0.9855 0.9586 1 pc 50 gamers 0.2607 0.1860 0.2782 0.4211 0.4935 0.5150
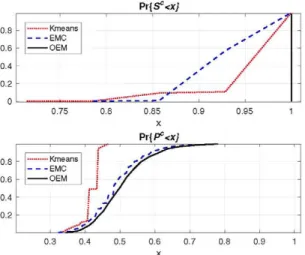
precision significantly. This conclusion is more consistently supported in Fig. 3 where the Empirical Cumulative Density Functions are plotted for both, Sc and Pc. As it can be seen,
OEM shows the higher sensitivity and precision.
Pr{Sc<x;
1
\S Ml^nnr.
EMC OEM
, ...^...£-¿¡-—•1
*•**' ..f 1 / ' • • ' " " "
^ ' "
• • • /
/
0.5
0.3 0.4 0.5 0.6 0.7 0.8 0.9
x Pr{Pc<x}
1 1 1 1 1 t. /
•1
T
K-Means EMC OEM
, ,
0.1 0.2 0.3 0.4 0.5 0.6 0.7 0.8 0.9 1
x
Fig. 3. Sc (Top) and Pc (Bottom) Empirical Cumulative Density
Functions, 50 gamers. Clustering stage. Image shown in Fig. 1
The performance of the clustering stage, concerning the benchmark image shown in Fig. 2 (12) is shown in table I and Fig. 4, and it outperforms the results obtained with image in Fig. 1 (II) as expected.
B. Detection results
The performance of the detection stage is analyzed both with data obtained using image shown in Fig. 1 and with data obtained using image shown in Fig. 2. We have run
1000 random trials. In each one, after applying the OEM algorithm at the clustering stage the EM detection algorithm presented in subsection II-B has been checked and compared to the well known majority voting (MV) rule in terms of the measured sensitivity Sd and precision Pd. To give a single
quality measure we have also computed the average F-score (8), since frequently an algorithm outperforms in sensitivity but not in precision or vice versa.
_ 2SdPd
Fs ~ S*TP¿ ( 8 )
Pr(Sc<xj
EMC OEM
• V
»t-*• •
' / /
Pr{P°<x;
—
•• «means -EMC - O E M
0.4 - \ i.
0.2 j < /
0.3 0.4 0.5 0.6 0.7 0.8 0.9 1
X
Fig. 4. Sc (Top) and Pc (Bottom) Empirical Cumulative Density
Functions, 50 gamers. Clustering stage. Image shown in Fig. 2
TABLE II
DETECTION SENSITIVITY & PRECISION. IMAGES II (FIG. 1), 12 (FIG. 2)
Detection Stage
MV 11 E M U
MV 12 EM 12
21 gamers Sd
0.5699 0.7098
0.9899 0.9185
21 gamers
pd
0.8390 0.8068
0.9877 0.9917
51 gamers Sd
0.5724 0.8253
0.9364 0.9406
51 gamers
pd
0.8645 0.8017
0.9747 0.9738
obtained at the clustering stage, there is a trade-off, i.e. at the detection stage the precision is improved at the expense of worsen the sensitivity obtained at the clustering stage. From the average F-score (8) shown in table III we can conclude that EM and MV provide similar results when the clustering stage works very well as with Fig.2 However, EM clearly outperforms MV when results after clustering are worse, as in Fig. 1 where images are measured in noisy conditions or with decreased quality cameras.
IV CONCLUSIONS
This paper addresses the problem of quantification of malaria parasites in thick blood smears. A novel robust unsupervised clustering and detection approach is proposed to efficiently detect parasites present in crowdsourced im-ages. The method delivers not only parasite positions but also annotators' reliability, and shows improved performance compared to previous strategies. The method is tested and validated using real experimental data. The images analyzed are middle-parasitemia. Deeper analysis is required to adapt the algorithms to low and high parasitemias.
REFERENCES
[1] S. Nag, N. Basu, and S. Bandyopadhyay. "Differ-ent Methods for Diagnosing Malaria Disease". In:
IJCMPR 2.1 (2016), pp. 197-201.
TABLE III
DETECTION F-SCORE
Gamers
MVI1 EM 11
21
0.6677 0.7407
51
0.6831 0.7619
Gamers
MVI2 EM 12
21
0.9886 0.9645
51
0.9543 0.9558
[2] Y. Purwar et al. "Automated and Unsupervised Detec-tion of Malarial Parasites in Microscopic Images". In:
Malaria journal 10.1 (2011), pp. 1-10.
[3] SS Savkare and SP Narote. "Automatic detection of malaria parasites for estimating parasitemia". In:
In-ternational Journal of Computer Science and Security (IJCSS) 5.3 (2011), p. 310.
[4] P T Suradkar. "Detection of malarial parasite in blood using image processing". In: International Journal of
Engineering and Innovative Technology (IJEIT) 2.10
(2013).
[5] S. Raviraja et al. "The Classification and Recognition of Plasmodium Parasite.." In: IJARCSSE 5.7 (2015), pp. 863-886.
[6] M. I. Razzak. "Malarial parasite classification using recurrent neural network". In: International Journal
of Image Processing (IJIP) 9.2 (2015), p. 69.
[7] S. Kaewkamnerd et al. "An automatic device for detection and classification of malaria parasite species in thick blood film". In: Bmc Bioinformatics 13.17 (2012), p. 1.
[8] S Mavandadi et al. "Distributed Medical Image Anal-ysis and Diagnosis through Crowd-Sourced Games: A". In: PloS one 7.5 (2012), e37245.
[9] M. A. Luengo-Oroz, A. Arranz, and J. Frean. "Crowd-sourcing Malaria Parasite Quantification: An Online Game for Analyzing Images of Infected Thick Blood Smears". In: / Med Internet Res 14.6 (Nov. 2012), el67. DOI: 10 . 2 1 9 6 / j m i r . 2338. URL: h t t p :
/ /w w w . j m i r . o r g / 2 0 1 2 / 6 / e l 6 7 / .
[10] S. Mavandadi et al. "A mathematical framework for combining decisions of multiple experts toward ac-curate and remote diagnosis of malaria using tele-microscopy". In: PloS one 7.10 (2012), e46192. [11] A. P. Dempster, N. M. Laird, and D. B. Rubin.
"Maximum likelihood from incomplete data via the EM algorithm". In: Journal of the royal statistical
society. Series B (methodological) (1977), pp. 1-38.
[12] A. Pages-Zamora et al. "Robust Clustering of Data Collected via Crowdsourcing". In: Proceedings. New Orleans: IEEE, Mar. 2017, pp. 1^1. DOI: 0.
[13] A. P. Dawid and A. M. Skene. "Maximum likelihood estimation of observer error-rates using the EM algo-rithm". In: Applied statistics (1979), pp. 20-28. [14] M. A. T. Figueiredo and A. K. Jain. "Unsupervised
learning of finite mixture models". In: IEEE
Trans-actions on pattern analysis and machine intelligence