R E S E A R C H A R T I C L E
Open Access
Comparison of body mass index (BMI) with
the CUN-BAE body adiposity estimator in
the prediction of hypertension and type 2
diabetes
Vicente Martín
1,2, Verónica Dávila-Batista
1,12*, Jesús Castilla
2,3, Pere Godoy
2,4, Miguel Delgado-Rodríguez
2,5,
Nuria Soldevila
2, Antonio J. Molina
1, Tania Fernandez-Villa
1, Jenaro Astray
6, Ady Castro
7, Fernando González-Candelas
2,8,
José María Mayoral
9, José María Quintana
2,10, Angela Domínguez
2,11and CIBERESP Cases and Controls in Pandemic
Influenza Working Group, Spain
Abstract
Background:Obesity is a world-wide epidemic whose prevalence is underestimated by BMI measurements, but
CUN-BAE (Clínica Universidad de Navarra - Body Adiposity Estimator) estimates the percentage of body fat (BF) while incorporating information on sex and age, thus giving a better match. Our aim is to compare the BMI and CUN-BAE in determining the population attributable fraction (AFp) for obesity as a cause of chronic diseases.
Methods:We calculated the Pearson correlation coefficient between BMI and CUN-BAE, the Kappa index and the
internal validity of the BMI. The risks of arterial hypertension (AHT) and diabetes mellitus (DM) and the AFp for obesity were assessed using both the BMI and CUN-BAE.
Results:3888 white subjects were investigated. The overall correlation between BMI and CUN-BAE was R2= 0.48, which improved when sex and age were taken into account (R2> 0.90). The Kappa coefficient for diagnosis of obesity was low (28.7 %). The AFp was 50 % higher for DM and double for AHT when CUN-BAE was used.
Conclusions:The overall correlation between BMI and CUN-BAE was not good. The AFp of obesity for AHT and
DM may be underestimated if assessed using the BMI, as may the prevalence of obesity when estimated from the percentage of BF.
Keywords:Obesity, Body mass index, Body fat, CUN-BAE, Population attributable fraction, Hypertension, Diabetes mellitus
Background
Obesity is seen as an emerging epidemic around the world because it represents a growing threat to the health of the population. It is a complex disease consist-ing of an excess or abnormal distribution or both of adi-pose tissue, giving rise to metabolic and endocrine alterations and changes in the immune system, resulting
in increased morbidity and mortality and a lower life expectation [1, 2]. Moreover, excess body fat (BF) is known to be associated with cardiovascular diseases and diabetes [3].
The body mass index (BMI) is the most frequently used measurement for diagnosing obesity, because of its simplicity and reliability. However, the BMI underesti-mates the prevalence of obesity by 50 %, in comparison with direct measurement techniques of adipose; its rela-tionship with adiposity is influenced by age, sex and race [1, 4–7].
In this regard, an alternative for whites is the CUN-BAE (Clínica Universidad de Navarra - Body Adiposity * Correspondence:[email protected]
1
Grupo de Investigación Interacciones Gen-Ambiente y Salud - Universidad de León (Gigas), León, Spain
12Facultad de Ciencias de la Salud. Campus de Vegazana. Universidad de León, 24071 León, Spain
Full list of author information is available at the end of the article
Estimator), which gives a closer correlation between adi-posity and cardiovascular factors than BMI, improving our understanding of the impact of obesity levels on these chronic diseases [8].
Our aim is to compare the BMI and CUN-BAE and evaluation the population attributable fraction (AFp) for obesity as a cause of hypertension and type 2 diabetes.
Methods
Population studied
The present study incorporated all the white patients taking part in the cross-sectional project concerning the Risk Factors of Infuenza A(H1N1) in the 2009–10 and 2010–11 seasons aged over eighteen with a BMI≥ 18.5 kg/m2, with the exception of pregnant women. The project involved twenty-nine hospitals in seven Spanish autonomous regions and nine research groups in CIBER-ESP, the Spanish Consortium for Biomedical Research in Epidemiology and Public Health [9].
Anthropometrical measurements
The body mass index (BMI) was calculated in the stand-ard way as kg/m2. Patients were classified by BMI accord-ing to the criteria of the World Health Organization (WHO) and the Spanish Society for the Study of Obesity, with obesity being taken to be a BMI of 30 kg/m2or more for both sexes [10, 11].
The CUN-BAE figure was then calculated, using the following equation [8]:
% BF¼‐44:988þ ð0:503ageÞ þ ð10:689sexÞ þ ð3:172BMIÞ‐ð0:026BMI2Þ
þ ð0:181BMIsexÞ‐ð0:02BMIageÞ
‐0:005BMI2sexÞ þ0:00021BMI2ageÞ
where age was in years, and sex was coded as 0 for men and 1 for women. Obesity was taken to be a percentage of BF≥25 % in males and≥35 % in women, increments of 5 % being used to divide categories [8, 12, 13].
Subjects were defined as hypertensive (AHT) or as having type 2 diabetes mellitus (DM) if they had previ-ously been diagnosed for either.
Statistical analyses
Agreement between BMI and CUN-BAE was assessed by means of the Pearson correlation coefficient. The Kappa coefficient and its index of coincidence at 95 % were calculated so as to classify patients as obese or not using both methods of determining obesity. All the ana-lyses involved grouping by sex and into the two age bands of under 50 and 50 plus.
Association of type 2 diabetes mellitus (DM) or arter-ial hypertension (AHT) to BF was assessed using the
two methods for calculating body fat. The comparative standard adopted was the normal weight category [2, 8], and the level of risk (crude odds ratio, cOR) was calcu-lated for each of the distribution categories. By means of a logistic regression model adjusted odds ratio (aOR) figures were reckoned for the risk of AHT and DM by including in the model details of education, marital sta-tus and tobacco and alcohol use. Age was factored into the BMI analyses, but not into CUN-BAE, which already includes it. All these analyses were grouped by sex.
Calculation of the population attributable fraction (AFp) for AHT and DM in the BMI and CUN-BAE cat-egories was on the basis of the following formula expressed as a percentage [14]:
1−Xklðpd=aORÞ
where pd is the proportion of those suffering from the ailments at the level of exposure, and aOR is the ad-justed odds ratio.
Data analysis was performed with the Stata/SE 13 soft-ware package.
Data confidentiality and ethical considerations
All information collected was treated as confidential under the observational studies law. The study was approved by the Ethics Committee of the hospitals in-volved: Clinical Research Ethics Committee, Hospital Costa del Sol; Autonomous Clinical Trials Committee of Andalusia; Clinical Research Ethics Committee, Complejo Asistencial Universitario de León; Clinical Research Ethics Committee, Municipal Institute of Healthcare (CEIC-IMAS); Clinical Research Ethics Committee, Corporación Sanitaria ParcTaulí of Sabadell; Research Committee, Sant Joan de Déu University Hospital; Clinical Research Ethics Committee, Basque Country; Clinical Research Ethics Committee, Doctor Peset Univeristy Hospital, Valencia; and, Clinical Research Ethics Committee, Clinical Re-search Ethics Committee, General Directorate of Public Health, Valencia. Written informed consent was obtained from all patients.
Results
A total of 3888 patients were studied: 2033 men with an average age of 50.7 years, and 1855 women with an aver-age aver-age of 49.6 years. The averaver-age BMI was 26.9 kg/m2 for the men and 26.3 kg/m2for the women. The average CUN-BAE was 27.1 % of BF for the men and 37.6 % for the women.
This improvement was even greater when age (under 50 or 50 plus) was also considered, when R2was greater than 0.92 (Table 1).
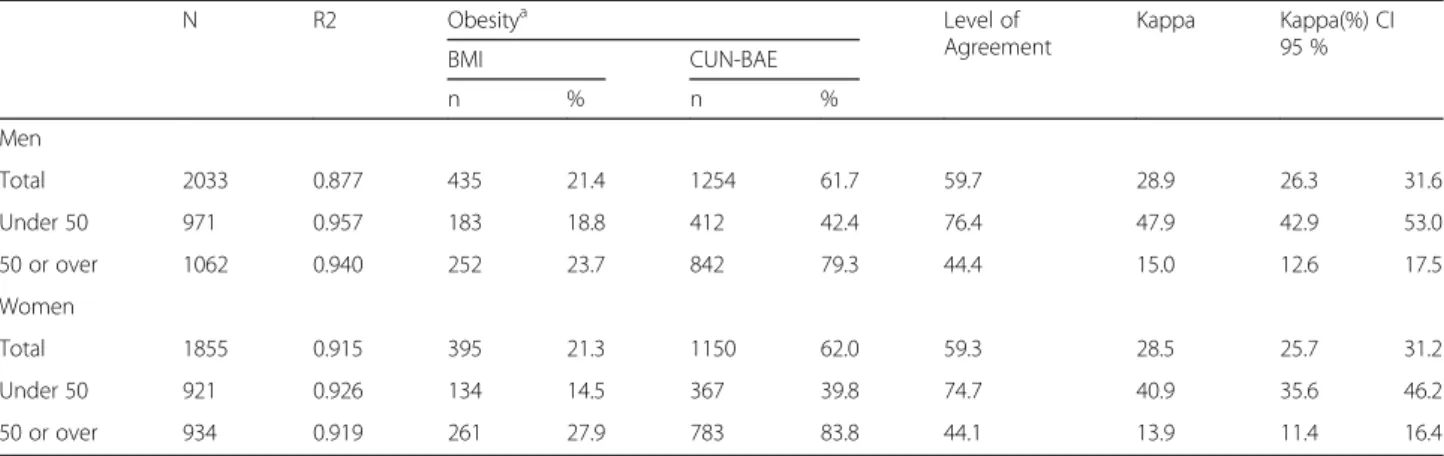
The degree of agreement measured by the Kappa coef-ficient for diagnosis of obesity was low (28.7 %), similar for both sexes and somewhat better for those under 50 than the others. This low level of agreement with BMI explains the different prevalence of obesity noted in ac-cordance with the criterion used. In all cases the
prevalence of obesity as based on the estimation of body fat CUN-BAE is three times higher than the BMI would suggest.
Table 2 and Fig. 2 show that as the figures for both BMI and CUN-BAE increased, so did the prevalence of AHT and the aOR values. However, this gradient was more evident with CUN-BAE than with BMI, basically owing to a lesser prevalence of AHT in the normal weight group based on the criterion of estimated body
Fig. 1Distribution for CUN-BAE and BMI. Straight-Line Equation and Correlation by Sex and Age
Table 1Correlation and degree of agreement between CUN-BAE and BMI and prevalence of obesity according to sex and age groups
N R2 Obesitya Level of
Agreement
Kappa Kappa(%) CI 95 %
BMI CUN-BAE
n % n %
Men
Total 2033 0.877 435 21.4 1254 61.7 59.7 28.9 26.3 31.6
Under 50 971 0.957 183 18.8 412 42.4 76.4 47.9 42.9 53.0
50 or over 1062 0.940 252 23.7 842 79.3 44.4 15.0 12.6 17.5
Women
Total 1855 0.915 395 21.3 1150 62.0 59.3 28.5 25.7 31.2
Under 50 921 0.926 134 14.5 367 39.8 74.7 40.9 35.6 46.2
50 or over 934 0.919 261 27.9 783 83.8 44.1 13.9 11.4 16.4
a
Obesity: BMI≥30 kg/m2, CUN-BAE≥25 % body fat in men and 25 % in women
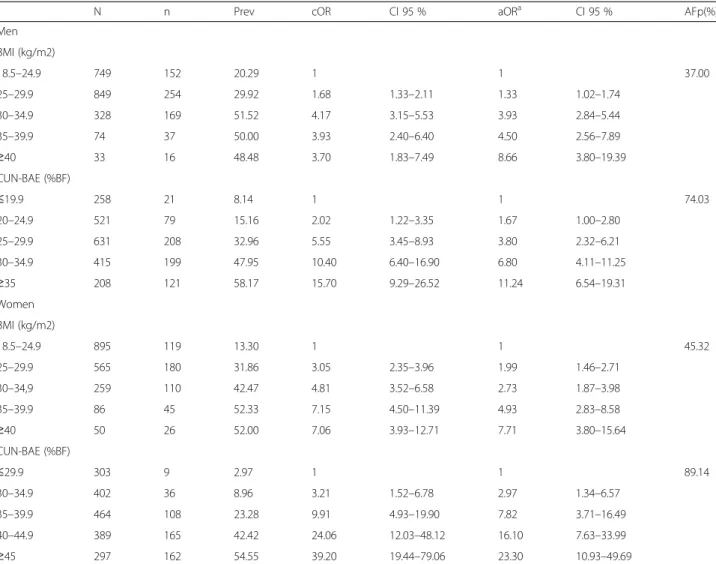
Table 2Distribution of prevalence and risk of hypertension by sex according to BMI and CUN-BAE
N n Prev cOR CI 95 % aORa CI 95 % AFp(%)
Men
BMI (kg/m2)
18.5–24.9 749 152 20.29 1 1 37.00
25–29.9 849 254 29.92 1.68 1.33–2.11 1.33 1.02–1.74
30–34.9 328 169 51.52 4.17 3.15–5.53 3.93 2.84–5.44
35–39.9 74 37 50.00 3.93 2.40–6.40 4.50 2.56–7.89
≥40 33 16 48.48 3.70 1.83–7.49 8.66 3.80–19.39
CUN-BAE (%BF)
≤19.9 258 21 8.14 1 1 74.03
20–24.9 521 79 15.16 2.02 1.22–3.35 1.67 1.00–2.80
25–29.9 631 208 32.96 5.55 3.45–8.93 3.80 2.32–6.21
30–34.9 415 199 47.95 10.40 6.40–16.90 6.80 4.11–11.25
≥35 208 121 58.17 15.70 9.29–26.52 11.24 6.54–19.31
Women
BMI (kg/m2)
18.5–24.9 895 119 13.30 1 1 45.32
25–29.9 565 180 31.86 3.05 2.35–3.96 1.99 1.46–2.71
30–34,9 259 110 42.47 4.81 3.52–6.58 2.73 1.87–3.98
35–39.9 86 45 52.33 7.15 4.50–11.39 4.93 2.83–8.58
≥40 50 26 52.00 7.06 3.93–12.71 7.71 3.80–15.64
CUN-BAE (%BF)
≤29.9 303 9 2.97 1 1 89.14
30–34.9 402 36 8.96 3.21 1.52–6.78 2.97 1.34–6.57
35–39.9 464 108 23.28 9.91 4.93–19.90 7.82 3.71–16.49
40–44.9 389 165 42.42 24.06 12.03–48.12 16.10 7.63–33.99
≥45 297 162 54.55 39.20 19.44–79.06 23.30 10.93–49.69
a
aOR: BMI (age, educational level, marital status, tobacco and alcohol use); CUN-BAE (educational level, marital status, tobacco and alcohol use)
Abbreviations:CIconfidence interval,aORadjusted odds ratio,AFppopulation attributable fraction,BMIbody mass index,CUN-BAEClínica Universidad de Navarra - Body Adiposity Estimator,BFbody fat
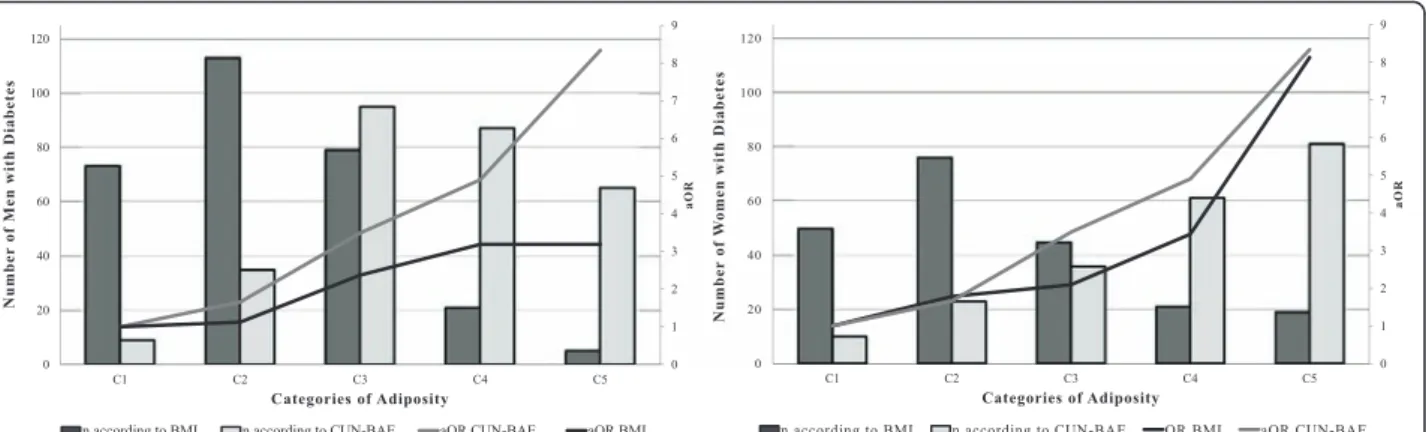
Fig. 2Distribution of Number of Cases of hypertension and aOR, by sex. Legends: Categories of Adiposity: With BMI (C1: 18,5–24.9, C2:
fat (8.1 % and 3.0 % in men and women respectively) than when based on BMI (20.3 % and 13.3 % in men and women respectively). The AFp of AHT assigned to the two methods of assessing adiposity was found to be double for both men and women for CUN-BAE in com-parison with BMI (37.0 % and 45.4 % with BMI; 74.0 % and 89.1 % with CUN-BAE for men and women, re-spectively). In men this difference is due to the differing distributions of cases with the two methods of evaluating adiposity, and a mixture of this and differences in risks in the case of women.
Table 3 and Fig. 3 show how prevalence and aOR figures for DM increase according to the category of obesity in both sexes for CUN-BAE and in women for BMI. This gradient is more obvious with CUN-BAE than with BMI for men and similar for the two among women, although they yield different distributions. Re-garding the AFp of DM the CUN-BAE almost tripled
the attributable percentage in comparison with BMI in men (71.54 % as opposed to 26.19 %), while for women the figure was 50 % higher (65.19 % as opposed to 40.38 %).
Discussion
The correlation found between BMI and CUN-BAE in overall analyses was not good (R2= 0.48). This coincides with the findings of Romero-Corral et al. and Sardinhha et al., who also noted a low overall agreement (R2 of 0.40 to 0.47) between BMI and the percentage of BF assessed by bio-electric impedance [7, 15]. This poor correlation is explained by the fact that adiposity is dependent upon sex and age. It is well known that with the same BMI women and more elderly subjects have a greater percentage of BF [15–18]. This same fact also ex-plains the improvement in correlation when sex, age, or both are factored into the figures. This was also
Table 3Distribution of prevalence and risk of diabetes II by sex according to BMI and CUN-BAE, 2009–2011
N n Prev cOR CI 95 % aORa CI 95 % AFp(%)
MEN
IMC
18.5–24.9 749 73 9.75 1 1 26.19
25–29.9 849 113 13.31 1.42 1.04–1.94 1.13 0.80–1.58
30–34,9 328 79 24.09 2.94 2.07–4.17 2.37 1.62–3.48
35–39.9 74 21 28.38 2.97 1.80–4.92 3.19 1.83–5.55
≥40 33 5 15.15
CUN-BAE
≤19.9 258 9 3.49 1 1 71.54
20–24.9 521 35 6.72 1.99 0.94–4.21 1.66 0.78–3.55
25–29.9 631 95 15.06 4.90 2.44–9.87 3.49 1.70–7.16
30–34.9 415 87 20.96 7.34 3.62–14.86 4.91 2.37–10.14
≥35 208 65 31.25 12.58 6.08–26.01 8.34 3.96–17.56
WOMEN
IMC
18.5–24.9 895 50 5.59 1 1 40.38
25–29.9 565 76 13.45 2.63 1.81–3.82 1.78 1.20–2.64
30–34,9 259 45 17.37 3.55 2.31–5.46 2.09 1.33–3.31
35–39.9 86 21 24.42 5.46 3.09–9.64 3.44 1.86–6.35
≥40 50 19 38,0 10.36 5.47–19.61 8.13 4.08–16.18
CUN-BAE
≤29.9 303 10 3.3 1 1 65.19
30–34.9 402 23 5.72 1.78 0.83–3.79 1.64 0.76–3.54
35–39.9 464 36 7.76 2.46 1.20–5.04 1.86 0.89–3.87
40–44.9 389 61 15.68 5.45 2.74–10.83 3.47 1.69–7.13
≥45 297 81 27.27 10.99 5.57–21.69 6.49 3.16–13.3
a
aOR: BMI (age, educational level, marital status, tobacco and alcohol use); CUN-BAE (educational level, marital status, tobacco and alcohol use)
observed by Gallagher et al., who found an overall cor-relation R2= 0.26, but when sex and age were taken into account the correlation was much better, with values for R2of up to 0.67 [18]. On this point, it should be noted that there was a good coincidence between the correl-ation figures obtained in studies comparing BMI with directly measured body fat and body fat estimated with CUN-BAE [8, 18–20].
Regarding the classification of obesity, this study opted for BMI≥30 kg/m2, regardless of sex or age, since this is the criterion recommended by the WHO, the most ex-tensively used world-wide and by scientific associations in Spain [2, 11]. The cut-off point for CUN-BAE was based on the criteria indicated by the authors who de-scribed the formula for calculating it, and was thus coin-cident with recommendations in other studies [12, 21]. On the basis of these norms, there is a low level of agreement in classification of obesity between BMI and the percentage of BF estimated by CUN-BAE, with a Kappa coefficient of 28.7 %. In other publications the Kappa between BMI and percentage of BF was similarly low in women (between 15 % and 30 %), while in men greater variations were noted (between 8 % and 70 %).
In addition to BMI as compared to the percentage of BF, prevalence of obesity estimated with CUN-BAE (61.8 %) was much higher than with BMI (21.35 %). This coincided with other publications in which the preva-lences of obesity estimated through the percentage of BF were almost double those yielded by BMI [4, 22] or even up to six times higher [23].
Diabetes and AHT are common ailments clearly re-lated to obesity as a risk factor, which is why we studied their association with the two ways of assessing body fat, to find that estimates of BF according to CUN-BAE were more clearly related to AHT and DM than results from BMI, just as was noted by Dervaux et al. in the assess-ment of body fat percentages [24]. The main reason for
this clearer association lies in the lower prevalence of AHT and DM in the normal weight grouping as assigned on the criterion of estimated body fat than as assigned by BMI. Furthermore, the greater number of instances of AHT and DM are to be found in lower-weight cat-egories according to BMI, while with CUN-BAE they are present in a smaller number of individuals. Other studies have also shown a better correlation of CUN-BAE with other biological markers of cardiovascular and metabolic diseases [8, 25].
The final result, the disparity in aOR and essentially in the distribution of patients according to BMI or CUN-BAE, comes down to the great differences observed in the attributable portion of the population for AHT or DM on the basis of quantity of body fat. Indeed, the fact that the majority of patients had high percentage of BF, while with BMI they were assigned to lower categories, goes a long way towards explaining the total number of cases attributed to higher than normal weight. In almost all instances the classification of patients according to CUN-BAE almost doubled the AFp relative to classifica-tion in accordance with BMI. It may also be of some relevance that the reference group with BMI (normal weight) is a very broad grouping in which risk may be expected not to be homogeneous, in the sense that indi-viduals in the upper part of the range might present a risk more like that of the over-weight than that of the lower part of the normal weight spectrum. All of this may cast a doubt upon estimates made of portions or fractions of the population and cases of AHT and DM attributable to obesity as a function of BMI [26, 27], so that the real impact of obesity in these pathologies may be much greater than assumed.
CUN-BAE has been proposed as a substitute for the BMI. Few studies have assessed its usefulness for classi-fying obesity or determining obesity-related cardiovascu-lar risks. Nevertheless such studies as have been carried
Fig. 3Distribution of the Number of Cases of Diabetes and aOR, by sex. Legends: Categories of Adiposity: With BMI (C1: 18,5–24.9, C2: 25–29.9,
out report the same phenomenon as we do here, show-ing that CUN-BAE classes a greater number of subjects as obese and therefore greatly reduces the number of in-dividuals in the reference category [28–30].
One possible limitation is that the highest adiposity category in men was established to avoid a sample size problem. Furhtermore, in our findings the sample may not have been representative of the population as a whole: the subjects were patients admitted to hospital or making use of health services for various reasons, so the prevalence of obesity and of AHT and DM was higher than in the population in general [31, 32]. However, the aOR observed in relation to BMI for AHT and DM was very similar to that reported in another study [26].
Conclusions
Although the overall correlation between BMI and the BF estimator was not good, it improved when sex and age were taken into account.
There is a low level of agreement in accordance with the criterion used. The prevalence of obesity as based on estimation of body fat is the three times higher than the BMI would suggest, which could lead to an underesti-mation of the prevalence of obesity.
CUN-BAE showed links with hypertension and dia-betes mellitus, and presented a better gradient than BMI did. The AFp for AHT was double when assessed with CUN-BAE as compared to BMI, while for DM it was more than 50 % higher. This brings into question the re-liability of calculations undertaken to assess the impact of obesity on thesepathologies.
Abbreviations
AFp:population attributable fraction; AHT: arterial hypertension; BF: body fat; BMI: body mass index; CUN-BAE: Clínica Universidad de Navarra - Body adiposity estimator; DM: diabetes mellitus; WHO: World Health Organization.
Competing interest
The authors declare that they have no competing interests
Authors’contributions
VM directed the study; VM and VDB analysed the data and wrote the manuscript, AD JC PG NS MDR AJM TFV JA AC FGC JMM JMQ and the CIBERESP Working Group conceived, performed and designed the study; and AD JC PG NS MDR AJM TFV JA AC FGC JMM JMQ contributed to the supervision of the study and critical analysis of the article. All authors read and approved the final manuscript.
Acknowledgements
We thank the physicians of the Sentinel Network of the participating Spanish regions and the study interviewers for their help and collaboration. Funding: This study was supported by the Ministry of Science and Innovation, Carlos III Institute of Health, Programme of Research on Influenza A/H1N1 (Grant GR09/0030), and the Catalan Agency for the Management of Grants for University Research (AGAUR Grant number 2009/ SGR 42). Verónica Dávila-Batista: Predoctoral contract financed by the Ministry of Education of the Junta de Castilla y Leon and the European Social Fund. The other members of the CIBERESP Cases and Controls in Pandemic Influenza Working Group are: Andalusia: Ernestina Azor, Jerónimo Carrillo, Rosa Moyano, Juan Antonio Navarro, Manuel Vázquez, Francisco Zafra (Médico Centinela); Mª Fe Bautista Martín, Jose Mª Navarro, Irene Pedrosa
Corral, Mercedes Pérez Ruiz (Laboratorio de Referencia de Gripe); Virtudes Gallardo, Esteban Pérez (Servicio de Epidemiología), José Ramón Maldonado (Hospital de Torrecárdenas), Áurea Morillo (Hospital Virgen del Rocío), Mª Carmen Ubago (Hospital Virgen de las Nieves). Castile and Leon: Demetrio Carriedo, Florentino Díez, Isabel Fernández-Natal, Silvia Fernández (Compl. Asist. Universitario, León); Javier Castrodeza, Carolina Rodríguez, Sonia Tamames (Consejería de Sanidad de la Junta de Castilla y León); Pilar Sanz (Universidad de León); Raul Ortiz de Lejarazu (Centro Nacional de Gripe de la Universidad de Valladolid); Alberto Pérez (Servicio de Vigilancia
Epidemiológica); Pedro Redondo (Servicio Territorial de Sanidad y Bienestar Social); Ana Pueyo, José Luis Viejo (Complejo Asistencial de Burgos). Catalonia: Jordi Alonso (IMIM-Hospital del Mar); Ferrán Barbé (Hospital Arnau de Vilanova); Lluis Blanch, Gemma Navarro (Hospital de Sabadell); Xavier Bonfill, Joaquin López-Contreras, Virginia Pomar, María Teresa Puig (Hospital de Sant Pau); Eva Borràs, Ana Martínez, Núria Torner (Dirección General de Salud Pública); Francesc Calafell (Universitat Pompeu Fabra); Joan Cayla, Cecilia Tortajada (Agencia de Salud Publica de Barcelona); I Garcia, Juan Ruiz (Hospital Germans Trias i Pujol); Juan Jose Garcia (Hospital Sant Joan de Deu); Joaquim Gea, Juan Pablo Horcajada (Universitat Pompeu Fabra _CIBER Enfermedades Respiratorias); Ned Hayes (Hospital Clínic_CRESIB); Fernando Moraga (Hospital Vall d’Hebrón); Tomas Pumarola (Laboratorio de Referencia de Gripe); Jordi Dorca (Hospital de Bellvitge); Marc Sáez (Universidad de Girona); A Agustí, Antoni Trilla, Ana Vilella (Hospital Clínic de Barcelona), Maretva Baricot, Olatz Garín (CIBERESP). Madrid Community: Ricard Génova, Margarita García Barquero, Elisa Gil, Susana Jiménez, Fernando Martín, María Luisa Martínez, Silvia Sánchez (Subdirección de Promoción de la Salud y Prevención); Rafael Cantón, Ana Robustillo (Hospital Ramón y Cajal); Carlos Álvarez, Ana Hernandez Voth, Francisco Pozo (Hospital 12 de octubre), José Ramón Paño (Hospital La Paz). Navarre: Antonia Martínez, Leyre Martínez (Inst. de Salud Pública), María Ruiz, Patricia Fanlo, Francisco Gil, Victor Martínez-Artola (Compl. Hosp. Navarra), María Eugenia Ursua, Maite Sota, María Teresa Virto, Juana Gamboa, Felipe Pérez-Afonso (Médico Centinelas). The Basque Country: Urko Aguirre, Alberto Caspelastegui, Pedro Pablo España, Susana García (Hospital Galdakao); Javier Arístegui, Amaia Bilbao, Antonio Escobar (Hospital Basurto); Itziar Astigarraga, José María Antoñana (Hospital de Cruces); Gustavo Cilla, Javier Korta, Emilio Pérez Trallero (Hospital Donostia), José Luis Lobo (Hospital Txagorritxu), Francisco J. Troya (Hospital de Santiago). Valencia Community: María Morales (Hospital General Universitario).
We would also like to acknowledge Dr Javier Llorca, Javier Gómez-Ambrosi and Dr Gema Frühbeck, for their comments and help.
Author details
1
Grupo de Investigación Interacciones Gen-Ambiente y Salud - Universidad de León (Gigas), León, Spain.2CIBER Epidemiología y Salud Pública, Madrid, Spain.3Instituto de Salud Pública de Navarra, Pamplona, Spain.4Departament de Salut, Generalitat de Catalunya, Barcelona, Spain.5División de Medicina Preventiva y Salud Pública, Universidad de Jaén, Jaén, Spain.6Subdirección de Vigilancia. Comunidad de Madrid, Madrid, Spain.7CIBER Enfermedades Respiratorias, Madrid, Spain.8Unidad Mixta Genómica y Salud CSISP (FISABIO)-Universitat de València, Valencia, Spain.9Servicio de Vigilancia de Andalucía, Sevilla, Spain.10Fundación Vasca de Innovación e Investigación Sanitarias, Sondika, Spain.11Departament de Salut Pública, Universitat de Barcelona, Barcelona, Spain.12Facultad de Ciencias de la Salud. Campus de Vegazana. Universidad de León, 24071 León, Spain.
Received: 28 April 2015 Accepted: 13 January 2016
References
1. Haslam D, James W. Obesity. Lancet. 2005;366(9492):1197–209. 2. World Health Organization (WHO). Obesity and overweight. Fact sheet N°
311. 2013. http://www.who.int/mediacentre/factsheets/fs311/en/. Accessed May 21, 2014.
3. Bastien M, Poirier P, Lemieux I, Després J. Overview of epidemiology and contribution of obesity to cardiovascular disease. Prog Cardiovasc Dis. 2014; 56(4):369–81.
5. Centers for Disease Control and Prevention (CDC). About BMI for Adults. 2015. http://www.cdc.gov/healthyweight/assessing/bmi/adult_bmi/index. html. Accessed March 10, 2015.
6. Prentice AM, Jebb SA. Beyond body mass index. Obes Rev. 2001;2(3): 141–7.
7. Romero-Corral A, Somers V, Sierra-Johnson J, Thomas R, Collazo-Clavell M, Korinek J, et al. Accuracy of body mass index in diagnosing obesity in the adult general population. Int J Obes. 2008;32(6):959–66.
8. Gómez-Ambrosi J, Silva C, Catalán V, Rodríguez A, Galofré J, Escalada J, et al. Clinical usefulness of a new equation for estimating body fat. Diabetes Care. 2012;5(2):383.
9. Domínguez A, Alonso J, Astray J, Baricot M, Cantón R, Castilla J, et al. Factores de riesgo de hospitalización por gripe (H1N1) 2009 y efectividad de intervenciones farmacológicas y no farmacológicas en su prevención. Estudio de casos y controles. Rev Esp Salud Publica. 2011;85(1):3–15. 10. World Health Organization. Obesity: preventing and managing the global
epidemic. Report of a WHO consultation. Report of a WHO Consultation. Geneva: Technical Report Series, No. 894; 2000.
11. Salas-Salvadó J, Rubio M, Barbany M, Moreno B, Grupo colaborativo de la SEEDO. SEEDO 2007 Consensus for the evaluation of overweight and obesity and the establishment of therapeutic intervention criteria. Med Clin (Barc). 2007;128(5):184–96.
12. Romero-Corral A, Lopez-Jimenez F, Sierra-Johnson J, Somers VK. Differentiating between body fat and lean mass-how should we measure obesity? Nat Clin Pract Endocrinol Metab. 2008;4(6):322–3.
13. De Lorenzo A, Deurenberg P, Pietrantuono M, Di Daniele N, Cervelli V, Andreoli A. How fat is obese? Acta Diabetol. 2003;40 Suppl 1:S254–7. 14. Llorca J, Fariñas-Alvarez C, Delgado-Rodríguez M. Fracción atribuible
poblacional: cálculo e interpretación. Gac Sanit. 2001;15(1):61–7. 15. Sardinha L, Lohman T, Teixeira P, Guedes D, Going S. Comparison of air
displacement plethysmography with dual-energy X-ray absorptiometry and 3 field methods for estimating body composition in middle-aged men. Am J Clin Nutr. 1998;68(4):786–93.
16. Shah N, Braverman E. Measuring adiposity in patients: the utility of body mass index (BMI), percent body fat, and leptin. PLoS ONE. 2012;7(4):e33308. 17. Vasconcelos F, Cordeiro B, Rech C, Petroski E. Sensitivity and specificity of
the body mass index for the diagnosis of overweight/obesity in elderly. Cad Saude Publica. 2010;26(8):1519–27.
18. Gallagher D, Visser M, Sepúlveda D, Pierson R, Harris T, Heymsfield S. How useful is body mass index for comparison of body fatness across age, sex, and ethnic groups? Am J Epidemiol. 1996;143:228–39.
19. Jackson A, Stanforth P, Gagnon J, Rankinen T, Leon A, Rao D, et al. The effect of sex, age and race on estimating percentage body fat from body mass index: The Heritage Family Study. Int J Obes. 2001;26(6):789–96. 20. Heydari S, Ayatollahi S, Zare N. Diagnostic value of bioelectrical impedance
analysis versus body mass index for detection of obesity among students. Asian J Sports Med. 2011;2(2):68–74.
21. Grundy S. Obesity, metabolic syndrome, and cardiovascular disease. J Clin Endocrinol Metab. 2004;89(6):2595–600.
22. Pongchaiyakul C, Nguyen T, Kosulwat V, Rojroongwasinkul N, Charoenkiatkul S, Pongchaiyakul C. Defining obesity by body mass index in the Thai population: an epidemiologic study. Asia Pac J Clin Nutr. 2006;15(3):293–9. 23. Rodríguez-Rodríguez E, López-Plaza B, López-Sobaler A, Ortega R.
Prevalencia de sobrepeso y obesidad en adultos españoles. Nutr Hosp. 2011;26(2):355–63.
24. Dervaux N, Wubuli M, Megnien J, Chironi G, Simon A. Comparative associations of adiposity measures with cardiometabolic risk burden in asymptomatic subjects. Atherosclerosis. 2008;201(2):413–7.
25. Haghighatdoost F, Sarrafzadegan N, Mohammadifard N, Asgari S, Boshtam M, et al. Assessing body shape index (ABSI) as a predictor for the risk of cardiovascular diseases and metabolic syndrome among Iranian adults. Nutrition. 2014;30(6):636–44.
26. Jiang Y, Chen Y, Manuel D, Morrison H, Mao Y. Obesity Working Group. Quantifying the impact of obesity category on major chronic diseases in Canada. Sci World J. 2007;7:1211–21.
27. Wilson P, D'Agostino R, Sullivan L, Parise H, Kannel W. Overweight and obesity as determinants of cardiovascular risk: the Framingham experience. Arch Intern Med. 2002;162(16):1867–72.
28. Gómez-Ambrosi J, Silva C, Galofré J, Escalada J, Santos S, Millán D, et al. Body mass index classification misses subjects with increased
cardiometabolic risk factors related to elevated adiposity. Int J Obes. 2012; 36(2):286–94.
29. Zubiaga Toro L, Ruiz-Tovar Polo J, Díez-Tabernilla M, Giner Bernal L, Arroyo Sebastián A, Calpena RR. CUN-BAE formula and biochemical factors as predictive markers of obesity and cardiovascular disease in patients before and after sleeve gastrectomy. Nutr Hosp. 2014;30(2):281–6.
30. Fuster-Parra P, Bennasar-Veny M, Tauler P, Yañez A, López-González A, Aguiló A. A comparison between multiple regression models and CUN-BAE equation to predict body fat in adults. PLoS ONE. 2015;10(3):e0122291. 31. Instituto Nacional de Estadistica. Encuesta Nacional de Salud 2011–2012.
Nota de Prensa. Ministerio de Sanidad, Servicios Sociales e Igualdad; 2013. Available from: http://www.ine.es/prensa/np770.pdf
32. Van Kerkhove M, Vandemaele K, Shinde V, Jaramillo-Gutierrez G, Koukounari A, Donnelly C, et al. Risk factors for severe outcomes following 2009 influenza A (H1N1) infection: a global pooled analysis. PLoS Med. 2011;8(7): e1001053.
• We accept pre-submission inquiries
• Our selector tool helps you to find the most relevant journal
• We provide round the clock customer support
• Convenient online submission
• Thorough peer review
• Inclusion in PubMed and all major indexing services
• Maximum visibility for your research
Submit your manuscript at www.biomedcentral.com/submit