The impact of a change on the size of the smoke compartment in
the evacuation of health care facilities
Virginia Alonso-Gutierrez1 (alonsovirg@gmail.com), Arturo Cuesta2 (cuestaar@unican.es), Daniel Alvear2 (alveard@unican.es), Mariano Lázaro2 (lazarom@unican.es)
1Department of Mechanical Engineering, Imperial College London
Abstract
Evacuation in health-care facilities is complex due to the physical impairment of the patients. This kind of evacuation usually requires the assistance of the workforce members. A proposed change of NFPA 101, Life Safety Code, would increase the maximum allowable size of a smoke compartment (a space within the building enclosed by smoke barriers on all sides that restricts the movement of smoke) in health-care occupancies from 2,090 m2 to 3,700 m2, almost double the size. This study aims to analyse the impact of this change in the required time for evacuating patients during a fire in order to understand the consequences of that potential change. This paper is focused on the area where the patient’s rooms are located. The evacuation scenario is a floor plan comprised of four smoke compartments. To analyse the proposed change, the smoke barriers between two adjacent compartments were removed in a floor plan and three ratios of number of patients per one staff member were considered (4:1, 3:1 and 2:1). A computational methodology was conducted to calibrate the model STEPS for simulating assisted evacuation processes. In addition, Fire Dynamic Simulator (FDS) was used to simulate the fire and smoke spread in a table and a PC to compare fire and evacuation results The evacuation results show that the change of the smoke compartment size increases the mean evacuation time by 23%; however, the fire results show that the available safe egress time is 16 min for both smaller and large smoke compartment . The ratio of the number of patients per staff member is also a strong factor that increases the evacuation up to 82% when comparing the ratios of 2 patients per staff member and 4 patients per staff member.
1. Introduction
The proposed change in the size of smoke compartments for health care facilities (from 22,500 ft2 to 40,000 ft2) will lead to an increase in the number of patients inside that smoke compartment, although this change would maintain the 200 ft (61 m) travel distance from the most remote point to an exit. It is important to understand how this may affect the evacuation process in health care occupancies. The evacuation procedure in a health care facility is a complex and a well-defined strategy that requires an effective execution. It should be noted that most of the occupants in these environments are patients who are being treated for some illness and they may not be capable to evacuate by themselves (self-evacuation). For this reason, the health care personnel have to be ready and trained to assist (assisted evacuation) the patients in their evacuation to another smoke compartment or safe place.
It can be assumed that all areas or smoke compartments have at least one person in charge that will assign the evacuation procedure to each member of staff. This procedure establishes which patients (room) need to be assisted in case of fire and an evacuation order.
It is well known that evacuation models are powerful tools to study the evacuation process in different scenarios and applications [1-5]. We can find several reviews [1, 3] that show the capabilities and limitations of these types of models.
1 2 3 4 5 6 7 8 9 10 11 12 13 14 15 16 17 18 19 20 21 22 23 24 25 26 27 28 29 30 31 32 33 34 35 36 37 38 39 40 41 42 43 44 45 46 47 48 49 50 51 52 53 54 55 56 57 58 59 60 61 62
These reviews show that, apart from their use in the field of transportations (ships, aircraft and trains) [6-8], most of the egress models have been employed mainly for application to buildings.
Most of these models were developed to consider the self-evacuation process. Some models allow the simulation of additional behaviours, such as travel itineraries assigned to occupants [9-11]. This could be used to simulate prescribed assisted evacuation procedures. Unfortunately, just a few resources have been found related to assisted evacuation in hospitals [12-14]. In addition, an assisted evacuation can be required in other scenarios such as care home facilities [15, 16]. It is clear that an assisted evacuation is bound to be found in any typical scenarios in which temporal or permanent disabled people are present [15]. However, hospitals have a number of staff that should have a defined procedure to face the evacuation of the patients. Due to ethical and practical reasons, fire drills are hardly ever conducted in health care scenarios. Given this, evacuation modelling based on reliable data can be used to predict the impact and benefits of different procedures.
Although the approximation of this problem has been scarce and limited, generally, it is agreed [12-14] that it is necessary to differ the patients between ambulant and nonambulant. In any case, all the patients have a preparation time that may depend on the typology of illness or treatment, which may include the processes to disconnect the patients from an equipment, the movement of the patient from the bed to a wheelchair, stretcher or similar device or other common pre-movement activities such as getting dressed or gathering their belongings.
The assisted evacuation is different to self-evacuation, where occupants are able to move. The health care personnel will certainly evacuate the patients and in many cases, they will transport them in wheelchairs, stretcher or other transportation devices. There is a lack of data related to these preparation times and transportation speeds and only a few works present some ranges and limited values for these parameters. Hunt, Galea and Lawrence [18] presented a study quantifying the preparation time and transportation speed of trained hospital staff in evacuating people with reduced mobility using different assistance devices. Gwynne et al [19] claimed a data collection of pre-evacuation times restricted to outpatients and associated staff. Other works such as [20] and [14] showed some ranges and values for preparation times considering different types of patients for the sleeping areas.
The goal of this paper is to analyse the impact of an increase of smoke compartment size on horizontal evacuation of patients on a sleeping room floor in a health care facility. Based upon preliminary input data and the calibration of the model STEPS [9], diverse scenarios were selected and modelled considering the proposed change in the smoke compartment. Since the number of health care personnel can significantly vary in the same scenario, different ratios of patients to health care personnel members were explored to show the impact of this parameter on the evacuation process of patients.
3 4 5 6 7 8 9 10 11 12 13 14 15 16 17 18 19 20 21 22 23 24 25 26 27 28 29 30 31 32 33 34 35 36 37 38 39 40 41 42 43 44 45 46 47 48 49 50 51 52 53 54 55 56 57 58 59 60 61 62
2. Occupant characteristics
Two types of occupants were considered for this study, health care personnel and patients. It should be noted that other kind of occupants could be found in these scenarios such as visitors, doctors, other staff, etc. However, those occupants are out of the scope of this paper.
2.1 Type of occupants Health Care Personnel
These individuals will be responsible for assisting with the evacuation of patients. The number of health care personnel may well depend on the specific type of care provided by the hospital (or hospital floor).
It can also change depending on the use area (sleeping room / treatment room) or time of day. It should be noted that for this study we considered the worst-case scenario, the nighttime for sleeping rooms when the staff available for evacuation is presumed to be at the minimum.
Patients
Based on the ability to evacuate by themselves, we considered the following type of patients: Type 1 – Ambulant patient with reduced mobility.
Type 2 - Nonambulant patients who need to be assisted using a wheelchair or similar device.
Type 3 - Nonambulant patients who need to be assisted by using a stretcher, blanket or similar device and that may have to be moved using a blanket drag. It is assumed that this type of patients may include the patients connected to any medical equipment.
For the evacuation or evacuation process, all the patients in the hospital were assumed to be assisted by health care personnel.
2.2 Occupants characteristics
The assisted evacuation process in a health care facility can be described by several parameters that define the behaviors and movement of each health care personnel:
- Response time(𝑡𝑝𝑚𝑆). The time elapsed until each health care personnel member starts movement to evacuate the patients. It was assumed that the personnel are already assembled in the corresponding smoke compartment and prepared for performing evacuation processes.
- Preparation time(𝑡𝑝). The required time for preparing the patient for evacuation. This time depends on the type of preparation and the ability of the corresponding personnel to be ready to move the patients: 1) with no devices – ambulant patients- 2) to a wheelchair, 3) to a stretcher or 4) to a blanket.
- Unimpeded walking speed(𝑤𝑆). The walking speed of health care personnel moving toward a patient or returning to the next patient.
4 5 6 7 8 9 10 11 12 13 14 15 16 17 18 19 20 21 22 23 24 25 26 27 28 29 30 31 32 33 34 35 36 37 38 39 40 41 42 43 44 45 46 47 48 49 50 51 52 53 54 55 56 57 58 59 60 61
- Transportation speed (𝑤𝑝). The walking speed of personnel while transporting the patient to another safe compartment or while walking with the patients (ambulant patients). It is likely that the personnel will walk at the speed of the ambulant patients. Evacuation is essentially a stochastic process [21, 23] due to the randomness of human behavior and the uncertain development of the emergency. To face this, modelers address the stochastic nature of evacuation by using random input variables to represent the human behaviors and its probability distribution functions PDF (e.g. pre-evacuation time and walking speed).
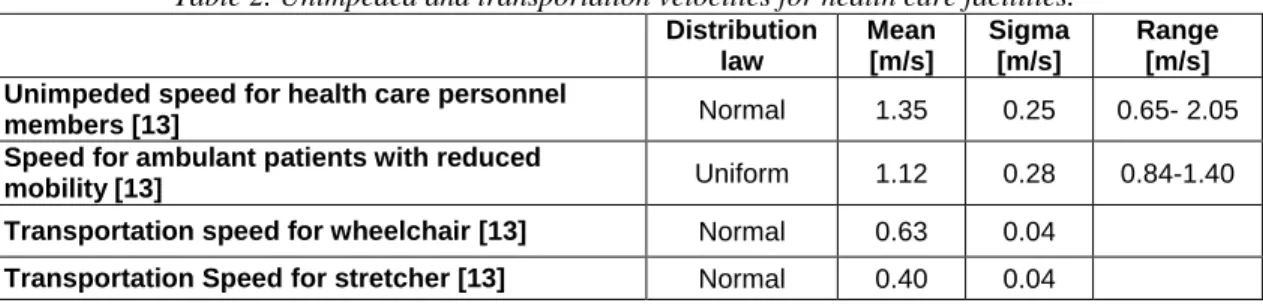
There is a lack of data regarding the behavioral parameters in hospitals. However, in order to accomplish this analysis, Tables 1 and 2 show the values used as inputs, which are based on different available studies [12 ,13]. The gathered data for preparation times for Type 1, 2 and 3 show a range of values.
Based on the methodology presented in [24], the following input variables were used in this study. In order to consider these parameters as random variables, and based on the Central limit theorem, it was assumed that each variable is normally distributed with a standard deviation of 3 sigma (3 sigma was selected in order to cover a wider variability of possible outcomes).
Table 1. Response and preparation time for patients.
Typology Distribution law Mean [s] Sigma [s] Range [s]
Health care personnel
[12] Log-normal 70.8 60
Type 1 [12] Normal 60 20 30-90
Type 2[12] Normal 110 36 100-120
Type 3[12] Normal 360 40 180-900
Table 2. Unimpeded and transportation velocities for health care facilities.
Distribution law Mean [m/s] Sigma [m/s] Range [m/s] Unimpeded speed for health care personnel
members [13] Normal 1.35 0.25 0.65- 2.05
Speed for ambulant patients with reduced
mobility [13] Uniform 1.12 0.28 0.84-1.40
Transportation speed for wheelchair [13] Normal 0.63 0.04
Transportation Speed for stretcher [13] Normal 0.40 0.04
2.3 Evacuation priority in a health care facility
The evacuation process in a health care facility is defined by a procedure established in the emergency plans of each hospital. All areas or smoke compartments must have a person in charge that will assign the fixed procedure to health care personnel in an emergency. Based on the corresponding number, types and location of patients, each health care personnel member will evacuate specific patients from their initial location (room) to a defined safe area. 3 4 5 6 7 8 9 10 11 12 13 14 15 16 17 18 19 20 21 22 23 24 25 26 27 28 29 30 31 32 33 34 35 36 37 38 39 40 41 42 43 44 45 46 47 48 49 50 51 52 53 54 55 56 57 58 59 60 61 62
For this study, it was assumed that all the staff members were gathered in a common meeting area within the affected smoke compartment to receive specific instruction (evacuation procedure or priority). The emergency plans from hospitals usually establish a “triage” for getting as many patients out as possible. The default priority in these situations may be assumed as:
1. Patients in immediate danger (near the fire) 2. Ambulant patients - Type 1
3. Patients requiring some transport assistance (wheelchair) - Type 2 4. Patients requiring transport assistance (stretcher/blanket) - Type 3
5. Patients who are being treated and/or would be difficult to relocate/evacuate (i.e. ICU, bariatric). More research is required to properly model the evacuation of these types of patients, and it is beyond the scope of this study. For this reason, they are not incorporated in this model, but could and should be integrated in future studies.
2.4 The application floor plan
The health care facilities are complex environments that compile different kind of activities and areas in the same facility such as treatment areas, sleeping areas, administration activities areas, etc. This paper is focused on the analysis of varying the smoke compartment size in sleeping areas during night time, when, theoretically, the occupancy is higher and the number of health care personnel is limited. In order to create the smoke compartments that most closely represent the current (22,500 ft2) and the proposed limit (40,000 ft2), a hypothetical floor plan for a sleeping area was used for this study. The analyzed hospital (see Figure 1) has a plus-shape with four smoke compartments of approximately 20,000 ft2 (19,172 ft2). This configuration maintains the 200 ft (61 m) travel distance from the most remote point to an exit. Each of the smoke compartments contains 18 rooms. To study the impact of increasing the size of the smoke compartment, the smoke barrier between compartments 1 and 2 was removed in order to consider these two areas as one larger smoke compartment (39,424 ft2). The following scenarios were considered:
4 5 6 7 8 9 10 11 12 13 14 15 16 17 18 19 20 21 22 23 24 25 26 27 28 29 30 31 32 33 34 35 36 37 38 39 40 41 42 43 44 45 46 47 48 49 50 51 52 53 54 55 56 57 58 59 60 61
Figure 1. Layout of adapted sleeping area floor plan.
Scenario 1
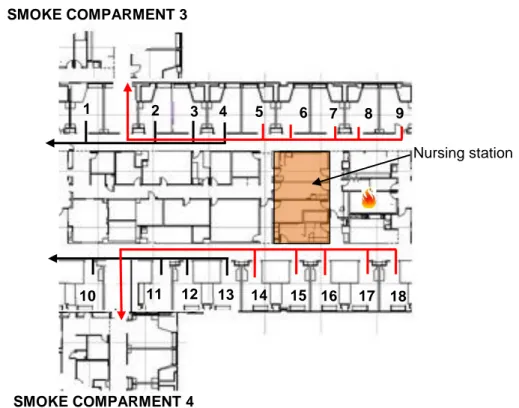
A fire in smoke compartment 1 causes the evacuation of patients to the adjacent smoke compartments (see Figure 2).
The patients from the 18 rooms were evacuated to the smoke compartments 2, 3 and 4. Since each side of the floor plan has two exits (at the same distance), it was assumed that the evacuation of the patients was divided evenly into the other areas causing a minimum impact in the other smoke compartments as follows:
Patients from room 1 to room 4 were evacuated to smoke compartment 2. Patients from room 5 to room 9 were evacuated to smoke compartment 3. Patients from room 10 to room 13 were evacuated to smoke compartment 2. Patients from room 15 to room 18 were evacuated to smoke compartment 4.
Rooms in hospitals are normally single or double occupancy. For Scenario 1, the rooms 2, 6, 14 and 16 were considered as a double occupancy. This means that there were 22 patients inside the smoke compartment 1 (Scenario 1).
1
2
3
4
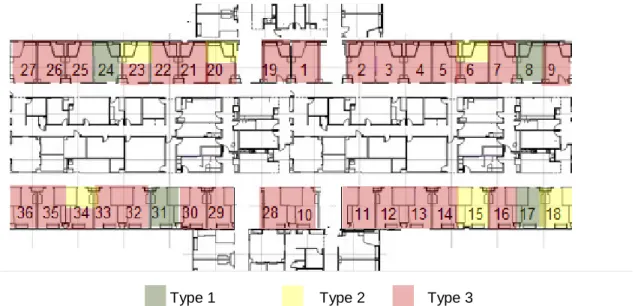
3 4 5 6 7 8 9 10 11 12 13 14 15 16 17 18 19 20 21 22 23 24 25 26 27 28 29 30 31 32 33 34 35 36 37 38 39 40 41 42 43 44 45 46 47 48 49 50 51 52 53 54 55 56 57 58 59 60 61 62In order to consider a worst-case scenario it was assumed that 3 patients were Type 1, 4 patients were Type 2 and 15 patients were Type 3. It is assumed that the greatest percentage of in-patients have a severe condition and might be considered as Type 3, otherwise, an overnight stay would be avoided. Patients were randomly assigned to the rooms using a pseudo-random number generator (Figure 3)
Figure 2. Layout of Scenario 1.
Type 1 Type 2 Type 3
Figure 3. Distribution of patients in Scenario 1.
1 2 3 4 5 6 7 8 9 10 11 12 13 14 15 16 17 18 Nursing station SMOKE COMPARMENT 3 SMOKE COMPARMENT 4 S MO K E CO M P AR ME NT 2 4 5 6 7 8 9 10 11 12 13 14 15 16 17 18 19 20 21 22 23 24 25 26 27 28 29 30 31 32 33 34 35 36 37 38 39 40 41 42 43 44 45 46 47 48 49 50 51 52 53 54 55 56 57 58 59 60 61
Different ratios of patients to health care personnel were analyzed in order to explore the impact of this parameter for assisted evacuation procedures.
The type of patient determines the number of required personnel for their evacuation (one or two) and in many cases two persons are required for preparation of patients although just one is required for his/her evacuation. Emergency Groups (EG) formed by two health care personnel members were considered in this study:
Scenario 1.1: 6 emergency groups (12 health care personnel). Scenario 1.2: 4 emergency groups (8 health care personnel). Scenario 1.3: 3 emergency groups (6 health care personnel).
Table 3. Evacuation process of patients for Scenario 1.
Scenario 1.1
Rooms to be evacuated by each EG 1st 2nd 3rd 4th 5th 6th 7th 8th EG 1 9 2 (T1) 5 2 (T3) EG 2 8 7 4 EG 3 6 (T1) 6 (T3) 3 1 EG 4 18 14 (T2) 16(T31) 11 EG 5 17 15 13 10 EG 6 14 (T1) 16 (T32) Scenario 1.2 EG 1 9 2 (T1) 7 5 3 1 EG 2 8 6 (T1) 6 (T3) 4 2 (T3) EG 3 18 14 (T1) 14 (T2) 16(T31) 12 10 EG 4 17 15 16(T32) 13 11 Scenario 1.3 Rooms EG 1 9 17 2 (T1) 7 6 (T3) 4 2 (T3) 1 EG 2 18 6 (T1) 15 16(T31) 5 12 11 EG 3 8 14 (T1) 14 (T2) 16(T32) 13 3 10
Table 3 shows the evacuation procedure simulated for each scenario. This table summarizes which rooms were evacuated by each EG. The number in brackets indicates which patient (Type) from a double occupancy room to be evacuated.
The nursing station is assumed as the common meeting area where the evacuation procedure is assigned.
Scenario 2
For Scenario 2 the smoke barrier between smoke compartments 1 and 2 was removed considering a smoke compartment of 39,424 ft2 (see Figure 4).
SMOKE COMPARMENT 3 Evac. order Emerg. Group 3 4 5 6 7 8 9 10 11 12 13 14 15 16 17 18 19 20 21 22 23 24 25 26 27 28 29 30 31 32 33 34 35 36 37 38 39 40 41 42 43 44 45 46 47 48 49 50 51 52 53 54 55 56 57 58 59 60 61 62
Figure 4. Layout of scenario 2
As Figure 4 shows, for Scenario 2 patients from 36 rooms were evacuated from the affected smoke compartment to smoke compartments 3 and 4 through four exits. Considering the use of the nearest exit and that all the exits were available, the evacuation procedure was:
Room 1 to room 9 use the Exit 2 to the smoke compartment 3. Rooms 19 to room 27 use the Exit 1 to smoke compartment 3. Rooms 10 to room 18 use the Exit 4 to smoke compartment 4. Rooms 28 to room 36 use the Exit 3 to smoke compartment 4.
For Scenario 2, rooms 2, 6, 14, 16, 20, 23, 32 and 34 were considered as a double occupancy. There was meant to be a total of 44 patients to evacuate in the adjacent smoke compartments. In order to replicate Scenario 1 and to consider a worst-case scenario, it was assumed that there were 6 patients Type 1, 8 patients Type 2 and 30 patients Type 3. Again, the patients were randomly distributed in the based on pseudo-random number generation(see Figure 5)
Type 1 Type 2 Type 3
Figure 5. Distribution of patients in Scenario 2
1 2 3 4 5 6 7 8 9 10 11 12 13 14 15 16 17 18 19 20 21 22 23 24 25 26 27 36 35 34 33 32 31 30 28 29 SMOKE COMPARMENT 4 EXIT 1 EXIT 2 EXIT 3 EXIT 4 Nursing station 4 5 6 7 8 9 10 11 12 13 14 15 16 17 18 19 20 21 22 23 24 25 26 27 28 29 30 31 32 33 34 35 36 37 38 39 40 41 42 43 44 45 46 47 48 49 50 51 52 53 54 55 56 57 58 59 60 61
Similar to Scenario 1, for Scenario 2 different ratios of patients to health care personnel were simulated.
Scenario 2.1: 12 EG (24 health care personnel). Scenario 2.2: 8 EG (16 health care personnel). Scenario 2.3: 6 EG (12 heath care personnel).
Table 4 shows the evacuation procedure for the different scenarios considering the number of emergency groups and the “triage”. This table summarizes which rooms were evacuated by each EG. The number in brackets indicates which patient (Type) from a double occupancy room to be evacuated.
Table 4. Evacuation process for Scenario 2.
Scenario 2.1
Rooms to be evacuated by each EG
1st 2nd 3rd 4th 5th 6th 7th 8th EG 1 9 16 (T31) 11 25 EG 2 18 16 (T32) 1 34 (T3) EG 3 17 6 (T3) 10 26 EG 4 8 14 (T31) 19 35 EG 5 31 14 (T32) 28 27 EG 6 24 5 29 36 EG 7 6 (T2) 4 21 20 (T3) EG 8 15 13 30 23 (T3) EG 9 20 (T2) 3 22 EG 10 23 (T2) 12 32 (T31) EG 11 34 (T2) 2 (T31) 32 (T32) EG 12 7 2 (T32) 33 Scenario 2.2 Rooms EG 1 9 20 (T2) 14 (T32) 11 30 26 EG 2 18 23 (T2) 5 1 22 35 EG 3 17 34 13 10 23 (T3) 27 EG 4 8 7 4 19 32 (T31) 36 EG 5 31 16 (T31) 3 28 32 (T32) EG 6 24 16 (T32) 12 20 (T3) 33 EG 7 6 (T2) 6 (T3) 2 (T31) 29 25 EG 8 15 14 (T31) 2 (T32) 21 34 Scenario 2.3 Rooms EG 1 9 6 (T2) 16 (T31) 13 11 29 32 (T32) 27 EG 2 18 15 16 (T32) 4 1 21 33 36 EG 3 17 20 (T2) 6 (T3) 3 10 30 25 EG 4 8 23 (T2) 14 (T31) 12 19 22 34 EG 5 31 34 14 (T32) 2 (T31) 28 23 (T3) 26 EG 6 24 7 5 2 (T32) 20 (T3) 32 (T31) 35 Evac. order Emerg. Group 3 4 5 6 7 8 9 10 11 12 13 14 15 16 17 18 19 20 21 22 23 24 25 26 27 28 29 30 31 32 33 34 35 36 37 38 39 40 41 42 43 44 45 46 47 48 49 50 51 52 53 54 55 56 57 58 59 60 61 62
Table 5 summarizes the scenarios analyzed in this study. As explained, this paper aims at studying the impact of increasing the smoke compartment size. Nevertheless, an assisted evacuation mainly depends on the number of staff assisting the patients. That is why different ratios of patients to health care personnel were analyzed as well.
Table 5. Summary of scenarios to be simulated with STEPS. Scenario Size of smoke
compartment (m2)
Number of patients per each health care personnel (nº patients:nº health care personnel)
1.1 2.090 4:1 1.2 2.090 3:1 1.3 2.090 2:1 2.1 3.700 4:1 2.2 3.700 3:1 2.3 3.700 2:1
3. Model strategy for an assisted evacuation
The health care facilities are complex scenarios where occupants may require to be assisted to conduct an evacuation. Most of the current models are mainly designed for self-evacuation. In this study the model STEPS [9] is calibrated for simulating the assisted evacuation in health care facilities.
STEPS in normal conditions mode permits the user to implement different tasks adjusted to routes and sub-routes for each occupant. The model’s user can assign prefixed routes for each emergency group, based on the evacuation procedures shown in Table 1 and 2.
Figure 7 shows the modelling schema for simulating the evacuation/evacuation procedure for each emergency group.
.
Figure 7. Schema for evacuating patients by using STEPS model. Checkpoint 1 (𝑡𝑝𝑚𝑆)
Initial location (nursering station)
Checkpoint 2
Room 1 (𝑡𝑝1 )
Checkpoint n
Room n (𝑡𝑝𝑛)
Checkpoint 3 Final location 1 (other smoke
compartment) Checkpoint 4 Room 2 (𝑡𝑝2) 𝑤𝑠 𝑘𝑖1∙𝑤𝑠 𝑤𝑠 𝑤𝑠 Checkpoint 5 Final location 2 (other smoke
compartment)
𝑘𝑖2∙𝑤𝑠
Checkpoint n Final location n (other smoke
compartment) 𝑘𝑖3∙𝑤𝑠 4 5 6 7 8 9 10 11 12 13 14 15 16 17 18 19 20 21 22 23 24 25 26 27 28 29 30 31 32 33 34 35 36 37 38 39 40 41 42 43 44 45 46 47 48 49 50 51 52 53 54 55 56 57 58 59 60 61
The checkpoint 1 was the initial starting point, or the place where the health care personnel member goes to get the instruction about the evacuation procedure. In this study, this initial point is assumed as the nursering station. Each member has his/her own response time (𝑡𝑝𝑚𝑆) and unimpeded walking speed (𝑤𝑠 ).
From the initial point, the health care personnel members used the defined routes to reach the first room defined in the evacuation procedure. In the room, a random preparation time 𝑡𝑝𝑖|𝑖=1,..𝑅𝑜𝑜𝑚 𝑛 was required, to get the patient ready to be moved to other smoke compartment.
During the evacuation, each health care personnel member transported the patient through the defined route. Although the transportation speeds cannot be assigned to the pre-defined routes in STEPS, the user can define a decreasing coefficient 𝑘𝑖∙ in order to reduce the unimpeded
walking speeds of the health care personnel in that route. This 𝑘𝑖∙ adjusts the unimpeded
walking speeds to the ambulant patients and transportation speeds. The coefficients in Table 6 were used to represent the different transportation speeds for each type of patients based on information in Table 2.
Table 6. Coefficient assigned to the routes employed by each type of patients. Type of patients Coefficient
Type 1 0.83
Type 2 0.47
Type 3 0.30
4. Preliminary analysis of the Available Safe Egress Time
This paper is focused on assessing how an increase in the smoke compartment size might affect the evacuation in hospitals and how evacuation models can be applied to this assisted evacuation. We cannot determinate about if larger evacuation times in case of fire might jeopardize the patients without considering the risk itself. The aim of smoke compartment is to provide a barrier in case of fire in order to avoid or limit the smoke to affect occupants. It is necessary to analyze how a fire and smoke behaves in case of larger smoke compartment in order to make a cross-analysis with the evacuation times (under the proposed modeling method) and confirm if the proposed change in the smoke compartment size might lead to a risk for the patients.
Fire Dynamic Simulator (FDS) [25] was used to simulate the fire and smoke spread in the application hospital, in order to provide an overview on how a fire would affect the evacuation conditions when the size of the smoke compartments is increased. Scenarios 1 and 2 were simulated to study fire behaviour in the small and the big compartments. The assumed location of fires is shown in Figure 8. For the selection of the grid size, we applicate the relationship between the grid cell size and the characteristic diameter of the fire. The value of this relationship is recommended to be between 4 and 16 [26-27] and in our case, was 5.5, using a cell size of 0.25 m. The ignition source was a computer work station consisted of a computer desk and a book case each constructed of 16 mm thick particle board covered with a simulated wood, plastic laminate, with a peak of heat release rate of 2.48 MW [28]. It was considered that other materials don`t contribute to the fire due to the activation of the sprinklers. 3 4 5 6 7 8 9 10 11 12 13 14 15 16 17 18 19 20 21 22 23 24 25 26 27 28 29 30 31 32 33 34 35 36 37 38 39 40 41 42 43 44 45 46 47 48 49 50 51 52 53 54 55 56 57 58 59 60 61 62
5. Results and discussion
This section presents the results for the assisted evacuation modeling in the application hospital. Additionally, fire modelling results are presented here. It should be noted that this paper is mainly focused on the evacuation so that the fire results are employed in order to confirm if an increase in the smoke compartment and the corresponding increase in the evacuation time might cause a significant safety problem in the analyzed hospital.
5.1 Evacuation results
In total 100 simulations were run for scenario to obtain statistical significance of evacuation times. Outputs were processed and mean values, standard deviations and 90th and 95th percentiles were obtained to show confidence values. Table 7 shows the total evacuation times produced in Scenario 1 and 2.
Table 7. Results of the mean, 90th percentile and 95th percentile evacuation times for Scenarios 1 and 2.
Scenario Ratio patients to staff Mean evacuation time (min) Standard deviation (min) 90th percentile of the evacuation time (min) 95th percentile of the evacuation time (min) 1.1 4:1 30:13 02:25 33:24 34:32 1.2 3:1 43:08 02:16 46:13 47:01 1.3 2:1 59:34 04:09 65:04 66:23 2.1 4:1 37:14 02:21 40:21 40:39 2.2 3:1 49:31 02:51 53:33 54:47 2.3 2:1 67:42 04:37 72:39 76:59
To analyze the impact of the smoke compartment size, Table 7 compares the baseline simulations (Scenario 1 with regular smoke compartment size) and Scenario 2, where the smoke compartment was increased.
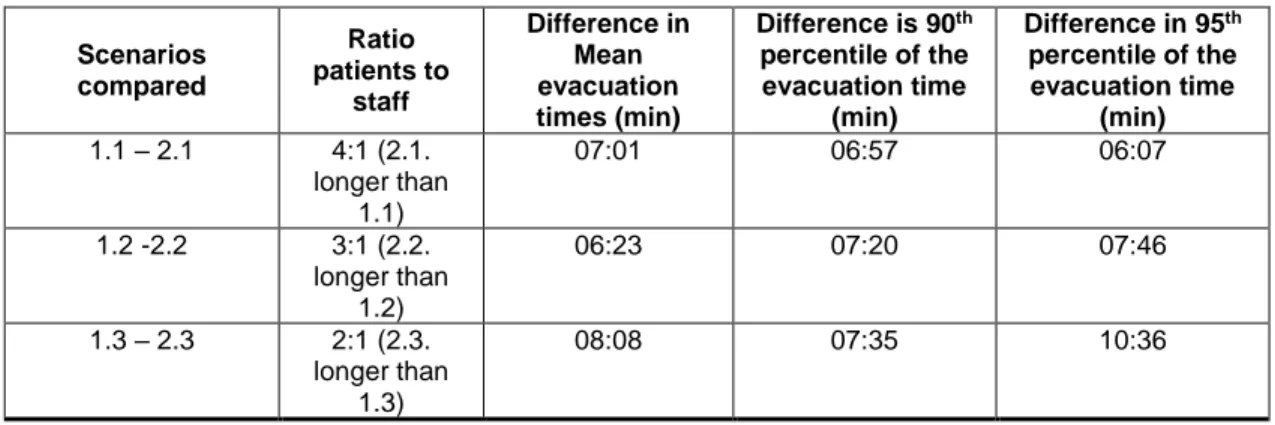
Scenario 1.1 and 2.1, 1.2 and 2.2, 1.3 and 2.3 are equivalents since the same ratio of patients to health care personnel was analyzed. Table 8 shows the impact of increasing the smoke compartment size in the evacuation times. This happens even when the same ratio of patients to health care personnel was considered for sleeping areas.
Table 8. Difference of mean, 90th percentile and 95th percentile of the evacuation times for different ratio of
patients to staff. Scenarios compared Ratio patients to staff Difference in Mean evacuation times (min) Difference is 90th percentile of the evacuation time (min) Difference in 95th percentile of the evacuation time (min) 1.1 – 2.1 4:1 (2.1. longer than 1.1) 07:01 06:57 06:07 1.2 -2.2 3:1 (2.2. longer than 1.2) 06:23 07:20 07:46 1.3 – 2.3 2:1 (2.3. longer than 1.3) 08:08 07:35 10:36 4 5 6 7 8 9 10 11 12 13 14 15 16 17 18 19 20 21 22 23 24 25 26 27 28 29 30 31 32 33 34 35 36 37 38 39 40 41 42 43 44 45 46 47 48 49 50 51 52 53 54 55 56 57 58 59 60 61
5.2 Smoke spread results
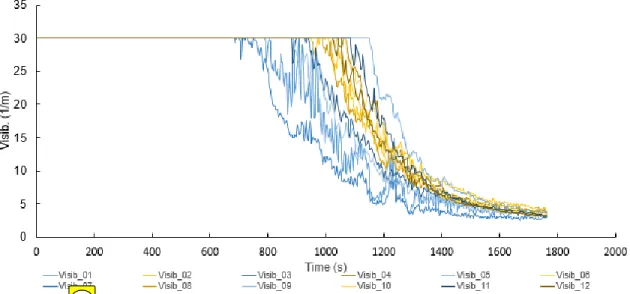
Figures 9 and 10 show the visibility and temperature for Scenario 1 and 2 in different measure points located in the corridors at 1.75m high.
Figure 9. Evolution of visibility) versus time in Scenario 1 measured at different points in the corridor.
For the purpose of this paper, we assumed a visibility of 10 meters as the tenability condition in which the occupants might be affected by fire (PD 7974-6 [29]). In other words, the time in which the visibility reaches 10 metres is assumed as reference of the available safe egress time (ASET). For Scenario 1 Exit 1.1 and Exit 1.4 were blocked due to smoke 15:14 min after the fire broke out. 46 s later (16:00 min after the fire started), Exit 1.2 and Exit 1.3 were unavailable as well.
Figure 10. Evolution of visibility versus time in Scenario 2 measured at different points in the corridor. 3 4 5 6 7 8 9 10 11 12 13 14 15 16 17 18 19 20 21 22 23 24 25 26 27 28 29 30 31 32 33 34 35 36 37 38 39 40 41 42 43 44 45 46 47 48 49 50 51 52 53 54 55 56 57 58 59 60 61 62
Results for Scenario 2 show that Exits 2.2 and Exit 2.4 were blocked 15:36min after the fire started in the room. Additionally, it took 16:55min to block Exit 2.1 and Exit 2.3 in the large compartment.
5.3 Discussion
Regarding the assisted evacuation, when we compare the evacuation times for Scenario 1 and 2, table 8 shows that the mean evacuation times (required safe egress time) increased by approximately 7 minutes in the largest smoke compartment. These differences were even greater for the percentiles of evacuation times (up to 10 minutes between the 95th percentiles in Scenarios 1.3 and 2.3). Since similar ratio of patients to health care personnel is considered in this comparison and considering that the maximum travel distance remains the same for both scenarios, the difference in the evacuation times between Scenario 1 and Scenario 2 mainly relies on the typology of patients. It should be noted that a greater percentage of patients Type 3 were considered. This lead to larger preparation times and slower transportation speeds so that although the same ratio of patients to health care personnel is considered in Scenario 2, there are more patients type 3 and they need more time to assist during the evacuation.
As expected, another finding was the high impact of the number of health care personnel for assisting the patients during evacuation process.
As Table 7 displays, for Scenario 1.1 with a ratio 1:2 (30:13) the mean evacuation times decreased more than 12 minutes compared to Scenario 1.2 (43:08 min) with a ratio 1:3 and more than 29 minutes for Scenario 1.3 (59:34 min.) with a ratio 1:4.
These differences were similar for Scenario 2. In this case, the mean evacuation time for Scenario 2.1 (37:14 min) decreased around 12 minutes compared to Scenario 2.2 (49:31 min) and up to 30 minutes for Scenario 2.3 (67:42 min).
An interesting finding of this study is that while ASET did not differ when comparing both small and large smoke compartment (ASET=16 min) the RSET was up to 7 min greater in the large smoke compartment.
Based on the application scenario, the smoke could cause a problem even in the regular smoke compartment (Scenario 1) since the evacuation times for all the scenarios are considerably larger than the obtained ASET. As previously explained in this section, the RSET also depends on the typology of patients. This study considers a great number of patients Type 3 which requires longer assisted evacuation times than Type 1 and Type 2. This means that other scenarios might obtained shorter evacuation times and the difference between Scenario 1 and Scenario 2 might be shorter in terms of RSET. However, since the difference between the Scenario 1 and Scenario 2 in terms of ASET is less than 1 minute, any increase in the smoke compartment size and the corresponding evacuation times can cause a problem during the evacuation process.
4 5 6 7 8 9 10 11 12 13 14 15 16 17 18 19 20 21 22 23 24 25 26 27 28 29 30 31 32 33 34 35 36 37 38 39 40 41 42 43 44 45 46 47 48 49 50 51 52 53 54 55 56 57 58 59 60 61
This paper shows the impact of increasing the smoke compartment size, especially in terms of RSET; however, it should be noted that neither scenarios (1 or 2) provide safety to all occupants due to the effects of smoke. In this particular scenario, more staff would be required to ensure that all patients can reach other smoke compartment. However, this is a hypothetical scenario and the results might change in other hospitals with a different geometry, considering other fire scenarios or with additional passive and active fire protection systems. Although it is not possible to provide a general judgement regarding the number of staff required to provide an appropriate level of safety, this paper shows that the use of computer evacuation model offers a suitable tool to support the emergency management in hospitals by analyzing and defining the specific characteristics of any hospital.
6. Limitations
It should be noted that there is a lack of data regarding the parameters that define the evacuation procedures in these types of scenarios. Further work should offer more reliable data about the preparation times and transportation speeds in this kind of environment.
This paper is focused on sleeping area, more research is required to analyze other areas within the hospital such as treatment areas, ICU, bariatrics, etc. in order to identify different variables to be considered or collect input data.
Most current models do not allow to directly simulate an assisted evacuation process, STEPS allows the users to calibrate its inputs in order to represent the assisted evacuation in a realistic manner. However, some limitations regarding the calibration should be taken into account:
- The number and category of patients, the evacuation procedures and the location per room have to be previously defined by user.
- The relocation routes (from each room to the corresponding exit or smoke compartment) have to be previously defined by user.
- The transportation speed is represented as a reduction of the walking speeds of the staff member instead as a random variable itself.
- STEPS does not reproduce the wheelchair / stretcher movement.
- Fatigue has not been taken into account in the modelling.
7. Conclusions
This paper aims to study the impact of increasing the size of the smoke compartment in a health care facility on the evacuation process of patients. This study was focused on the horizontal movement of the patients from the affected smoke compartment and assembling them in adjacent compartments. Furthermore, this work analyzed the sleeping areas in a hospital during the night time, which was assumed to be worst case, considering all the rooms occupied and low ratios of patients/health care personnel.
3 4 5 6 7 8 9 10 11 12 13 14 15 16 17 18 19 20 21 22 23 24 25 26 27 28 29 30 31 32 33 34 35 36 37 38 39 40 41 42 43 44 45 46 47 48 49 50 51 52 53 54 55 56 57 58 59 60 61 62
The current evacuation models are mainly developed for simulating self-evacuation processes. However, some models have the capability to be calibrated for representing an assisted evacuation. In this paper we present and propose a modelling strategy for adapting STEPS model in normal conditions to simulate assisted evacuation.
Results of horizontal evacuation modeling in a health care facility showed that the change of the smoke compartment size from 22,500 ft2 to 40,000 ft2 increased the evacuation time by 13% (more than 7 minutes). This increase is mainly affected by the distribution of patients in their rooms and the selected evacuation procedures. A stochastic modeling has been conducted in order to ensure statistically significant results (evacuation times) for the application hospital.
The analysis of the different ratios of health care personnel assistance during an emergency showed that this is an important factor that can highly impact the evacuation procedure and the required times for relocation. In the analyzed cases, as long as we increase the ratio of patients per health care personnel from 1:2 to 1:4 the mean evacuation time can double The comparison of ASET and RSET identified whether or not the patients would be affected by a fire in a larger smoke compartment.
ASET did not differ when comparing both small and large compartment. In Scenario 1, all exits were blocked after 16 min. On the other hand, for Scenario 2, all exits were unavailable 16:55min after the fire started in the room. This difference (less than 1min) is lower than the difference in RSET. In this case, visibility seems not to be the deciding factor and other parameters such as toxicity might affect both, patients and staff.
In the hypothetical hospital analyzed in this paper, the ASET - RSET comparison highlighted that neither scenario (Scenario 1 or Scenario 2) provides an appropriate level of safety for patients and more staff is required to ensure a safe evacuation.
Each hospital has its own emergency plan, which establishes the evacuation procedure. Those evacuation procedures should take into account (i.e. based on statistics) the possible scenarios to be considered, including the percentages per type of patients. In addition, the use of appropriate evacuation models can support the decision making regarding the minimum number of staff required to ensure a safe evacuation in case of fire.
Acknowledgments
The authors acknowledge the support of The Fire Research Foundation (National Fire Protection association). We appreciate the guidance provided by the Project Technical Panel: Ken Bush (Maryland State Fire Marshal’s Office), Rita Fahy (NFPA), Bob Harmeyers (MSKTD & Associates), Rick Horeis (HDR Architecture, Inc), Enrico Rochi (Lund University), Ron Cole (NFPA Staff Liaison) and Robert Solomon (NFPA Staff Liaison). 4 5 6 7 8 9 10 11 12 13 14 15 16 17 18 19 20 21 22 23 24 25 26 27 28 29 30 31 32 33 34 35 36 37 38 39 40 41 42 43 44 45 46 47 48 49 50 51 52 53 54 55 56 57 58 59 60 61
References
[1] E.D. Kuligowski, R.D. Peacock, B.L. Hoskins. A Review of Building Evacuation Models, Technical Note 1680 (2nd edition), NIST, Gaithersburg, 2010.
[2] C.J.E. Castle. Guidelines for Assessing Pedestrian Evacuation Software Applications Centre for Advanced Spatial Analysis University College London, London (2007) (Paper 115).
[3] G. Santos, B.E. Aguirre, A critical review of emergency evacuation simulation models, in: Proceedings of the NIST Workshop on Building Occupant Movement during Fire Emergencies, Gaithersburg, 2004, pp. 25–50.
[4] S.M.V. Gwynne, E.R. Galea, M. Owen, P.J. Lawrence, L. Filippidis, Review of modeling methodologies used in the simulation of evacuation, J. Build. Environ., 34 (1999), pp. 441– 749.
[5] S.M.V. Gwynne, E.D. Kuligowski, Application modes of egress simulation, in: Proceedings of the Pedestrian and Evacuation Dynamics, Wuppertal (2008).
[6] J.A. Capote, D. Alvear, O. Abreu, A. Cuesta, V. Alonso A real-time stochastic evacuation model for road tunnels Saf. Sci., 52, 2013, pp. 73–80
[7] J.A. Capote, D. Alvear, A. Abreu, A. Cuesta, V. Alonso, A stochastic approach for simulation human behavior during evacuation process in passenger trains, Fire Technol., 44 (4), 2012, pp. 911–925
[8] R.W. Bukowski, R.D. Peacock, W.W. Jones, Sensitivy examination of the airEXODUS aircraft evacuation simulation model, in: Proceedings of the International Aircraft Fire Cabin Research Conference, Atlantic City, USA, 1998, pp. 16–20.
[9] STEPS Simulation of Transient and Pedestrian movementS: User Manual, unpublished, available with egress model from Mott MacDonald. http://www.mottmac.com.
[10] Thunderhead Engineering (2014) Verification and Validation – Pathfinder 2014.3.1208 [11] Arup (2015), The Verification and Validation of MassMotion for Evacuation Modeling [12] D. Golmohammadi, D. Shimshak, Estimation of the evacuation time in an emergency situation in hospitals, Computer & Industrial Engineering, 61 (2001), 1256-1267.
[13] C. Johnson, Using Computer Simulations to Support A Risk-Based Approach for Hospital Evacuation, Technical Report, University of Glasgow, 2005. http://www.dcs.gla.ac.uk/~johnson/papers/G-HES.PDF
[14] MacCallum, C. et al An investigation and analysis of pre-movement and evacuation times, procedures and behavior in Irish health sector building, Proceedings of 6th Conference International Symposium Human Behaviour in Fire 2015, September 28-30, 2015 Cambridge, UK.
[15] D.A. Purser, Fire safety and evacuation implications from behaviours and hazard development in two fatal care home incidents. Fire and Materials 2014 DOI: 10.1002/fam.2250.
[16] M. Burroughs, M., E.D. Galea, Real Time, Real Fire, Real Response: An analysis of response behavior in housing for vulnerable people, Proceedings of 6th Conference International Symposium Human Behaviour in Fire 2015, September 28-30, 2015 Cambridge, UK. 3 4 5 6 7 8 9 10 11 12 13 14 15 16 17 18 19 20 21 22 23 24 25 26 27 28 29 30 31 32 33 34 35 36 37 38 39 40 41 42 43 44 45 46 47 48 49 50 51 52 53 54 55 56 57 58 59 60 61 62
[17] E.D. Kuligowsi, et al, Stair evacuation of older adults and people with mobility impairments, Fire Safety Journal, Vol. 62, pp 230-237, 2013.
[18] A. Hunt, E. Galea, P Lawrence, An analysis of the performance of trained staff using movement assist devices to evacuate the non-ambulant, Proceedings of Human Behavior on Fire, Cambridge, UK, 2012.
[19] S.Gwynne et al, The collection of pre-evacuation times from evacuation trials involving a hospital outpatient area and a University Library facility, 2013, Fire Safety Science 7: 877-888.
[20] J.J. Fruin, Service Pedestrian Planning and Design, MAUDEP, Elevator World Educational Services Division, Mobile, Alabama, 1971, reprinted 1987.
[21] J.D. Averill, Five grand challenges in pedestrian and evacuation dynamics, in: Proceedings of the 5th Conference on Pedestrian and Evacuation Dynamics, Gaithersburg, 2010.
[22] D. Alvear, O. Abreu, A. Cuesta, V. Alonso, A new method for assessing the application of deterministic or stochastic approach in evacuation scenarios. Fire Safety Journal, Vol. 65, 2014, pp. 11-18.
[23] E. Ronchi, P.A. Reneke, R.D. Peacock (2014), A Method for the Analysis of Behavioural Uncertainty in Evacuation Modelling, Fire Technology, 50(6): 1-27.
[24] V. Alonso, Egress modelling in health care occupancies, The Fire Protection Research Foundation, USA, Retrieved July 2014, from http://www.nfpa.org/research/fire-protection- research-foundation/projects-reports-and-proceedings/building-and-life-safety/general-life-safety-issues/egress-modelling-in-health-care-occupancies.
[25] K. McGrattan, S. Hostikka, R. McDermott, J. Floyd, C. Weinschenk, K. Overholt, ‘Fire Dynamics Simulator, Technical Reference Guide. Volume 1: Mathematical Model’, NIST Special Publication 1018-1, Sixth Edition, 2016.
[26] NUREG 1824 Verification and Validation of Selected Fire Models for Nuclear Power Plant Applications Volume 7: Fire Dynamics Simulator (FDS), USNRC, EPRI, 2007.
[27] K. McGrattan, R. McDermott, C. Weinschenk, S. Hostikka, J. Floyd, ‘Fire Dynamics Simulator User’s guide’, NIST Special Publication 1019, 20
[28] W. D. Walton, E. K. Budnick, ‘Quick response sprinklers in office configurations: fire test results’, U.S. Department of commerce, NBSIR 88-3695, January 1988.
[29]PD 7974-6:2004 The application of fire safety engineering priciples to fire safety design of buildings. Human factors. Life safety strategies. Occupant evacuation, behaviour and condition (Sub-system 6). 4 5 6 7 8 9 10 11 12 13 14 15 16 17 18 19 20 21 22 23 24 25 26 27 28 29 30 31 32 33 34 35 36 37 38 39 40 41 42 43 44 45 46 47 48 49 50 51 52 53 54 55 56 57 58 59 60 61