TítuloOffensive Transitions in High Performance Football: Differences Between UEFA Euro 2008 and UEFA Euro 2016
10
0
0
Texto completo
(2) Maneiro et al.. Offensive Transitions in High-Performance Football. Works that have studied attack mechanisms in football confirm that attacks in transition (rapid attacks or counterattacks) have greater chances of success (goals scored, throws to goal or arrivals to the area) than other attack styles (Tenga et al., 2010a,b; Barreira et al., 2013; Sgrò et al., 2017; Fernández-Navarro et al., 2018). Analyzing in detail behaviors that modulate or condition the effectiveness of these actions, preceding works have highlighted a series of variables that teams must take into account. The beginning zone of the offensive transition has been analyzed in different studies. The vast majority of literature has agreed that offensive success effectiveness increases the closer to the rival goal the transition is achieved (Tenga et al., 2010a,b; Lago et al., 2012) although with moderate differences depending of the starting sector (James et al., 2002; Barreira et al., 2014b; Casal et al., 2016). Probably this lack of consensus is provoked by different proposals of field division. With regard to the progression strategy to rival goal or conservation immediately after ball recovery, most of the available data confirm that rapid and direct progression is the most effective behavior, both when producing area arrivals as goals attainment (Tenga et al., 2010a,b; Zurloni et al., 2014; Casal et al., 2015). Although works that disagree with these results should also be taken into account (Tenga et al., 2010c; Sgrò et al., 2016). Regarding the sequence of passes used in the offensive transition, different results are also found among the scientific community. In this sense, a large majority of publications emphasize that the use of a small number of passes constitutes the most effective offensive procedure (≤4 passes) (Mombaerts, 2000; Acar et al., 2009; Lago et al., 2012), although there are works that reject these results (Tenga et al., 2010c; Barreira et al., 2014b). Finally, with regard to the transition duration, the available data allows us to speak of a general consensus among different authors. Thus, practically all studies conclude that they must be actions developed at high speed to be successful (Wallace and Norton, 2014), with a temporal margin that varies between 100 and 500 (Gréhaigne, 2001; Hughes and Churchill, 2005; Acar et al., 2009) and ≤1500 (Garganta et al., 1997; Carling et al., 2005). All the data and evidence presented have highlighted the importance of offensive transitions during matches. At the methodological level, many of the works consulted are of a quantitative nature (motion analysis), based on competition description through element or behavior frequency. In this work, in addition to a quantitative analysis, a complementary qualitative analysis will be carried out, thus providing greater uniqueness and a more objective and holistic view to the study of the football reality and transitions in particular. For this, the ideal option is systematic observation, thus ensuring a balance between the robustness of quantitative data, and the flexibility provided by qualitative data, in order to make a more objective approach of the observed reality. For this, the present study starts from a mixed methods perspective (Johnson et al., 2007; Creswell, 2011; Creswell and Plano-Clark, 2011; Freshwater, 2012; Anguera et al., 2018b). The integration of quantitative and qualitative data from the mixed methods perspective will allow proposing a holistic. of the ball through possession of the same is not marked by any temporary limit regulation, teams have full freedom to start or finish possession when they deem appropriate (Castelano, 2008). Team general tactics imply a constant interaction between attack and defense patterns (Barreira et al., 2014b; Araújo and Davids, 2016; Maneiro and Amatria, 2018). The complex nature of these interactions (Duarte et al., 2012), conditions the passage from one phase to another, so it requires a time of adaptation, which includes differentiated behaviors in the case of defending after attacking (defensive transition), or attacking after defending (offensive transition). An offensive transition (or defense-attack transition) is considered all technical-tactical actions that a team makes since regaining possession of the ball in play and seek to take advantage of the rival’s collective reorganization (which is at that moment in defensive transition), to achieve an optimal progression situation of the ball and/or end, until it is organized offensively (organized attack) or the opponent is reorganized defensively (organized defense) (Casal et al., 2015). In today’s football, the importance of the attack that starts with an offensive transition has experienced an increasing importance, according to several works (Mombaerts, 2000; Gréhaigne, 2001; Carling et al., 2005; Yiannakos and Armatas, 2006; Acar et al., 2009; Armatas and Yiannakos, 2010; Tenga et al., 2010b; Barreira et al., 2013; Leite, 2013; Plummer, 2013; Sarmento et al., 2014; Casal et al., 2015; Winter and Pfeiffer, 2015; Sgrò et al., 2016; Fernández-Navarro et al., 2018). The purpose of offensive transitions varies according to the needs and will of the team that executes them. A direct and rapid offensive transition, with immediate goal search, is associated with two types of offensive end-of-play behaviors: counterattack and direct attack. On the other hand, an elaboration offensive transition, without immediate search of goal, and attack or defense not presenting organized patterns, is associated with progression behaviors toward the attack or as a means to reach various offensive subprinciples (Tenga et al., 2009, 2010c; Fernández-Navarro et al., 2018). Offensive transition moments become unique actions due to the fluidity of the game’s dynamics. These are situations of role change, of an open nature, and to which we should add special spatial conditions (the game action takes place in wide spaces) and temporary ones (these are actions that are usually carried out at high speeds) (Lago et al., 2012). In addition, they are actions that emerge from a certain disorder, from role change because of the change in ball possession. It is important to remember that the game is a continuous, cyclical and non-linear process, where attack, defense and transitions do not exist separately. Some phases condition and are conditioned by others. The defensive moment of the game begins before the loss of the ball, just as the offensive moment begins before the recovery. Therefore, a rational occupation of the strategic space is important, as well as knowing the rival’s tactical behavior. Whenever there is an offensive transition, there is an antagonistic response from the opposing team, in the form of a defensive transition (Vogelbein et al., 2014; Winter and Pfeiffer, 2015; Casal et al., 2016).. Frontiers in Psychology | www.frontiersin.org. 2. June 2019 | Volume 10 | Article 1230.
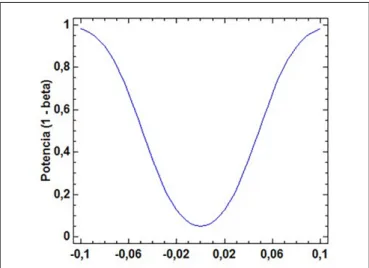
(3) Maneiro et al.. Offensive Transitions in High-Performance Football. the STATGRAPHICS Centurion program, v16, was used to analyze proportions.. and integral model, allowing a more objective approach of the observed reality. Systematic observation, both direct and indirect, provides qualitative information on the registry, focused, respectively, on transition quality and previous documents (Gorard and Makopoulou, 2012; Anguera et al., 2017, 2018a), which will be followed by a second quantitative stage (data quality control and data analysis), to recover the initial objective by discussing results. In this way, a new methodological alternative to the study of football and its different manifestations is opened, proposing solutions to the aforementioned complex reality (Duarte et al., 2012). The observational methodology application will achieve the objectives set out in the present work, which are: on the one hand, to know the differences in terms of regularity and usual execution practices in offensive transitions executed during the European Championship of Nations Euro 2008 and UEFA Euro 2016; and, on the other hand, by performing different multivariate analysis, design an execution model of the offensive transitions with greater probabilities of success, for both championships, and identify the differences between both models.. Procedure The meetings were recorded from images broadcast on television. According to the Belmont Report (National Commission for the Protection of Human Subjects of Biomedical, and Behavioral Research, 1978) the use of public images for research purpose does not require informed consent or approval of an ethical committee. There were four observers selected for data collection, four of them being doctors in Sports Science. Three are national soccer coaches, and also with more than 5 years of experience in the use and application of observational methodology. Prior to the coding process, observers were trained during eight training sessions (Losada and Manolov, 2015; Manolov and Losada, 2017), applying the consensual agreement criterion among observers and were provided with a specifically designed observation protocol.. Data Quality Control The quality control of the data was carried out using the IBM SPSS Statistics 25. To try to ensure data reliability, all matches were registered and analyzed by four observers, three of them national soccer coaches with years of experience in the field of training, teaching, and research in football through observational methodology. In addition, the following training process was carried out. First, eight observing sessions were conducted on teaching the observers following the Losada and Manolov (2015) criteria and applying the criterion of consensual agreement (Anguera, 1990) among observers, so that recording was only done when agreement was produced. To ensure inter-reliability consistency of the data (Berk, 1979), the Kappa coefficient was calculated for each criterion (Table 1), it revealed a strong agreement between observers, which means high reliability, taking Fleiss et al. (2003) as a reference.. MATERIALS AND METHODS Design Among the possible designs that can be presented by the observational methodology, a nomothetic, intersessional monitoring and multidimensional design was applied (Anguera, 1979). Nomothetic because a plurality of units are studied, intersessional over time and multidimensional because we analyzed the multiple dimensions that constituted the ad hoc observation instrument used. The systematic observation carried out has been nonparticipant and active, using an observational sampling “all occurrence”.. Participants In this study, the analysis unit is the defense-attack transitions in top-level football. The observation sample was a convenience sample (Anguera et al., 2011). We analyzed 1,533 events corresponding to the observation of 14 matches, during the Quarter-finals, semi-finals and finals of UEFA Euro 2008 and UEFA Euro 2016. These matches are played in the direct elimination mode, which causes both teams to need offensive attack procedures to achieve a positive result.. Data Analysis As regards data analysis, and in accordance with the objectives set, three types of analysis were defined: by means of a proportion analysis and the application of a chi-square test, the aim was to describe differences on the championship level, and the modulating variables level, in the execution and habitual practices of the offensive transitions between both championships. Then, three types of analysis were carried out: a logistic regression to know the variables that may be modulating the effectiveness achieved; the Mcfadden test was applied to check the model’s goodness of fit. Finally, an ANOVA analysis was implemented to analyze the variance and deviation table. The aim is to know the differences between successful models for UEFA Euro 2008 and UEFA Euro 2016.. Observation Instrument The observation instrument proposed by Casal (2011) was used. In it, the inclusion and exclusion criteria can be consulted. This observation instrument is made up of a combination of field formats and category systems, where the dimensions of the instrument’s categories and the inclusion and exclusion criteria can be consulted. Data was collected and coded using the LINCE software (v 1.2.1, Gabin et al., 2012). The IBM SPSS Statistics 25 program for descriptive and bivariate analysis and the R program for multivariate analysis were used as analysis tools. Finally,. Frontiers in Psychology | www.frontiersin.org. RESULTS First, a proportion comparison (Figure 1) has been carried out using the binomial test. Data presented in Figure 1. 3. June 2019 | Volume 10 | Article 1230.
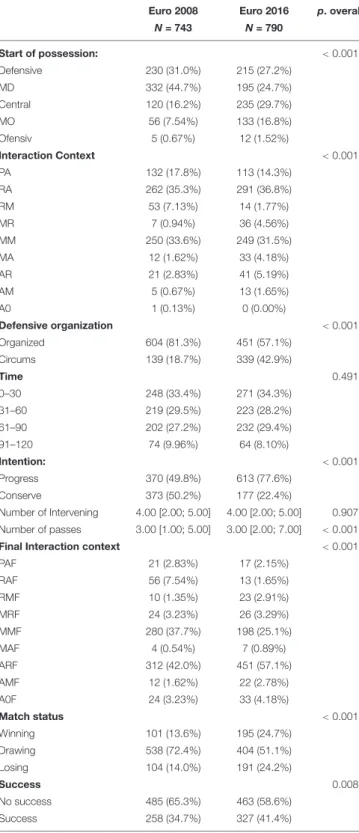
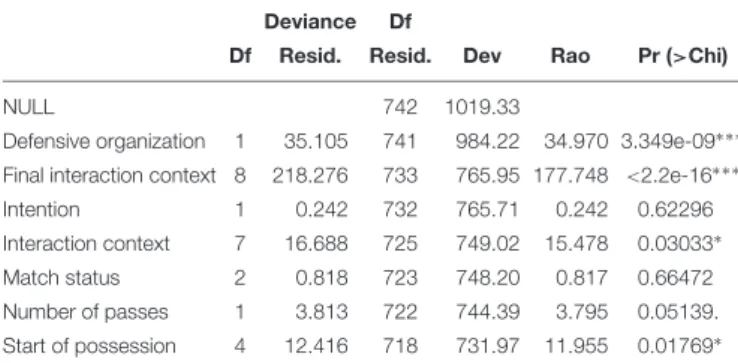
(4) Maneiro et al.. Offensive Transitions in High-Performance Football. TABLE 1 | The interobserver agreement analysis for each criterion. Criteria. Ob1 –Ob2. Ob1 –Ob3. Ob1 –Ob4. Ob2 –Ob3. Ob2 –Ob4. Ob3 –Ob4. Start of possession. 0,82. 0,83. 0,86. 0,82. 0,87. 0,91. Interaction context. 0,74. 0,74. 0,81. 1. 0,76. 0,75. Defensive organization. 0,81. 0.85. 0,83. 0,78. 0,8. 0,8. 1. 0,96. 1. 0,84. 1. 0,81 0,82. Time Intention. 0,8. 0,82. 0,72. 0,91. 0,87. Number of Intervening. 0,82. 0,72. 1. 0,86. 0,72. 1. 1. 0,80. 0,80. 0,92. 1. 0,86. Final interaction context. 0,76. 0,81. 0.92. 0,81. 0,83. 0,81. Match status. 0,9. 1. 1. 1. 1. 0,88. 1. 1. 0,88. 1. 0,9. 1. 0,86. 0,85. 0,88. 0,87. 0,81. 0,86. Number of passes. Success K total. shows statistically significant differences between the UEFA Euro 2008 and UEFA Euro 2016 championships (sample proportions = 0.347 and 0.413, sample size = 743 and 790).. whether or not they are the same, in both competitions, based on their Deviances. Specifically, for the UEFA Euro 2008, the proposed model is: Success = µ + β1 DefensiveOrganization + β2 FinalInteractionContext + β3 Intention + β4 InteractionContext + β5 MatchStatus + β6 NumberOfPasses + β7 StartOfPossession. Statistics z calculated = −2.65932; p = 0.007. On the other hand, data presented in Table 2 shows statistically significant differences between variables considered for each championship. Specifically, there are eight variables that present significant differences between both championships: “Start of possession” (p < 0.001), “Interaction Context” (p < 0.001), “Defensive Organization” (p < 0.001), “Intention” (p < 0.001), “Number of passes” (p < 0.001), “Final Interaction Context” (p < 0.001), “Match status” (p < 0.001) and “Success” (p = 0.008). The quantitative variable “No. of Intervening” does not follow a normal distribution (Figures 2, 3). Finally, an analysis was applied based on a logistic regression model (Tables 3, 4) configured by the same predictor and explained variables, for both UEFA Euro 2008 and UEFA Euro 2016 championships, in order to be able to compare which variables are significant in achieving success, and knowing. The adjustment of the model is checked with the McFadden test with a value of 0.0589. The accuracy in the predictive capacity of the model is 0.918 (Accuracy). Next, an Anova analysis was executed in the model to analyze the deviation table. By specifying a single model, a sequential analysis of the deviation table is made to fit. That is, the reductions in the residual deviation that is added to each model term, in addition to the residual deviations themselves. The wider the difference between the zero deviation and the residual deviation, the better. Analysis of the table shows the descent of the deviation when adding each variable. The addition of “Final Interaction Context” significantly reduces the residual deviation. A large p-value indicates that the model without the variable explains more or less the same amount of variation. Ultimately, the optimum is a significant drop in deviation. Finally, the Rao efficient scoring test was applied, which has an asymptotic chi-square distribution to detect the most influential factors in success. On the other hand, the proposed model for the UEFA Euro 2016 is: Success = µ + β1 DefensiveOrganization + β2 FinalInteractionContext + β3 Intention + β4 InteractionContext + β5 MatchStatus + β6 NumberOfPasses + β7 StartOfPossession The adjustment of the model is checked with the McFadden test with a value of 0.2819095. The accuracy in the predictive capacity of the model is 0.5128 (Accuracy). An Anova analysis is performed in the model to analyze the deviation table. By specifying a single model, a sequential analysis of the deviation table is made to fit. That is, the reductions in the residual deviation that is added to each term of the formula, in addition to the residual deviations themselves. The wider the difference between the zero deviation and the residual deviation, the better. Analysis of the table shows. FIGURE 1 | Proportion analysis for the UEFA Euro 2008 and UEFA Euto 2016 samples. Power curve (alpha = 0.05, average ratio = 0.381012).. Frontiers in Psychology | www.frontiersin.org. 4. June 2019 | Volume 10 | Article 1230.
(5) Maneiro et al.. Offensive Transitions in High-Performance Football. asymptotic chi-square distribution to detect the most influential factors in success. In summary, variables that provide information to the explained variable “success,” in the case of Eurocopa 2008, is the predictive variable “Final Interaction Context”. The inclusion of other variables does not provide any variation in the model. In the case of Euro 2016, the variables “Defensive Organization,” “Final Interaction Context,” “Interaction Context,” “Number Of Passes,” and “Start Of Possession,” decrease the residual deviance and therefore are important in the model. Depending on the competition, all of them participate significantly in success achievement in the game.. TABLE 2 | Summary descriptives table by groups of “competition”. Euro 2008. Euro 2016. N = 743. N = 790. Defensive. 230 (31.0%). 215 (27.2%). MD. 332 (44.7%). 195 (24.7%). Central. 120 (16.2%). 235 (29.7%). MO. 56 (7.54%). 133 (16.8%). Ofensiv. 5 (0.67%). 12 (1.52%). PA. 132 (17.8%). 113 (14.3%). RA. 262 (35.3%). 291 (36.8%). RM. 53 (7.13%). 14 (1.77%). MR. 7 (0.94%). 36 (4.56%). MM. 250 (33.6%). 249 (31.5%). < 0.001. Start of possession:. < 0.001. Interaction Context. MA. 12 (1.62%). 33 (4.18%). AR. 21 (2.83%). 41 (5.19%). AM. 5 (0.67%). 13 (1.65%). A0. 1 (0.13%). 0 (0.00%). Organized. 604 (81.3%). 451 (57.1%). Circums. 139 (18.7%). 339 (42.9%). 0–30. 248 (33.4%). 271 (34.3%). 31–60. 219 (29.5%). 223 (28.2%). 61–90. 202 (27.2%). 232 (29.4%). 91–120. 74 (9.96%). 64 (8.10%). 370 (49.8%). 613 (77.6%). Time. The present work was proposed with the objective of identifying and describing possible differences in the execution of defenseattack transitions in one of the most important championship of nations: the UEFA Euro. For this, the editions of 2008 and 2016 have been analyzed. By performing different statistical analysis (accompanied by a proportion analysis, a chi-square contrast and various logistic regression analysis), and in view of the available data, it can be verified that these actions do present different behavior patterns between both championships. In the first place, as regards the first of the stated objectives, it can be said that significant differences in a championship level between UEFA Euro 2008 and UEFA Euro 2016 are found. In particular, during the last championship there has been an increase in 6.32% of the number of offensive transitions (p = 0.007) compared to the 2008 championship. These results allow us to think that attack game dynamics have evolved toward open nature patterns, with the development of the game in wider spaces and with shorter offensive actions. This occurs to the detriment of more elaborate attack mechanisms, where high defensive density and reduced time in decision-making hinders the creation of favorable superiority contexts (Wallace and Norton, 2014; Barreira et al., 2015; Casal et al., 2017). As a consequence, it is plausible to affirm that new teams take advantage of the possible moments of uncertainty and stress caused by the role change during the game. Furthermore, this change in attack mechanisms has probably also emerged answering to new scenarios in the environmental conditions of the game, such as the partial result of the game, competition type or the opposing team quality (Lago, 2009). Finally, available results allow to qualify works where it is concluded that soccer has barely changed in the last decades (Castellano et al., 2008). This work corroborates previous works in which the evidence of football evolution has been contrasted (Wallace and Norton, 2014; Barreira et al., 2014a, 2015). About the second objective, to know differences between the efficiency degree achieved and the different variables considered in both championships, it has been detected that teams have experienced a marked evolution regarding the beginning zone of the transition, passing from the mid-defensive zone to the central area of the field. In addition, there has also been a noticeable increase in the recoveries that occur in the medium-offensive. 0.491. < 0.001. Intention: Conserve. DISCUSSION. < 0.001. Defensive organization. Progress. p. overall. 373 (50.2%). 177 (22.4%). Number of Intervening. 4.00 [2.00; 5.00]. 4.00 [2.00; 5.00]. 0.907. Number of passes. 3.00 [1.00; 5.00]. 3.00 [2.00; 7.00]. < 0.001. PAF. 21 (2.83%). 17 (2.15%). RAF. 56 (7.54%). 13 (1.65%). RMF. 10 (1.35%). 23 (2.91%). MRF. 24 (3.23%). 26 (3.29%). MMF. 280 (37.7%). 198 (25.1%). < 0.001. Final Interaction context. MAF. 4 (0.54%). 7 (0.89%). ARF. 312 (42.0%). 451 (57.1%). AMF. 12 (1.62%). 22 (2.78%). A0F. 24 (3.23%). 33 (4.18%). Winning. 101 (13.6%). 195 (24.7%). Drawing. 538 (72.4%). 404 (51.1%). Losing. 104 (14.0%). 191 (24.2%). No success. 485 (65.3%). 463 (58.6%). Success. 258 (34.7%). 327 (41.4%). < 0.001. Match status. Success. 0.008. the descent of the deviation when adding each variable. The addition of “Defensive Organization,” “Final Interaction Context,” “Interaction Context,” “Number Of Passes,” and “Start Of Possession” significantly reduces the residual deviation. Finally, the Rao efficient scoring test was applied, which has an. Frontiers in Psychology | www.frontiersin.org. 5. June 2019 | Volume 10 | Article 1230.
(6) Maneiro et al.. Offensive Transitions in High-Performance Football. FIGURE 2 | Distribution for the quantitative variable Number of Intervening. Shapiro–Wilks p-value: <001.. zone compared to the 2008 Euro edition. This circumstance may be due to a better management of the technical, tactical and physical player resources, since according to different works (Tenga et al., 2010a,b; Lago et al., 2012), the optimal zone of ball recovery is in the offensive midfield, especially in regions near the rival goal (Barreira et al., 2014a).. This fact causes less physical wear and less demand for complex tactical benefits (attack construction begins in areas close to the target). Ball recovery in this zone would allow a greater use of the game phase weaknesses in which the opponent is situated (attack construction and ball possession), that when being in attack deployment, this propitiates the appearance of larger spaces between the different lines (inter-lines), as well as between players of the same line (intra-line), a circumstance that the defending team can take advantage of at the moment of role change (move to attack after defending) to advance or finalize the action. In addition, the ball recovery in areas close to the rival goal means, in most cases, that the attacking team will only have. TABLE 3 | Analysis of deviance table. Deviance. Df. Df. Resid.. Resid 742. 959.54. 1. 1.267. 741. 958.28. Final interaction context 8. 36.979. 733. 921.30 30.7907 0.0001531∗∗∗. NULL Defensive organization. Rao. Pr (>Chi). 1.2835 0.2572498. Intention. 1. 1.413. 732. 919.8. Interaction context. 8. 13.117. 724. 906.77 12.6617 0.1240335. 1.4155 0.2341398. Match status. 2. 0.378. 722. 906.39. 0.3759 0.8286680. Number of passes. 1. 0.772. 721. 905.62. 0.7830 0.3762162. Start of possession. 4. 2.626. 717. 902.99. 2.6298 0.6215546. Model, binomial, link logit, and response success Significance codes: 0 ‘∗∗∗ ’ 0.001 ‘’ 1.. FIGURE 3 | Boxplot of Number of Intervening by competition.. Frontiers in Psychology | www.frontiersin.org. Dev. 6. June 2019 | Volume 10 | Article 1230.
(7) Maneiro et al.. Offensive Transitions in High-Performance Football. On the other hand, significant results were found regarding the “Tactical Intention” of the team immediately after ball recovery. Although in the 2008 edition teams opted for a balanced disposition between progressing toward a rival goal or keeping the ball at the beginning of the offensive transition, 8 years later teams have a clear desire to progress toward offensive areas. These data could be directly related to the variable “Defensive Organization,” it is possible that a defensive behavior causes the appearance of an offensive and antagonistic behavior in the rival team, and vice versa. On the other hand, the works of Tenga et al. (2010b) and Lago et al. (2012), state that counterattacks are the ideal attack against disorganized defenses. On the other hand, it should be noted that the importance of this variable is still under debate in scientific literature (Tenga et al., 2010c; Sgrò et al., 2016; Sgrò et al., 2017). Regarding the “Number of Passes” variable, results show significant differences. In particular, it is possible to highlight an increase in the variance of these actions in the Euro 2016 edition. This corroborates previous works such as those of Barreira et al. (2014b), which currently confirm a new tactical alternative in teams, based on greater collective behavior in offensive transitions; and Tenga et al. (2010c), who report higher efficiency rates with long possessions (>5 passes). The “Final Interaction Context,” the spatial configuration of both teams at the moment in which the observed team finishes its offensive sequence, presents significant differences (<0.001). Lower finalization rates have been found in the MMF context, and instead higher rates (15% more) of offensive transitions ending in the ARF context are collected, as well as better results for the AMF and A0F contexts. Again, this behavior reinforces the evidence presented: in these 8 years, teams have greater offensive will. In regard to the “Partial Result of the Match,” variable regularly collected in scientific literature, it is possible to refer significant changes (<0.001). Despite the fact that a large part of the offensive transitions are executed with a draw (51.1%), a strong evolution is observed in comparison to the 2008 championship. In particular, one of every two offensive transitions occurs with an imbalance in the scoreboard. A possible explanation could be found in that this imbalance occurs in very early phases of the game, which rival teams fail to neutralize in successive instants, thus promoting the existence of more effective time with an unbalanced score. Another possible explanation could lie in the fact that teams in the UEFA Euro 2016 have higher rates of circumstantial defense (<0.001), a situation that could cause attack levels to be above defense levels. Finally, the possible team heterogeneity in terms of quality, which promotes unstable markers on a regular basis as a last possible explanation. Finally, “Success” rates at UEFA Euro 2016 are significantly higher than at UEFA Euro 2008. 41.4% of offensive transitions have been successful, in comparison to 34.7% at UEFA Euro 2008. It is worth remembering that this paper collects performance indicators collected in Casal et al. (2015) as success. In short, empirical data reveals the tactical alternative success of the teams that have opted for defense-attack transitions with a marked finalizing character, with an immediate search for auction opportunities, and away from speculative or containment. TABLE 4 | Analysis of deviance table. Deviance. Df. Df. Resid.. Resid.. Dev. 742. 1019.33. 1. 35.105. 741. 984.22. Final interaction context 8. 218.276. 733. 765.95 177.748 <2.2e-16∗∗∗. NULL Defensive organization. Rao. Pr (>Chi). 34.970 3.349e-09∗∗∗. Intention. 1. 0.242. 732. 765.71. 0.242. 0.62296. Interaction context. 7. 16.688. 725. 749.02. 15.478. 0.03033∗. Match status. 2. 0.818. 723. 748.20. 0.817. 0.66472. Number of passes. 1. 3.813. 722. 744.39. 3.795. 0.05139.. Start of possession. 4. 12.416. 718. 731.97. 11.955. 0.01769∗. Model, binomial, link logit, and response success Significance codes: 0 ‘∗∗∗ ’ 0.001 ‘∗ ’ 0.05 ‘.’ 0.1 ‘’ 1.. to overcome the rival defensive line or, at most, this one plus the middle line. With regard to the “Interaction Context” in which the defenseattack transition begins, several authors have highlighted the importance of motor interaction analysis in football (Castellano and Hernández-Mendo, 2003; Garganta, 2009; Sarmento et al., 2018). In view of the available data, it is possible to verify that teams have significantly modified their spatial configuration of interaction, resulting in greater recoveries in the most offensive contexts considered (AM, AR, MA, and MR). These data corroborate the work of Casal et al. (2015), which finds worse data in success terms in the PA category; Almeida et al. (2014), who observe that successful teams recover the ball in areas close to the rival goal: and Castellano and Hernández-Mendo (2003), who associate the MR variable as of great offensive value. Finally, the MM and RA categories continue to appear as the most regular, that is, losses usually occur in the middle and advanced line of the observed team. The frequency of the MM category during transitions allows us to think that it is a transition category, where the team attacks flow with a certain offensive character. The third variable that has shown significant differences has been the type of “Defensive Organization”. Available data of both championships allow to verify a robust evolution in defensive mechanisms. Specifically, the increase of 24.2% of circumstantial defense after role change in ball possession with respect to the 2008 edition allows to speak of two antagonistic aspects: on the one hand, a possible defensive flexibilization is verified by part of the teams, which accept the inherent risks of circumstantial defense (greater defensive disorder and incorrect management of strategic spaces) in favor of potentially greater offensive features (larger spaces and more players in a position to carry out an attack); on the other hand, it identifies possible defensive weaknesses in the teams when they pass from attack to defense. These weaknesses are far from the studies of Casal et al. (2016), where the importance of the defensive transition in the moments following the loss of the ball is highlighted; and from Winter and Pfeiffer (2015), where they affirm that part of the winning teams’ success is due to high performance in these transitions. Transition effectiveness is related to team organization before them.. Frontiers in Psychology | www.frontiersin.org. 7. June 2019 | Volume 10 | Article 1230.
(8) Maneiro et al.. Offensive Transitions in High-Performance Football. Euro 2016 present significantly more offensive behavior than in the 2008 edition. (4) The multivariate model presented for the 2008 edition better predicts offensive transitions in their entirety, but their adjustment is moderate; on the other hand, the model presented for the 2016 competition has worse predictive capacity, but greater adjustment in its entirety.. behavior. Teams have opted for the alternative of initiating transitions in more advanced areas of the field, a moderate variance in the number of passes and finalizing actions in more offensive contexts. Finally, the multivariate analysis carried out has allowed to verify the alternative of the explanatory variables that intervene in the presented models (Tables 3, 4). The test allowed us to measure the extent to which the accuracy of the complete model improves compared to the reduced model. In this case, for the UEFA Euro 2008, the predictive capacity of the model is very good (0.918), although the only variable that provides information is the “Final Interaction Context,” having a low adjustment level. These results highlight the importance of deciding on which line of the observed team the offensive transition ends and in which defensive line of the rival team it is important to establish this interaction. Some possible explanations for the importance of finishing offensive transitions against the middle or delayed line of the rival team is that the opponent has fewer players in position to defend; on the other hand, if an offensive transition finalizes in this context, it is probably because the ball has been stolen from the midline or delayed line and the defending team is probably disorganized. Finally, it is also congruent to think, in view of the data and the strength of the variable explained, that this finalization should occur in offensive areas, close to the rival goal, as the best means to achieve success. Although it must be taken into account that the model is more efficient taking all variables in their entirety (Table 3). In contrast, for UEFA Euro 2016, although worse values are found in predictive terms, the model has a more robust overall adjustment. In applied terms, it is possible to explain the success of these actions taking into account five variables (“Defensive Organization,” “Final Interaction Context,” “Interaction Context,” “Number Of Passes,” and “Start Of Possession”). This way, the model explains 51% of the offensive transitions in the 2016 championship, with a higher adjustment than the 2008 championship model. In practical terms, it is plausible to think that the results emphasize the importance of the team’s tactical construction, based on a refined space management on where to recover the ball and interact with the opponent, the number of precise passes and the need to know the defensive behavior of the opponent. Also, the inclusion of the variable “Final Interaction Context” in the second model reinforces the suitability of where to end the offensive transition, and against which line of the rival team. It is likely that this finalization, as in the 2008 championship, should occur in offensive areas (AR, front line of the observed team against the opponent’s delayed line).. LIMITATIONS First, it is important to note that the goodness of fit of the explanatory models presented is moderate. Another of the present limitations has to do with the generalization degree of the results or external validity of the same, given that actions corresponding to only one specific competition were selected as the unit of analysis: the UEFA Euro.. FUTURE LINES OF RESEARCH The future lines of research that can be derived from this study include the incorporation of new variables such as possession duration, individual technical behavior of different players and the proposal of a playing field zoning to prioritize optimal spaces to execute offensive transitions. Finally, it would be interesting to perform comparative analysis with domestic league competitions. Undoubtedly, the incorporation of these variables should help reduce the error component in the different models.. AUTHOR CONTRIBUTIONS RM and IÁ collected the data, reviewed the literature, and wrote the manuscript. CC, SL, and JM reviewed the literature and supervised the work critically. JL analyzed the data and performed statistical analyzes. AA performed the method.. ACKNOWLEDGMENTS The authors gratefully acknowledge the support of two Spanish government project: (1) La actividad física y el deporte como potenciadores del estilo de vida saludable: Evaluación del comportamiento deportivo desde metodologías no intrusivas (Secretaría de Estado de Investigación, Desarrollo e Innovación del Ministerio de Economía y Competitividad) during the period 2016–2018 (Grant DEP2015-66069-P; MINECO/FEDER, UE) and (2) Avances metodológicos y tecnológicos en el estudio observacional del comportamiento deportivo (PSI2015-71947REDP, MINECO/FEDER, UE). Generalitat Valenciana project: Análisis observacional de la acción de juego en el fútbol de élite (Consellería d’Educació, Investigació, Cultura I Esport) during the period: 2017–2019 (Grant GV2017-004). In addition, the authors thank the support of the Generalitat de Catalunya Research Group, GRUP DE RECERCA I INNOVACIÓ EN DISSENYS (GRID). Tecnología i aplicació multimedia i digital als dissenys observacionals (Grant Number 2014 SGR 971).. CONCLUSION The main conclusions that can be drawn from this work can be summarized in: (1) Football is not a sport that experiences regular and stable behavior, but behaves like a living organism, which changes and evolves over time. (2) The success of the offensive transitions in the 2016 edition is greater than in the 2008 edition. (3) Offensive transitions executed in the UEFA. Frontiers in Psychology | www.frontiersin.org. 8. June 2019 | Volume 10 | Article 1230.
(9) Maneiro et al.. Offensive Transitions in High-Performance Football. REFERENCES. Castelano, J. (2008). Análisis de las posesiones de balón en fútbo: frecuencia, duración y transición. Eur. J. Hum. Mov. 21, 179–196. Castellano, J., and Hernández-Mendo, A. (2003). El análisis de coordenadas polares para la estimación de relaciones en la interacción motriz en fútbol. Psicothema 15, 569–574. Castellano, J., Perea, A., and Hernández-Mendo, A. (2008). Análisis de la evolución del fútbol a lo largo de los mundiales. Psicothema 20, 928–932. Creswell, J. W. (2011). Research Design, 4rd Edn. Los Angeles, CA: Sage. Creswell, J. W., and Plano-Clark, V. L. (2011). Designing and Conducting Mixed Methods Research, 2nd Edn. Thousand Oaks, CA: Sage. Duarte, R., Araújo, D., Correia, V., and Davids, K. (2012). Sports teams as superorganisms. Sports Med. 42, 633–642. doi: 10.2165/11632450-00000000000000 Fernández-Navarro, J., Fradua, L., Zubillaga, A., and McRobert, A. P. (2018). Influence of contextual variables on styles of play in soccer. Int. J. Perform. Anal. Sport 18, 423–436. doi: 10.1080/24748668.2018.1479925 Fleiss, J. L., Levin, B., and Paik, M. C. (2003). Statistical Methods for Rates and Proportions, 3rd Edn. Hoboken, NJ: John Wiley and Sons. Freshwater, D. (2012). Managing movement, leading change. J. Mix. Methods Res. 6, 3–4. doi: 10.1177/1558689812439873 Gabin, B., Camerino, O., Anguera, M. T., and Castañer, M. (2012). Lince: Multiplatform sport analysis software. Proc. Soc. Behav. Sci. 46, 4692–4694. doi: 10.1016/j.sbspro.2012.06.320 Garganta, J. (2009). Trends of tactical performance analysis in team sports: bridging the gap between research, training and competition. Rev. Port. Cienc. Desporto 9, 81–89. doi: 10.5628/rpcd.09.01.81 Garganta, J., Maia, J., and Basto, F. (1997). “Analysis of goal-scoring patterns in european top level soccer teams,” in Science and Football III, eds T. Reilly, J. Bangsbo, and M. Hugues (London: E & F.N. Spon), 246–250. Gorard, S., and Makopoulou, K. (2012). “Is mixed methods the natural approach to research?” in Research Methods in Physical Education and Youth Sport, eds K. Armour and D. Macdonald (Abingdon: Routledge), 106–119. Gréhaigne, J. (2001). Fútbol. La organización del Juego en el Fútbol. Zaragoza: INDE. Hughes, M., and Churchill, S. (2005). “Attacking profiles of successful and unsuccessful team in Copa America 2001,” in Science and Football V, eds T. Reilly, J. Cabri, and D. Araújo (New York, NY: Routledge), 206–214. James, N., Mellalieu, S. D., and Hollely, C. (2002). Analysis of strategies in soccer as a function of European and domestic competition. Int. J. Perform. Anal. Sport 2, 85–103. doi: 10.1080/24748668.2002.11868263 Johnson, R. B., Onwuegbuzie, A. J., and Turner, L. A. (2007). Toward a definition of mixed methods research. J. Mix. Methods Res. 1, 112–133. doi: 10.1177/ 1558689806298224 Lago, C. (2009). The influence of match location, quality of opposition, and match status on possession strategies in professional association football. J. Sports Sci. 27, 1463–1469. doi: 10.1080/02640410903131681 Lago, J., Lago, C., Rey, E., Casáis, L., and Domínguez, E. (2012). El éxito ofensivo en el fútbol de élite: influencia de los modelos tácticos empleados y de las variables situacionales. Eur. J. Hum. Mov. 145–170. Leite, W. (2013). Euro 2012: Analysis and evaluation of goals scored. Int. J. Sport Sci. 3, 102–106. Losada, J. L., and Manolov, R. (2015). The process of basic training, applied training, maintaining the performance of an observer. Qual. Quant. 49, 339– 347. doi: 10.1007/s11135-014-9989-7 Maneiro, R., and Amatria, M. (2018). Polar coordinate analysis of relationships with teammates, areas of the pitch, and dynamic play in soccer: a study of Xabi Alonso. Front. Psychol. 9:389. doi: 10.3389/fpsyg.2018.00389 Manolov, R., and Losada, J. L. (2017). Simulation theory applied to direct systematic observation. Front. Psychol. 8:905. doi: 10.3389/fpsyg.2017.00905 Mombaerts, E. (2000). Fútbol. Del Análisis del Juego a la Formación del Jugador. Barcelona: INDE. National Commission for the Protection of Human Subjects of Biomedical, and Behavioral Research (1978). The Belmont Report: Ethical Principles and Guidelines for the Protection of Human Subjects of Research, Vol. 2. Washington, DC: National Commission for the Protection of Human Subjects of Biomedical, and Behavioral Research. Plummer, B. T. (2013). Analysis of attacking possessions leading to a goal attempt, and goal scoring patterns within men’s elite soccer. J. Sports Sci. Med. 1, 1–38.. Acar, M. F., Yapicioglu, B., Arikan, N., Yalcin, S., Ates, N., and Ergun, M. (2009). “Analysis of goals scored in the 2006 world cup,” in Proceedings of the 6th World Congress on Science and Football, Science and Football VI, eds T. Reilly and F. Korkusuz (London: Routledge), 233–242. Almeida, C. H., Ferreira, A. P., and Volossovitch, A. (2014). Effects of match location, match status and quality of opposition on regaining possession in UEFA Champions League. J. Hum. Kinet. 41, 203–214. doi: 10.2478/hukin2014-0048 Anguera, M. T. (1979). Observational typology. Qual. Quant. 13, 449–484. Anguera, M. T. (1990). “Metodología observacional,” in Metodología de la Investigación en Ciencias del Comportamiento, eds J. Arnau, M. T. Anguera, and J. Gómez (Murcia: Secretariado de Publicaciones de la Universidad de Murcia), 125–236. Anguera, M. T., Blanco-Villaseñor, A., Hernández-Mendo, A., and Losada, J. L. (2011). Diseños observacionales: ajuste y aplicación en psicología del deporte. [Observational designs: Their suitability and application in sport psychology.] Cuad. Psicol. Dep. 11, 63–76. Anguera, M. T., Blanco-Villaseñor, A., Losada, J. L., Sánchez-Algarra, P., and Onwuegbuzie, A. J. (2018a). Revisiting the difference between mixed methods and multimethods: Is it all in the name? Qual. Quant. 52, 2757–2770. doi: 10.1007/s11135-018-0700-2 Anguera, M. T., Camerino, O., Castañer, M., Sánchez-Algarra, P., and Onwuegbuzie, A. J. (2017). The specificity of observational studies in physical activity and sports sciences: moving forward in fixed methods research and proposals for achieving quantitative and qualitative symmetry. Front. Psychol. 8:2196. doi: 10.3389/fpsyg.2017.02196 Anguera, M. T., Portell, M., Chacón-Moscoso, S., and Sanduvete-Chaves, S. (2018b). Indirect observation in everyday contexts: concepts and methodological guidelines within a mixed methods framework. Front. Psychol. 9:13. doi: 10.3389/fpsyg.2018.00013 Araújo, D., and Davids, K. (2016). Team synergies in sport: theory and measures. Front. Psychol. 7:1449. doi: 10.3389/fpsyg.2016.01449 Armatas, V., and Yiannakos, A. (2010). Analysis and evaluation of goals scored in 2006 World Cup. J.Sport Health Res. 2, 119–128. Barreira, D., Garganta, J., Castellano, J., Machado, J., and Anguera, M. T. (2015). How elite-level soccer dynamics has evolved over the last three decades? Input from generalizability theory. Cuad. Psicol. Dep. 15, 51–62. doi: 10.4321/s157884232015000100005 Barreira, D., Garganta, J., Castellano, J., Prudente, J., and Anguera, M. T. (2014a). Evolución del ataque en el fútbol de élite entre 1982 y 2010: aplicación del análisis secuencial de retardos. Rev. Psicol. Dep. 23, 139–146. Barreira, D., Garganta, J., Guimarães, P., Machado, J., and Anguera, M. T. (2014b). Ball recovery patterns as a performance indicator in elite soccer. J. Sports Eng. Technol. 228, 61–72. doi: 10.1177/1754337113493083 Barreira, D., Garganta, J., Pinto, T., Valente, J., and Anguera, T. (2013). “Do attacking game patterns differ between first and second halves of soccer matches in the 2010 FIFA World Cup?,” in Proceedings of the Seventh World Congress on Science and Football, Routledge, 193. Berk, R. (1979). Generalizability of behavioral observations: a clarification of interobserver agreement and interobserver reliability. Am. J. Ment. Defic. 83, 460–472. Carling, C., Williams, A. M., and Reilly, T. (2005). Handbook of Soccer Match Analysis: A Systematic Approach to Improving Performance. Abingdon: Routledge. Casal, C. A. (2011). Cómo Mejorar la Fase Ofensiva en el Fútbol: Las Transiciones ofensivas. Alemania: Editorial Académica Española. Casal, C. A., Andujar, M. Á., Losada, J. L., Ardá, T., and Maneiro, R. (2016). Identification of defensive performance factors in the 2010 FIFA World Cup South Africa. Sports 4:E54. doi: 10.3390/sports4040054 Casal, C. A., Losada, J. L., and Ardá, A. (2015). Análisis de los factores de rendimiento de las transiciones ofensivas en el fútbol de alto nivel. Rev. Psicol. Dep. 24, 103–110. Casal, C. A., Maneiro, R., Ardá, T., Marí, F. J., and Losada, J. L. (2017). Possession zone as a performance indicator in football. The Game of the Best Teams. Front. Psychol. 8:1176. doi: 10.3389/fpsyg.2017.01176. Frontiers in Psychology | www.frontiersin.org. 9. June 2019 | Volume 10 | Article 1230.
(10) Maneiro et al.. Offensive Transitions in High-Performance Football. Sarmento, H., Anguera, M. T., Pereira, A., Marques, A., Campaniço, J., and Leitão, J. (2014). Patterns of play in the counterattack of elite football teams-A mixed method approach. Int. J. Perform. Anal. Sport 14, 411–427. doi: 10.1080/ 24748668.2014.11868731 Sarmento, H., Clemente, F. M., Araújo, D., Davids, K., McRobert, A., and Figueiredo, A. (2018). What performance analysts need to know about research trends in association football (2012–2016): a systematic review. Sports Med. 48, 799–836. doi: 10.1007/s40279-017-0836-6 Sgrò, F., Aiello, F., Casella, A., and Lipoma, M. (2016). Offensive strategies in the European Football Championship 2012. Percept. Motor Skill 123, 792–809. doi: 10.1177/0031512516667455 Sgrò, F., Aiello, F., Casella, A., and Lipoma, M. (2017). The effects of matchplaying aspects and situational variables on achieving score-box possessions in Euro 2012 Football Championship. J. Hum. Sport Exerc. 12, 58–72. doi: 10.14198/jhse.2017.121.05 Tenga, A., Holme, I., Ronglan, L. T., and Bahr, R. (2010a). Effect of playing tactics on achieving score-box possessions in a random series of team possessions from Norwegian professional soccer matches. J. Sports Sci. 28, 245–255. doi: 10.1080/02640410903502766 Tenga, A., Holme, I., Ronglan, L. T., and Bahr, R. (2010b). Effect of playing tactics on goal scoring in Norwegian professional soccer. J. Sports Sci. 28, 237–244. doi: 10.1080/02640410903502774 Tenga, A., Kanstad, D., Ronglan, L. T., and Bahr, R. (2009). Developing a new method for team match performance analysis in professional soccer and testing its reliability. Int. J. Perform. Anal. Sport 9, 8–25. doi: 10.1080/24748668.2009. 11868461 Tenga, A., Ronglan, L. T., and Bahr, R. (2010c). Measuring the effectiveness of offensive match-play in professional soccer. Eur. J. Sport Sci. 10, 269–277. doi: 10.1080/17461390903515170. Frontiers in Psychology | www.frontiersin.org. Vogelbein, M., Nopp, S., and Hökelmann, A. (2014). Defensive transition in soccer–are prompt possession regains a measure of success? A quantitative analysis of German Fußball-Bundesliga 2010/2011. J. Sports Sci. 32, 1076–1083. doi: 10.1080/02640414.2013.879671 Wallace, J. L., and Norton, K. I. (2014). Evolution of World Cup soccer final games 1966-2010: Game structure, speed and play patterns. J. Sci. Med. Sport 17, 223–228. doi: 10.1016/j.jsams.2013.03.016 Winter, C., and Pfeiffer, M. (2015). Tactical metrics that discriminate winning, drawing and losing teams in UEFA Euro 2012 R . J. Sports Sci. 34, 486–492. doi: 10.1080/02640414.2015.1099714 Yiannakos, A., and Armatas, V. (2006). Evaluation of the goal socring patterns in European Championship in Portugal 2004. Int. J. Perform. Anal. Sport. 6, 178–188. doi: 10.1080/24748668.2006.1186 8366 Zurloni, V., Cavalera, C., Diana, B., Elia, M., and Jonsson, G. (2014). Detecting regularities in soccer dynamics: a T-pattern approach. Rev. Psicol. Dep. 23, 157–164. Conflict of Interest Statement: The authors declare that the research was conducted in the absence of any commercial or financial relationships that could be construed as a potential conflict of interest. Copyright © 2019 Maneiro, Casal, Álvarez, Moral, López, Ardá and Losada. This is an open-access article distributed under the terms of the Creative Commons Attribution License (CC BY). The use, distribution or reproduction in other forums is permitted, provided the original author(s) and the copyright owner(s) are credited and that the original publication in this journal is cited, in accordance with accepted academic practice. No use, distribution or reproduction is permitted which does not comply with these terms.. 10. June 2019 | Volume 10 | Article 1230.
(11)
Figure

Documento similar
Recent observations of the bulge display a gradient of the mean metallicity and of [Ƚ/Fe] with distance from galactic plane.. Bulge regions away from the plane are less
In the previous sections we have shown how astronomical alignments and solar hierophanies – with a common interest in the solstices − were substantiated in the
The specific objectives of the present study are: (1) to examine whether there are differences in perceived joint pain between weather-sensitive and non-weather- sensitive people
(hundreds of kHz). Resolution problems are directly related to the resulting accuracy of the computation, as it was seen in [18], so 32-bit floating point may not be appropriate
Even though the 1920s offered new employment opportunities in industries previously closed to women, often the women who took these jobs found themselves exploited.. No matter
Government policy varies between nations and this guidance sets out the need for balanced decision-making about ways of working, and the ongoing safety considerations
The expansionary monetary policy measures have had a negative impact on net interest margins both via the reduction in interest rates and –less powerfully- the flattening of the
Jointly estimate this entry game with several outcome equations (fees/rates, credit limits) for bank accounts, credit cards and lines of credit. Use simulation methods to
