A massive, distant proto cluster at z = 2 47 caught in a phase of rapid formation?
8
0
0
Texto completo
(2) Name. 2. DSFG J100036.03+022151.1... DSFG J100018.17+022250.4... DSFG J100016.57+022638.4... DSFG J100056.83+022013.3... DSFG J100026.73+022411.3... DSFG J100018.21+023456.7... DSFG J100027.14+023140.8.... S24 (μJy). S100 (mJy). S160 (mJy). ± ± ± ± ± ± ±. L L 6.7 ± 1.9 L L L 13.6 ± 1.8. L L 19.2 ± 3.6 L L L 24.4 ± 3.6. 194 128 890 90 84 153 421. 17 16 17 27 14 11 152. S250 (mJy) 11.3 ± 11.3 ± 24.5 ± L 11.4 ± 16.6 ± 36.9 ±. 2.2 2.2 2.2 2.2 2.0 2.2. S350 (mJy) 15.6 ± 2.7 L 21.5 ± 2.7 9.1 ± 12.9 14.8 ± 2.7 19.5 ± 3.4 30.8 ± 2.8. S450 (mJy) 11.3 3.9 17.3 18.3 10.3 12.0 3.9. ± ± ± ± ± ± ±. 4.9 4.1 4.7 6.0 5.0 8.8 5.0. S500 (mJy) 14.5 ± L 11.6 ± L 17.8 ± 11.2 ± 17.0 ±. 3.1 3.0 3.0 4.2 3.4. S850 (mJy). S1.4 GHz (μJy). L IR (L ). ± ± ± ± ± ± ±. L L 5716 ± 73 L L 46 ± 10 67 ± 12. 12 +1.39 (3.120.96 ) × 10 12 +2.35 (3.84) × 10 1.46 12 +2.21 (7.521.71 ) × 10 +0.93 (2.06-0.64 ) × 1012 12 +1.85 (2.991.16 ) × 10 12 +4.51 (4.23-2.18) × 10 13 +0.19 (1.150.16 ) × 10. 4.6 3.3 3.7 10.9 0.4 2.57 5.8. 1.1 1.0 1.0 1.1 0.8 1.74 1.4. The Astrophysical Journal Letters, 808:L33 (8pp), 2015 August 1. Table 1 Deboosted FIR-photometric Data For PCL1002ʼs Dusty Starbursts. Casey et al..
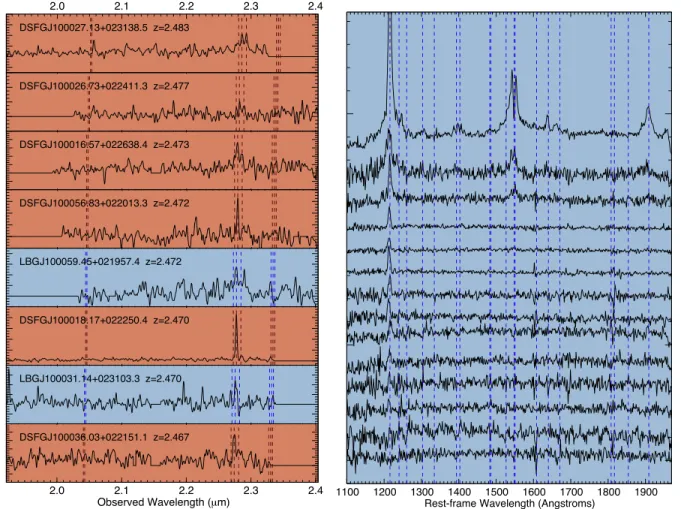
(3) The Astrophysical Journal Letters, 808:L33 (8pp), 2015 August 1. Casey et al.. Figure 1. Left: extracted one-dimensional K-band MOSFIRE spectra for proto-cluster members. Right: example spectra of PCL1002 member galaxies in the restframe ultraviolet from VLT VIMOS (Lilly et al. 2009).. (d DSFG 100 ). With only 0.5 DSFGs expected in the given volume, this overdensity only has a 0.0001% chance of occurring by chance, implying that PCL1002 is unlikely to be an artifact of incompleteness or survey bias. A similar peak is seen in the redshift distribution of zCOSMOS Lyman-Break Galaxies (LBGs) with a maximum dg = 3.3. Although less pronounced than the DSFG overdensity, the overdensity of LBGs is also spatially clustered on the sky in a filamentary structure. We use a friendsof-friends (Huchra & Geller 1982) algorithm to formally determine which LBGs are in fact members of the DSFG overdensity by selecting sources that are within 2 Mpc proper (projected on the sky and line-of-sight distance) of the DSFGs or their immediate neighbors, or within 3 Mpc of the DSFGs. This is similar to low-z cluster member identification techniques, but with longer “linking length” accomodating high-z non-virialized structures (Chiang et al. 2013). Table 2 lists PCL1002 members. PCL1002 sweeps out an effective area of 200 arcmin2 (distributed over an area extended 25′ × 25′) and 28 Mpc comoving along the line of sight, and a volume of ∼15,000 Mpc3 comoving (or 400 Mpc3 proper). The range of redshifts Dz = 0.0239 translates to a total end-to-end line-ofsight velocity range of Dv = 2080 km s−1. Figure 2 maps the structure. Note that another possibly related overdense structure (Chiang et al. 2014, 2015; Diener et al. 2015) at z = 2.44–2.45 sits nearby (at distances of ∼50–100 Mpc).. We calculate the significance of this overdensity using methods used for other z 2 structures (Steidel et al. 1998; Chapman et al. 2009) by computing the likelihood of observing seven DSFGs within a Δz = 0.02 interval with the Erlang distribution function (Eadie et al. 1971), p (Dz Nl) = l (lDz) N - 2 exp(-lDz) (N - 2)!. (1). where p (Dz ∣ Nl ) is the probability that N galaxies spanning a redshift range Dz is drawn by chance. The expectation for the density of galaxies per unit redshift interval is described by λ and the calculation of the probability assumes no clustering as the null hypothesis. Assuming a volume density of 7 × 10⁻⁵ Mpc−3 for >1012.3 L DSFGs at z » 2.5 (taken from the best to-date luminosity functions of DSFGs; Casey et al. 2014), we infer that the number of DSFGs expected in a redshift slice of Δz = 0.02 within a 150 arcmin2 box is λ = 0.64 (in a volume ∼10,000 Mpc3). This implies the probability of observing seven DSFGs in this interval is 0.002%. This corresponds to a DSFG overdensity of d DSFG = (7-0.64) 0.64 = 11. For comparison, the most analogous structures in the literature are in HDF at z = 1.99 (Blain et al. 2004, which has d DSFG = (9-0.84) 0.84 = 10), and the SSA22 proto-cluster at z = 3.09 with ≈5–6 DSFGs. MRC1138–256 at z = 2.16 (Dannerbauer et al. 2014) contains ∼5 DSFGs, within a potentially much more compact volume 3.
(4) The Astrophysical Journal Letters, 808:L33 (8pp), 2015 August 1. Casey et al.. Table 2 Physical Characteristics of PCL1002 Members Name LBG J100013.62+022604.9 LBG J100033.33+022159.9 LBG J100036.90+022213.8 LBG J100038.35+022216.4 DSFG J100036.03+022151.1 LBG J100018.18+022837.7 LBG J100024.36+022236.3 LBG J100050.73+021922.4 LBG J100031.14+023103.3 LBG J100051.16+022305.1 LBG J100058.80+022032.4 LBG J100111.03+022043.4 LBG J100100.91+021927.3 LBG J095956.93+022118.5 LBG J100059.45+021957.4 LBG J100100.91+021728.1 DSFG J100018.17+022250.4 LBG J100014.24+022516.7 LBG J100115.18+022349.7 DSFG J100016.57+022638.4 DSFG J100056.83+022013.3 LBG J095940.95+022522.1 LBG J100018.04+021808.6 LBG J100020.50+022421.5 LBG J100109.29+022221.5 LBG J100015.38+022448.3 LBG J100033.20+022225.0 LBG J100008.88+023044.1 LBG J100012.37+023707.6 LBG J100015.87+021939.5 LBG J100025.28+022643.3 LBG J100116.15+021854.2 LBG J100002.03+023012.9 LBG J100054.07+022104.4 DSFG J100026.73+022411.3 LBG J100024.21+022741.3 DSFG J100018.21+023456.7 QSO J100021.96+022356.7 DSFG J100027.14+023140.8 LBG J100004.33+022654.1 LBG J100033.91+022713.2 LBG J100023.31+023537.5. z. Type. 2.463 2.463 2.463 2.463 2.465 2.466 2.466 2.466 2.467 2.467 2.467 2.467 2.469 2.470 2.470 2.470 2.470 2.471 2.471 2.472 2.472 2.472 2.472 2.472 2.473 2.474 2.474 2.475 2.475 2.475 2.475 2.475 2.477 2.478 2.478 2.479 2.479 2.480 2.483 2.480 2.481 2.487. UV UV Lyα/UV UV Hα UV UV UV Hα/Lyα Lyα UV UV UV UV Hα/Lyα Lyα Hα UV Lyα/UV Hα Hα UV UV UV Lyα/UV Lyα/[C IV] Lyα/UV UV UV UV UV UV Lyα/UV Lyα/[C IV] Hα UV CO(1–0) Lyα Hα UV UV UV. L UV (L ). SFR (M yr−1). M (M ). Morph Class. AGN Indicator. 10 +0.66 (4.260.57 ) × 10 +0.69 (4.36-0.60 ) × 1010 10 +0.07 (2.240.07 ) × 10 10 +0.78 (5.86-0.69 ) × 10 <3.0 × 10¹⁰ 10 +0.69 (4.280.59 ) × 10 +0.70 (4.88-0.61 ) × 1010 10 +0.81 (6.610.72 ) × 10 +0.66 (2.61-0.59 ) × 1010 10 +0.63 (2.860.51 ) × 10 +0.74 (4.90-0.64 ) × 1010 10 +0.77 (5.690.68 ) × 10 10 +0.75 (5.07-0.65 ) × 10 10 +0.65 (2.480.51 ) × 10 +0.72 (3.75-0.60 ) × 1010 10 +0.84 (7.180.75 ) × 10 +0.09 (1.01-0.08 ) × 1011 10 +0.65 (3.240.54 ) × 10 10 +0.70 (3.48) × 10 0.59 9 +5.45 ) × 10 (8.823.37 10 +0.69 (3.71-0.58 ) × 10 10 +0.74 (4.280.63 ) × 10 +0.72 (4.58-0.62 ) × 1010 10 +0.33 (4.370.31 ) × 10 10 +0.65 (3.73) × 10 0.56 10 +0.70 (4.93) × 10 0.62 +0.60 (2.48-0.48 ) × 1010 10 +0.72 (4.450.62 ) × 10 10 +0.67 (3.05-0.55 ) × 10 10 +0.70 (3.310.58 ) × 10 10 +0.69 (4.58) × 10 0.60 10 +0.65 (3.860.56 ) × 10 +0.75 (5.46-0.66 ) × 1010 10 +0.74 (4.370.63 ) × 10 +6.21 (7.55-3.41) × 109 10 +0.77 (5.470.67 ) × 10 <3.0 × 10¹⁰ 11 +0.14 (2.620.13 ) × 10 10 +0.71 (6.04-0.59 ) × 10 10 +0.76 (6.220.68 ) × 10 +0.64 (2.17-0.50 ) × 1010 10 +0.86 (3.690.70 ) × 10. +0.55 6.671.41 +0.6 49.521.1 +0.20 3.171.02 +29.1 25.93.5 +132 296-91 +3.4 12.72.7 +4.8 25.59.8 +7.6 98.217.4 +1.96 8.211.96 +0.9 17.87.3 +1.2 63.18.2 +21.0 45.017.0 +2.4 32.37.9 +0.5 15.77.8 +1.7 16.94.2 +0.1 30.74.7 +223 365138 +1.8 46.75.3 +1.0 17.86.7 +210 714162 +88 19661 +15.5 21.52.4 +8.5 71.717.1 +14.3 33.1-7.5 +10.1 52.627.8 +5.0 11.81.9 +15.6 63.28.9 +5.0 16.21.8 +16 131-32 +12.2 79.421.2 +1.8 45.28.1 +1.3 23.312.5 +1.9 23.314.0 +2.8 22.94.5 +179 284110 +0.2 18.02.8 +165 400117 L +180 1090160 +3.6 37.9-8.3 +0.5 27.33.6 +0.3 27.911.8. 10 +0.06 (1.140.21 ) × 10 +0.52 (4.65-0.87 ) × 1010 8 +0.90 (5.740.90 ) × 10 9 +1.01 (7.92-2.09 ) × 10 11 +0.06 (1.010.18 ) × 10 +0.30 (2.37-0.43 ) × 109 9 +0.08 (8.790.09 ) × 10 10 +0.06 (1.44) × 10 0.28 10 +0.20 (3.220.31 ) × 10 +0.15 (2.01-1.03 ) × 109 9 +0.57 (5.941.31 ) × 10 10 +0.03 (1.65-0.43 ) × 10 9 +0.14 (3.461.19 ) × 10 9 +0.01 (1.77) × 10 0.62 10 +0.02 (2.660.64 ) × 10 +0.11 (2.84-0.51) × 109 10 +0.15 (1.910.41 ) × 10 +0.05 (1.13-0.20 ) × 1010 10 +1.05 (5.547.27 ) × 10 11 +0.02 (1.09) × 10 0.34 10 +0.76 (8.13-0.74 ) × 10 9 +0.83 (4.952.21 ) × 10 +0.67 (7.44-1.61 ) × 109 10 +0.21 (1.940.56 ) × 10 10 +0.02 (1.04) × 10 0.26 10 +0.01 (1.32) × 10 0.37 10 +0.04 (1.520.34 ) × 10 +0.19 (1.93-0.35 ) × 1010 10 +0.01 (2.160.32 ) × 10 +0.19 (3.15-0.80 ) × 1010 10 +0.10 (2.010.78 ) × 10 9 +1.75 (4.99) × 10 1.23 +0.53 (4.38-0.70 ) × 109 10 +0.07 (2.000.49 ) × 10 10 +0.01 (1.64-0.45) × 10 10 +0.04 (1.040.11 ) × 10 11 +0.02 (2.13) × 10 0.56 10 +0.21 (6.59-0.86 ) × 10 10 +0.33 (4.100.92 ) × 10 +0.24 (4.03-0.66 ) × 109 9 +0.14 (2.570.25 ) × 10 9 +0.78 (3.96) × 10 0.83. Disk/Int Sph Sph Sph/Int Disk/Int Sph/Int Sph/Int L Sph L L L L L L L Merg Sph/Int L Disk L L Sph/Int Sph L Sph Sph L L Disk/Int Merg L L L Disk Sph L QSO/Sph Sph L L L. L L L L X-ray L L L L L L L L L Opt/X-ray L L L Radio Radio L L L L L UV L L L L L L L UV/X-ray Opt L L UV/X-ray Opt L L L. Notes. Source names indicate the selection method: submillimeter selection by DSFG, optical by LBG, and one unequivocal quasar by QSO. L UV is the rest-frame ultraviolet luminosity computed from an extrapolated apparent magnitude at rest-frame 1600 Å. Morph Class refers to the CANDELS visual classification scheme applied to HST H-band imaging. “Sph” refers to spheroids, “Disk” refers to disk-like galaxies, “QSO” refers to an unresolved point source, “Merg” refers to a galaxy merger, and “Int” refers to some signature of galaxy interactions taking place.. This structure also hosts an overdensity of luminous active galactic nuclei (AGNs), an important signature of accreting supermassive black holes. Four galaxies (9.5%) are luminous X-ray sources in this structure (at L X > 10 43.7 erg s−1; Civano et al. 2012), a factor of 21 higher than the expected volume density of AGNs of similarly high luminosities (Silverman et al. 2008). Even among the seven DSFGs, four exhibit unequivocal AGN characteristics in either the X-ray, radio, optical, or ultraviolet (57%): a fraction nearly twice as high as. expected from previous work on AGNs in non-clustered DSFGs (Alexander et al. 2005). The depth of the ChandraCOSMOS observations is only sufficient to detect the most X-ray luminous AGNs, so we stack the undetected population to search for possible low-luminosity AGNs, but found no X-ray emission. One of the seven DSFGs and one member LBG host radio-loud AGNs (Schinnerer et al. 2007). DSFG J100016.57+022638.4 has a radio luminosity of L178 MHz = 1.9 ´ 10 27 W Hz−1, nearly 4.
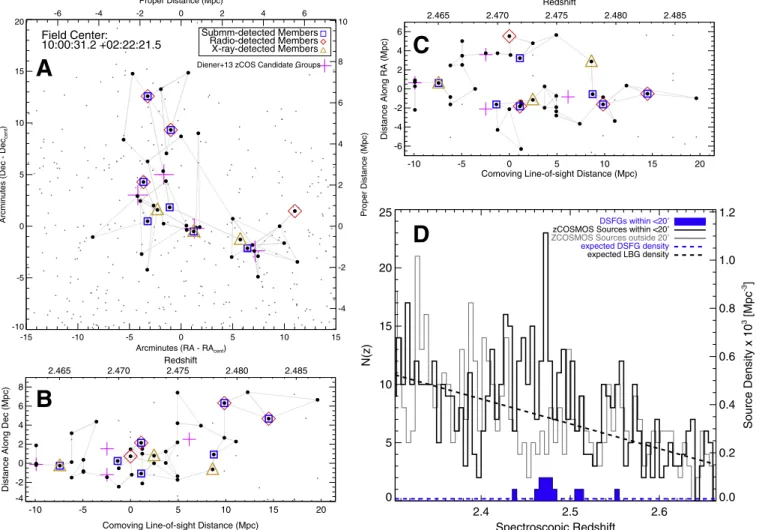
(5) The Astrophysical Journal Letters, 808:L33 (8pp), 2015 August 1. Casey et al.. Figure 2. Three spatial projections of the z = 2.47 PCL1002 proto-cluster: on the sky (panel A), and two projections with redshift on the x-axis and either decl. (panel B) or R.A. (panel C) on the y-axis. Thick black points are confirmed PCL1002 members, and small gray points are spectroscopically confirmed galaxies in 2.30 < z < 2.66 . Thin gray lines connect the two nearest neighbors. DSFGs have blue boxes, radio-detected galaxies have red diamonds, and X-ray-detected galaxies have yellow triangles. Peculiar velocities are not constrained. Four candidate group positions are marked with large magenta crosses (Diener et al. 2013). Panel D shows the distribution of spectroscopic redshifts for galaxies in within 20′ of PCL1002’s center. The overdensity of DSFGs (blue) is a factor of 10 above what is expected (dashed blue line) given the known volume density of DSFGs in the field at these redshifts. The observed number of LBGs (dashed black line) is a factor of 3.3 above expectation at z = 2.47.. analogous to a local Fanaroff–Riley class II AGN (Fanaroff & Riley 1974). It has the potential to become the brightest cluster galaxy (BCG) when the structure matures to z ~ 0 , consistent with other high-z overdensities that host single radio-loud quasars (Venemans et al. 2007). Beyond X-ray and radio signatures of AGNs, we find that three DSFGs and one LBG either have very broad Hα lines or high [N II]/ Hα ratios consistent with AGNs. In summary, this structure hosts 6 luminous AGNs, 9 galaxies with strong signatures of AGNs, and 7 submillimeter-luminous DSFGs for a total of 12 exceptionally rare galaxies.. 2.30 < z < 2.66, we remove sources within 20 Mpc of PCL1002 (a factor of two in comoving distance beyond the boundary of the structure itself) and any sources with more than two neighbors within 5 Mpc. The resulting sample consists of 401 galaxies; the vast majority of these are selected via optical-color and appear to only differ with the PCL1002 LBGs by environment.. 3.2. Stellar Masses and SFRs We use the MAGPHYS spectral energy distribution (SED) code (da Cunha et al. 2008) to constrain the UV through farinfrared SED empirically using energy balance techniques. We use a stellar synthesis template library as input, and attenuation is determined from a mix of hot/cool/polycyclic aromatic hydrocarbon dust grains. Our interest in using MAGPHYS is threefold: to measure SFRs for galaxies not directly detected in the far-infrared, to estimate stellar masses for all galaxies (comparing stellar mass estimates of DSFGs with other techniques), and to compare physical properties of PCL1002 members with field galaxies. One galaxy, QSO J100021.96+022356.7, lacks an SFR estimate due to lack. 3. RESULTS 3.1. Control Galaxies Outside of PCL1002 To draw comparisons between PCL1002’s member galaxies and field galaxies, we define a set of spectroscopically confirmed galaxies that lack close physical associations. The redshift range of the control sample is restricted to ±200 Myr of the observed structure (2.30 < z < 2.66) to prevent confusion between redshift evolution and environmentally driven differences. Of the 1072 zCOSMOS sources that satisfy 5.
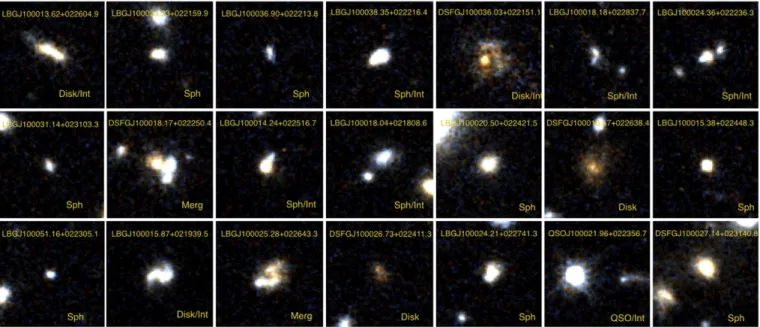
(6) The Astrophysical Journal Letters, 808:L33 (8pp), 2015 August 1. Casey et al.. Figure 3. 4 ´ 4 rest-frame optical cutouts for PCL1002 members from HST-WFC3. Galaxy names are indicated along with morphological and interaction indicators (see Table 2).. At 850 μm, we measure a flux density of S850 = 0.25 0.16 mJy for PCL1002 LBGs, and 0.11 ± 0.13 mJy for control LBGs. In other words, LBGs in PCL1002 are brighter at 850 μm by a factor of 2.3 ± 3.0 (although consistent with equal flux density, the likelihood of greater 850 μm in PCL1002 is 76%). At 450 μm, we measure a flux density of S450 = 0.41 0.85 mJy for LBGs in PCL1002, and 1.66 ± 0.69 mJy for control LBGs. Although the low signal-to-noise is due to the small number of coadded sources, these measurements together are suggestive that the mass of cold dust and interstellar medium (ISM) is potentially higher for galaxies in the dense structure, despite their comparable SFRs. Since galaxies’ ISM masses scale directly to their gas masses (with a roughly constant dust-to-gas ratio; Scoville et al. 2014), we deduce that the molecular gas reservoirs of the structure’s galaxies are probably deeper, thus their potential for heightened star formation relative to similar galaxies living outside of it. Follow-up molecular gas measurements are needed to confirm this intriguing lead.. of far-infrared detection or disambiguation of quasar-dominated optical SED from stellar emission. SFRs for DSFGs are measured by fitting simple modified blackbodies (plus mid-infrared powerlaws, β = 1.8, α = 2.0; Casey 2012) to all available far-infrared/submillimeter photometry (Spitzer, Herschel, SCUBA-2). We integrate under the SED from 8–1000 μm to get the total infrared luminosity, L IR and convert to a star formation rate using SFR/M yr−1= 9.5 × 10⁻¹¹ L IR /L (Kennicutt 1998) adjusted for a Chabrier initial mass function (Chabrier 2003). LBGs in PCL1002 are more massive in stars than control LBGs by a factor of 1.5 ± 0.3. Given the uncertain star formation histories of DSFGs, we check that the MAGPHYSgenerated stellar mass estimates are not systematically biased by computing a rest-frame H-band magnitude for each DSFG, removing any mid-infrared dusty power law (on average, ∼50% contribution), and converting to stellar mass using a +0.6 range of appropriate mass-to-light ratios (L H M = 7.92.1 L /mag; Hainline et al. 2011). Two DSFGs lack stellar mass estimates; DSFG J100016.57+022638.4 is dominated by a midinfrared power law (with no constraint on the underlying stellar emission) and DSFG J100027.14+023140.8 is blended in the near-infrared with several nearby sources. For the remainder, we find consistency between the MAGPHYS-derived stellar masses and the H-band derived stellar masses.. 3.4. Rest-frame Optical Morphologies With Hubble Space Telescope (HST) H-band imaging available for 21/42 PCL1002 members (and 25/401 control galaxies), we investigate morphology and interaction state of rest-frame optical emission using the CANDELS (Koekemoer et al. 2011) visual classification scheme (Kartaltepe et al. 2012; Kocevski et al. 2012). The scheme classifies galaxies into a morphology class (disk, spheroid, irregular, or unclassifiable) and an interaction class (merger, interacting pair, or noninteracting). Full details of both morphology and interaction class for member galaxies are given Table 2 and Figure 3. Before visual classification was carried out, galaxy cutouts for cluster members and control were scrambled to ensure unbiased results. Although limited by small numbers, we find that 10 of 21 proto-cluster member galaxies (48% ± 10%) appear to be irregular or undergoing interaction while only 5 of 25 control galaxies exhibit interaction (20% ± 8%). Even with. 3.3. Submillimeter Stacking To investigate low-level submillimeter emission in the protocluster’s LBGs, we stack our 450 and 850 μm submillimeter maps at the positions of known galaxies, both in PCL1002 and in the control sample. Stacking analysis in the submillimeter requires the removal of bright, significantly detected point sources (Webb et al. 2003) so that real DSFGs do not bias the measurement. Thirty-one of 35 LBG members fall within the sensitive area of the submillimeter maps (71 of 401 control sample LBGs). Flux densities are measured by inversevariance weighting (Viero et al. 2013; Coppin et al. 2015). 6.
(7) The Astrophysical Journal Letters, 808:L33 (8pp), 2015 August 1. Casey et al.. removal of the DSFGs, a high interaction fraction (7/ 16 = 44%), is found for the proto-cluster members.. lived than expected by existing observations of similar phenomena in the field. The evidence we present here is suggestive of the former, that DSFGs and AGNs are short-lived, and in that case, their triggering must be environmentally driven. This is supported by the increased interaction fraction seen in proto-cluster members’ optical morphologies, larger ISM masses in protocluster members (albeit a marginal distinction requiring confirmation), and the lack of physical motivation for long QSO lifetimes (Martini 2004; Hopkins & Hernquist 2009) beyond the increased gas-feeding argument often argued for DSFGs. If correct, these observations provide the first concrete evidence that environmental triggering can occur over extraordinarily large volumes (15,000 Mpc3) at z > 2. It should be noted that the structure’s member LBGs do not appear to have sufficiently different observational characteristics than LBGs in the field. Comparison against the control sample indicates that proto-cluster LBGs have slightly higher stellar masses (by a factor of 1.5 ± 0.3) and similar SFRs. Nevertheless, as a sheer consequence of their number, LBGs dominate the calculation of the structure’s net dark matter halo mass which is estimated to be significant at >8 × 10¹³ M. This is predicted to mature to a few ×1015 M at z ~ 0 . Cosmological dark matter simulations suggest that today’s most massive clusters occupied volumes several hundred times larger (Oñorbe et al. 2014) at z ~ 2.5, having not yet virialized into the compact structures we see today. PCL1002 affirms these predictions, as its 15,000 Mpc3 volume is predicted to collapse to a volume of ≈ 50 Mpc3 at z ~ 0 , which is consistent with all nearby >5 ´ 1014 M clusters. While this confirms the notion of a genuine massive cluster in formation, this volume-scaling also implies that most clusters will have similarly large sizes at z > 2.5, subtending areas half a degree across on the sky. Observationally isolating massive clusters in formation then comes down to accurate redshift identification to within Δz = 0.03, because other observational characteristics are not sufficiently environmentally distinct at these epochs. Identifying and correctly classifying PCL1002 as a massive galaxy cluster progenitor would not have been possible without the concentrated presence of cosmologically rare phenomena like dusty starbursts and luminous AGNs. Future large and deep 100 deg2 submillimeter surveys could play a crucial part in statistically characterizing the population of such large structures during their formation epoch, as groups of DSFGs and luminous AGNs can act as signposts to the largest mass concentrations. Equally important is complete spectroscopic follow-up at z > 2 over those wide-areas, like large optical campaigns similar to HETDEX (Chiang et al. 2014) and potential future large millimeter line searches targeting CO or [C II] with a wide-bandwidth spectrometer. The discovery of more high-z, starbursting overdensities will be inevitable, but it will be the constraints on their volume density and assembly timescale that will have significant repercussions on cosmological hydrodynamic simulations and the formation mechanisms of the Coma-like superclusters we see today.. 3.5. Estimating Halo Mass To estimate the net dark matter halo mass of this structure, we use abundance matching techniques from large-volume simulations (Behroozi et al. 2013). Due to PCL1002ʼs filamentary structure, we estimate the total halo mass by summing the estimated halo masses for each galaxy in the structure using its stellar mass. We estimate a lower limit of Mhalo > (8 ± 3) × 1013 M at z = 2.47. Using a model for mass-dependent exponential growth, we estimate the z = 0 halo mass to be (2 ± 1) × 1015 M (Wechsler et al. 2002; Chiang et al. 2013), about twice as large as the Coma Supercluster (which has a mass of ∼1 × 10¹⁵M). Note that this dark matter halo mass estimation method differs from others that assume linear bias and spherical collapse models (Mo & White 1996; Peacock 1999), which we suggest are not applicable to z 2 filamentary structures. Some works (Chapman et al. 2009; Miller et al. 2015) suggest that significant overdensities in DSFGs do not trace massive proto-clusters. They argue that such significant overdensities are due to “merger bias” whereby the submillimeterluminous phase is too short-lived and rare to be a useful probe of the most massive halos at high-z. Indeed, there are several massive proto-clusters at z > 2 that contain no DSFGs, and some structures of only moderate mass that appear to contain a few DSFGs (Capak et al. 2011; Hodge et al. 2012; Walter et al. 2012). The Miller et al. (2015) work argues that DSFG overdensities are poor tracers of the most massive overdensities at high-redshift because Poisson noise dominates for low numbers of DSFGs. While this is likely the case for 1–3 DSFGs, our results (and our interpretation of their Figure 3) imply that the opposite is actually true for sufficiently large numbers of DSFGs per proto-cluster. Instead we suggest that spectroscopic incompleteness in both LBG and submillimeter samples around high-z proto-clusters has potentially hindered the discovery of more starburst-enriched and AGN-enriched proto-clusters. If this is the case, aggressive spectroscopic follow-up of DSFGs might substantially help the effort to identify high-z proto-cluster environments, where the spectroscopic investment needed for LBG samples is prohibitive on large scales (i.e., identification of >40 spectroscopically identified LBGs, with a resulting d LBG » 3-5). With the identification of four 20–30 arcmin-scale overdensities containing ⩾6 DSFGs (HDF, MRC1138, PCL1002, and SSA22) in only a few degrees of deep submillimeter surveys, the potential to identify further massive cluster progenitors via their member DSFGs and AGNs is quite promising. 4. DISCUSSION AND CONCLUSIONS The overabundance of what are thought to be short-duration, ∼100 Myr, phenomena (both DSFGs and luminous AGNs; Marconi et al. 2004; Bothwell et al. 2013) in an extended proto-cluster structure is conspicuously rare. Even scaling density estimates proportional to the LBG overenhancement, the DSFG/AGN presence is excessive. The extra DSFG/AGN can be explained with only two possible physical interpretations: either the DSFGs and AGNs are short-lived and are triggered simultaneously via a process related to the overdense environment or the DSFGs and AGNs must be much longer. We thank the anonymous referee for constructive comments which have improved the manuscript. Some of the data presented herein were obtained at the W. M. Keck Observatory, which is operated as a scientific partnership among the California Institute of Technology, the University of California, 7.
(8) The Astrophysical Journal Letters, 808:L33 (8pp), 2015 August 1. Casey et al.. and the National Aeronautics and Space Administration and made possible by financial support of the W. M. Keck Foundation. We also thank the Joint Astornomy Centre (run by STFC, NSERC, and NOSR) for operation of the JCMT and SCUBA-2 instrument. Mahalo nui loa to the kama’aina of Hawai’i for use of the cultural site of Maunakea for astronomical observing. Based in part on NASA/ESA HST data, operated by STScI of AURA Inc, under NASA contract NAS 5-26555. Other observations obtained from the European Southern Observatory, Chile. C.M.C. acknowledges generous support of a McCue Fellowship from the UC Irvine Center for Cosmology. A.C. and C.M.C. acknowledge support from NSF AST-1313319, NSF CAREER 0645427, and NASA Herschel Science Center.. Dannerbauer, H., Kurk, J. D., De Breuck, C., et al. 2014, A&A, 570, A55 Diener, C., Lilly, S. J., Knobel, C., et al. 2013, ApJ, 765, 109 Diener, C., Lilly, S. J., Ledoux, C., et al. 2015, ApJ, 802, 31 Eadie, W. T., Drijard, D., & James, F. E. 1971, Statistical Methods in Experimental Physics (Amsterdam: North-Holland) Elbaz, D., Daddi, E., Le Borgne, D., et al. 2007, A&A, 468, 33 Fanaroff, B. L., & Riley, J. M. 1974, MNRAS, 167, 31P Hainline, L. J., Blain, A. W., Smail, I., et al. 2011, ApJ, 740, 96 Hodge, J. A., Carilli, C. L., Walter, F., et al. 2012, ApJ, 760, 11 Hopkins, P. F., & Hernquist, L. 2009, ApJ, 698, 1550 Huchra, J. P., & Geller, M. J. 1982, ApJ, 257, 423 Ilbert, O., McCracken, H. J., Le Fèvre, O., et al. 2013, A&A, 556, A55 Kartaltepe, J. S., Dickinson, M., Alexander, D. M., et al. 2012, ApJ, 757, 23 Kennicutt, R. C., Jr. 1998, ARA&A, 36, 189 Kocevski, D. D., Faber, S. M., Mozena, M., et al. 2012, ApJ, 744, 148 Koekemoer, A. M., Faber, S. M., Ferguson, H. C., et al. 2011, ApJS, 197, 36 Lee, N., Sanders, D. B., Casey, C. M., et al. 2013, ApJ, 778, 131 Lentati, L., Wagg, J., Carilli, C. L., et al. 2015, ApJ, 800, 67 Lilly, S. J., Le Brun, V., Maier, C., et al. 2009, ApJS, 184, 218 Marconi, A., Risaliti, G., Gilli, R., et al. 2004, MNRAS, 351, 169 Martini, P. 2004, in Coevolution of Black Holes and Galaxies, ed. L. C. Ho (Cambridge: Cambridge Univ. Press), 169 Miller, T. B., Hayward, C. C., Chapman, S. C., & Behroozi, P. S. 2015, MNRAS, submitted (arXiv:1501.04105) Mo, H. J., & White, S. D. M. 1996, MNRAS, 282, 347 Moster, B., Naab, T., & White, S. D. M. 2013, MNRAS, 428, 312 Oñorbe, J., Garrison-Kimmel, S., Maller, A. H., et al. 2014, MNRAS, 437, 1894 Peacock, J. A. 1999, RSPTA, 357, 133 Schinnerer, E., Smolčić, V., Carilli, C. L., et al. 2007, ApJS, 172, 46 Scoville, N., Aussel, H., Sheth, K., et al. 2014, ApJ, 783, 84 Silverman, J. D., Green, P. J., Barkhouse, W. A., et al. 2008, ApJ, 679, 118 Steidel, C. C., Adelberger, K. L., Dickinson, M., et al. 1998, ApJ, 492, 428 Venemans, B. P., Röttgering, H. J. A., & Miley, G. K. 2007, A&A, 461, 823 Viero, M. P., Wang, L., Zemcov, M., et al. 2013, ApJ, 772, 77 Walter, F., Decarli, R., Carilli, C., et al. 2012, Natur, 486, 233 Webb, T. M., Eales, S., Foucaud, S., et al. 2003, ApJ, 582, 6 Wechsler, R. H., Bullock, J. S., Primack, J. R., Kravtsov, A. V., & Dekel, A. 2002, ApJ, 568, 52. REFERENCES Alexander, D. M., Bauer, F. E., Chapman, S. C., et al. 2005, ApJ, 632, 736 Behroozi, P. S., Wechsler, R. H., & Conroy, C. 2013, ApJ, 770, 57 Blain, A. W., Chapman, S. C., Smail, I., & Ivison, R. 2004, ApJ, 611, 725 Bothwell, M. S., Smail, I., Chapman, S. C., et al. 2013, MNRAS, 429, 3047 Capak, P. L., Riechers, D., Scoville, N. Z., et al. 2011, Natur, 470, 233 Casey, C. M. 2012, MNRAS, 425, 3094 Casey, C. M., Chen, C.-C., Cowie, L. L., et al. 2013, MNRAS, 436, 1919 Casey, C. M., Narayanan, D., & Cooray, A. 2014, PhR, 541, 45 Chabrier, G. 2003, PASP, 115, 763 Chapman, S. C., Blain, A., Ibata, R., et al. 2009, ApJ, 691, 560 Chiang, Y.-K., Overzier, R., & Gebhardt, K. 2013, ApJ, 779, 127 Chiang, Y.-K., Overzier, R., & Gebhardt, K. 2014, ApJ, 782, L3 Chiang, Y.-K., Overzier, R. A., Gebhardt, K., et al. 2015, ApJ, in press (arXiv:1505.03877) Civano, F., Elvis, M., Brusa, M., et al. 2012, ApJS, 201, 30 Cooper, M. C., Tremonti, C. A., Newman, J. A., & Zabludoff, A. I. 2008, MNRAS, 390, 245 Coppin, K. E. K., Geach, J. E., Almaini, O., et al. 2015, MNRAS, 446, 1293 da Cunha, E., Charlot, S., & Elbaz, D. 2008, MNRAS, 388, 1595. 8.
(9)
Figure
Documento similar