TítuloMolecular profile and cellular characterization of human bone marrow mesenchymal stem cells: donor influence on chondrogenesis
17
0
0
Texto completo
(2) For these reasons MSCs are a promising cell resource for tissue engineering and cell-based therapies (Pittenger, 2008). MSCs are currently defined by the combination of four minimal criteria proposed by the International Society for Cellular Therapy in 2006 (Dominici et al., 2006): adherence to plastic in standard culture conditions; absence of the hematopoietic markers, CD34 and CD45, and presence of CD105 (endoglin, SH2), CD73 (ecto-5′ nucleotidase, SH-3, SH-4), and CD90 (Thy-1) surface antigens; capability of multilineage differentiation, confirmed by staining of in vitro cultures. Bone marrow represents the most commonly used tissue source for the isolation of MSCs (Pittenger et al., 1999). Bone marrow MSCs (BM-MSCs) are well-characterized multipotent cells, which can differentiate into different cell types (osteocytes, adipocytes, tenocytes, and chondrocytes) (Bianco et al., 2001). MSCs present in isolated BM cells are approximately 1 cell per 5×10³ mononuclear cells (Kastrinaki et al., 2008). Therefore, it is necessary to expand BM-MSCs in vitro to obtain adequate cell numbers for clinical purposes. This expansion has the potential to induce alteration of stem cell characteristics, senescence or spontaneous transformation ( Rubio et al., 2005). To resolve this problem, the enrichment of MSCs and their stem cell properties through surface antigens used for positive or negative selection of cells has been proposed (Tondreau et al., 2004, Aslan et al., 2006, Kastrinaki et al., 2008 and Jarocha et al., 2008). The identification of the more immature fraction is based on the expression level of stem cell marker genes: Nanog (Mitsui et al., 2003), Oct3/4 (Nichols et al., 1998), and Sox2 (Avilion et al., 2003). All of these are transcriptional factors controlling the expression of a variety of genes related to the regulation of pluripotency and the self-renewal potential of stem cells (SCs). The down-regulation of these three transcription factors has been associated with the induction of cell differentiation. The use of the more immature cell fraction could allow the expansion of BM-MSCs in culture without affecting their multi-potentiality and differentiation capacity. This could be useful for cell therapy where clinical applications require differentiated cells, in particular for cartilage tissue engineering, where the use of differentiated chondrogenic progenitors has to be preferred on the use of undifferentiated stem cells. The process by which MSCs differentiate towards chondrocytes is called chondrogenesis (Goldring et al., 2006). There are a number of different protocols for inducing in vitro differentiation of BM-MSCs toward mature chondrocytes. To mimic mesenchymal condensation and cell–cell interactions, MSCs are cultured in high density aggregates (pellet culture) ( Johnstone et al., 1998 and DeLise et al., 2000). To induce chondrogenic differentiation, MSCs are cultured in a specific medium containing dexamethasone ( Derfoul et al., 2006) and transforming growth factor β (TGFβ) ( Spagnoli et al., 2007), one of the earliest signals in chondrogenic condensation ( Tuli et al., 2003). The differentiation protocols currently used lead to the expression of chondrocyte hypertrophy-associated genes ( Sekiya et al., 2002 and Pelttari et al., 2006). Because of this, it is imperative to develop well-defined and efficient methods for directing in vitro stem cell differentiation into the chondrogenic lineage. In recent years, many studies have focused on developing better culture conditions or better subpopulations of MSCs able to differentiate towards mature chondrocytes (Heng et al., 2004). Some studies have analyzed the use of antigen surface marker selection of MSCs. The starting point of these experiments was the enrichment of stem cell specific marker genes. However, this enrichment has not always led to better differentiation capacity of the selected cell populations. These studies have found little or no improvement in the differentiation capacity towards adipocytes, osteocytes, and chondrocytes (Kastrinaki et al., 2008) or the capability of the selected cells to differentiate towards these three lineages (Aslan et al., 2006 and Arufe et al., 2009), or a better osteogenic potential of the populations analyzed (Jarocha et al., 2008). The aim of this study was to evaluate the usefulness of surface antigen selection of different MSC populations and to elucidate the mechanisms underlying their differentiation. For this purpose, we characterized and compared two cell populations, selected (CD105+) and non-selected BM-MSCs (totalBM). We selected the surface antigen CD105 due to its wide expression in MSCs (Barry et al., 1999). We analyzed the multi-lineage differentiation potential of these two populations (adipocytes, osteocytes, and chondrocytes) with a focus on their chondrogenic differentiation capacity in both normoxic and hypoxic conditions..
(3) 2. Materials and methods 2.1. Isolation and culture of MSCs The bone marrow samples used to isolate mesenchymal stem cells (BM-MSCs) were obtained from six patients (mean age: 56 years; range: 40–72 years) undergoing total hip replacement due to osteoarthritis. The donors were not selected; the first six samples submitted were processed as they arrived at the laboratory unit. This study was approved by the institutional review board, and informed consent was obtained from all subjects in the study. Isolated bone marrow cells were cultured in monolayer in Dulbecco’s modified Eagles medium (DMEM), 20% fetal bovine serum (FBS), 1% penicillin and streptomycin (P/S) (all from Sigma-Aldrich, St. Louis, MO, USA) until 90% confluent. Pre-plating for 15 min in the first two passages eliminated any fibroblasts remaining in the culture (Richler and Yaffe, 1970). When the cells were 90% confluent, the CD105+ subpopulation was isolated by magnetic separation (MACS separator, Miltenyi Biotec, Madrid, SP) following the manufacturer’s instructions. Briefly, a portion of the adherent cells at the fourth culture passage was trypsinized, washed, resuspended in MACS buffer and incubated with anti-CD105 antibodies conjugated to magnetic microbeads. After incubation, the cells were passed through a magnetic column. The cells retained (CD105+) and the cells not passed through the column (total-BM) were cultured and expanded until the beginning of the differentiation experiments. 2.2. Phenotypic characterization using flow cytometry After culture expansion for a total of 7–9 passages, the cells were trypsinized, washed and analyzed by flow cytometry. Briefly, the human BM-derived cells were harvested by trypsinization, washed and centrifuged at 300g for 8 min. The cells were counted prior to flow cytometry and a total of 2×10⁵ were transferred to fluorescence-activated cell sorting (FACS) polypropylene tubes. The antibodies listed in Table 1 were used for these experiments. Optimal amounts of monoclonal antibodies (mAbs) were determined and added to each tube for 40 min at 4 °C in darkness. Most antibodies were conjugated with fluorescein isothiocyanate (FITC) or phycoerithrin (PE) and were specific for markers associated with mesenchymal and hematopoietic lineages. When necessary, cells were incubated for 30 min at 4 °C in darkness with a secondary FITC-conjugated antibody to allow binding to the primary antibody. A control tube for each of the chromogens used contained equivalent amounts of isotype standards. A minimum of 25,000 cell events per assay were acquired on a FACsCalibur flow cytometer (BD Biosciences, Madrid, Spain). Data were analyzed using Cell Quest software (BD Biosciences) and the results were expressed as percent positive.. Table 1. Antibodies used in flow cytometry for phenotypic characterizations. Antibody. Specificity. Source. R-PE-CD29 R-PE-CD34 FITC-CD44 FITC-CD45 PE-CD73 PE-Cy5-CD90 FITC-CD105 CD117 R-PE-CD166 SSEA-4 STRO-1. β1 Integrin Hemopoietic progenitor cell antigen 1 (HPCA1) Homing cellular adhesion molecule (HCAM) Leukocyte common antigen (LCA) Ecto-5′-nucleotidase Thy-1 Endoglin, SH2 c-kit, stem cell factor receptor (SCFR) Activated leukocyte cell adhesion molecule (ALCAM) Stage-specific embryonic antigen 4 (SSEA-4) Stromal antigen 1 (STRO-1). BD Pharmingen BD Pharmingen BD Pharmingen BD Pharmingen BD Pharmingen BD Pharmingen Chemicon BD Pharmingen BD Pharmingen R&DSystems Developmental Studies Hybridoma Bank.
(4) 2.3. Multipotential characterization At the time of phenotypic analysis, after 7–9 culture passages for expansion, the cells were differentiated towards adipocyte, osteocyte, and chondrocyte lineages. 2.4. Adipogenic differentiation The 7–9 passage BM-MSCs were detached using trypsin-EDTA, seeded at 1.5×10⁵ cells/cm2 in a chamber slide and cultured in growth medium until confluent. Adipogenesis was induced by culturing for three weeks in Bullekit Adipogenic Differentiation Medium (Lonza, Barcelona, Spain), following the manufacturer’s instructions. Each differentiation point was compared to a control point corresponding to cells cultured for the same period of time in DMEM with 20% FBS. Differentiation was confirmed by detection of cytoplasmic lipid droplets by oil red O staining after cell fixation in 4% paraformaldehyde. 2.5. Osteogenic differentiation BM-MSCs at the 7th–9th passages were detached using trypsin-EDTA, seeded at 1.5×10⁵ cells/cm2 in a chamber slide and cultured in growth medium until confluent. Osteogenesis was induced by culture for three weeks in hMSC Bullekit Osteogenic Differentiation Medium (Lonza). This culture medium was changed every 2–3 days. Each differentiation point was compared with a control point that corresponded to cells cultured for the same period of time with DMEM and 20% FBS. Differentiation was confirmed by alizarin red staining after cell fixation in 4% paraformaldehyde to assess the presence of calcium deposits. 2.6. Chondrogenic differentiation Chondrogenesis was assessed using the micropellet formation (2.5×10⁵ cells) technique (Johnstone et al., 1998), with some modifications. BM-derived cells from the 7th to 9th passages were detached using trypsin-EDTA and centrifuged at 300g for 10 min. The resulting pellet was cultured in chondrogenic differentiation medium ( Livak and Schmittgen, 2001) both in normoxic humidified atmosphere with 5% CO2 and hypoxic conditions obtained using the GasPak™ EZ Anaerobe Pouch System (BD Diagnostics). The medium used for the first two days contained DMEM with 15% fetal calf serum (FCS), supplemented with 5 mg/ml ascorbic acid (AA), 1/1000 monotioglycerol (MTG), and 1% P/S to promote chondrogenic induction. This medium was replaced by DMEM with 15% knockout serum (Gibco, Madrid, Spain), 1% P/S and supplemented with 5 mg/ml AA, 10 μM dexamethasone, 6 μg/ml transferrin, 1×10⁻⁷ M retinoic acid, and 1 ng/ml of recombinant human transforming growth factor-β3 (TGF-β3) (Prospec-Tany Technogene Ltd., Rehovot, Israel) for 2, 4, 7, 14, 21, and 28 days. The culture medium was changed every 2–3 days. Each time point of the differentiation assay was compared with cells cultured for the same period of time with DMEM and 20% FBS. Differentiation was assessed through histological, immunohistochemical, and qPCR techniques. Cell aggregates were embedded in TissueTech OCT compound (Sakura Finetek) and frozen. The presence of hyaline cartilage-characteristic molecules, such as collagen type II and proteoglycans, was detected by histological, immunohistochemical, and qPCR techniques as described below. 2.7. Histological analyses For chondrogenesis evaluation, 4 μm-thick frozen sections of aggregates were stained with hematoxylin and eosin (HE), Masson’s trichrome (MT), toluidine blue (TB), and safranin O (SaO) for proteoglycans and collagens. 2.8. Immunohistochemical analyses For chondrogenesis evaluation, 4 μm-thick frozen sections were incubated with primary antibodies (Table 2) to detect the presence of collagen types I (Abcam, Cambridge, UK) and II (Neomarker, Barcelona, Spain), and with a polyclonal antibody to detect aggrecan C-20 (Santa Cruz Biotechnology, Heidelberg, Germany). The peroxidase/DAB ChemMateTM DAKO EnVision™ detection kit (Dako, Barcelona,.
(5) Spain) was used to determine antigen–antibody interactions. Negative staining controls were achieved by omitting the primary monoclonal antibody. Samples were visualized using an optical microscope.. Table 2. Antibodies used for immunohistochemical analyses. Specificity. Clone. Source. Collagen type I Collagen type II Aggrecan C-20. COL1 6B3 Polyclonal. Abcam Neomarker Santa Cruz Biotechnology. 2.9. RNA extraction Isolation of total RNA from cell cultures was accomplished using Trizol Reagent (Invitrogen, Barcelona, Spain), following the manufacturer’s protocol. RNA was assessed for quantity at 260 nm using a NanoDrop™ spectrophotometer (Thermo Scientific, Madrid, Spain). The A260/A280 ratio was calculated to assess quality and purity. Total RNA (1 μg) was further processed in RT-PCR or stored at −80 °C until use. 2.10. cDNA synthesis Before reverse-transcription, the total RNA underwent DNase digestion (Fermentas) for complete removal of DNA contamination. Subsequently, the reverse-transcription reaction was performed from 1 μg of total RNA following the manufacturer’s instructions, using SuperScript™ First-Strand Synthesis System for RT-PCR (Invitrogen™, Spain) to a total volume of 20 μl in a Thermocycler (Gene Amp PCR System 9700, Applied Biosystem, Madrid, Spain). 1 μg of total RNA, 0.5 μg oligo d(T), 0.5 mM of dNTP mix, and 3 μl of DEPC-treated water were denatured at 65 °C for 5 min and chilled on ice for at least 1 min. Then, 2 μl of 10×RT buffer, 5 mM MgCl2, 0.01 M DTT, and 40 U of RNaseOUT Recombinant Ribonuclease Inhibitor were mixed, collected by centrifugation and incubated at 42 °C for 2 min. After incubation, 50 U of SuperScript™ RT were added and incubated at 42 °C for 50 min and 70 °C for 15 min in a Thermocycler (Gene Amp PCR System 9700, Applied Biosystems). Finally, samples were chilled on ice and incubated with 2 U of RNAse H for 20 min at 37°C before proceeding to the next step. Samples were stored at −20 °C before the amplification of target cDNAs. Positive and negative controls were included in each experiment. RNA extraction, reverse-transcription-PCR assay setup and post-reverse-transcription-PCR product analysis were carried out in separate dedicated rooms to prevent cross-contamination. 2.11. Quantitative real-time reverse-transcription-PCR analysis (qRT-PCR) Real-time PCR analysis was performed, using the primers shown in Table 3, on LightCycler® 480 Instrument (Roche, Mannheim, Germany)..
(6) Table 3. Sequences of the quantitative polymerase chain reaction (qPCR) primers used for amplification of the human mRNA corresponding to chondrogenic-specific genes and stem cell marker genes.. Gene name. Forward primer (5′–3′). Reverse primer (5′–3′). mRNA ID number. Sox2 Oct3/4 Nanog Cadherin 2 (Cdh2) Tenascin-C (Tnc) Sox9 Collagen type 2A1 (Col2A1) Aggrecan (Agg) Runx2 Collagen type X (Col10) Matrix metalloprotease 13 (MMP13) Collagen type I (Col1) β-Actin. ctccgggacatgatcagc ggtggagagcaactccaatg atgcctcacacggagactgt agtatccggtccgatctgc ggtacagtgggacagcaggt gtacccgcacttgcacaac gtgtcagggccaggatgt gcctacgaagcaggctatga gtgcctaggcgcatttca caccttctgcactgctcatc. ggtagtgctgggacatgtgaa tctgcagagctttgatgtcc aagtgggttgtttgcctttg ctgtggggtcattgtcagc cccctttgtaggacagagca tcgctctcgttcagaagtctc tcccagtgtcacagacacagat gcacgccataggtcctga tgactggcggggtgtaag ggcagcatattctcagatgga. NM_003106 DQ486513 NM_024865 NM_001792 NM_002160 NM_000346 NM_001844 BC036445 NM_001024630 NM_000493. ccagtctccgaggagaaaca. aaaaacagctccgcatcaac. NM_002427. gtgatgctggtcctgttggt agagctacgagctgcctgac. caccatcgtgagccttctct ggatgccacaggactcca. NM_000088 NM_001101. The PCR reaction consisted of 10 μl of Master Mix 2×concentrate, 0.25 μM of each forward and reverse primer, the cDNA template and PCR-grade water up to a final volume of 20 μl in the LightCycler 480 Multiwell Plate 96. The multiwell plate was loaded in the LightCycler 480 Instrument until the PCR program started. The initial enzyme activation at 95 °C for 10 min was followed by 50 cycles of target amplification consisting of three sequential steps: 95 °C for 10 seconds (s), 61 °C for 5 s, and 72 °C for 7 s. After amplification, a melting curve analysis was performed and a final cooling step was applied at 40 °C for 20 s. The single amplification and expected size of each PCR product were verified. The use of 2% agarose gel electrophoresis, stained with SYBR®Safe DNA gel stain (Invitrogen™), of all PCR products revealed a single band that corresponded to the single-amplified products as predicted by the PCR melting curve analysis. PCR primers were positioned to span exon–intron boundaries, reducing the risk of detecting genomic DNA. The primers were purchased from Roche (Mannheim, Germany). The β-Actin gene (β-Act) was used as the internal control housekeeping gene to normalize the amount of target cDNA. Data analysis was performed using LightCycler 480 Relative Quantification software (Roche). Relative levels of expression were calculated by the 2−ΔΔCt method (Livak and Schmittgen, 2001). Each assay was done at least in triplicate and included marker-positive and marker-negative controls and reagent with no template controls. Each data was normalized against the housekeeping gene and compared with its corresponding control point of cells grown in DMEM with 20% FBS. For each gene expression, we assigned the value 1 to the lowest level of expression and the other values were measured as relative expression levels (R.E.L). 2.12. DNA sequencing analysis At least one PCR product coming from each real-time PCR experiment was used as template DNA. PCR products were purified by an enzymatic method (ExoSAP-IT, Amersham Biosciences). DNA sequencing was performed in a reference facility on ABI 3100 (Applied Biosystems) using Big Dye terminators. Forward and reverse specific primers used were the same as for the qPCR experiments (Table 3). 2.13. Other procedures Standard procedures for manipulation of nucleic acids were essentially those followed in Sambrook et al. (1989)..
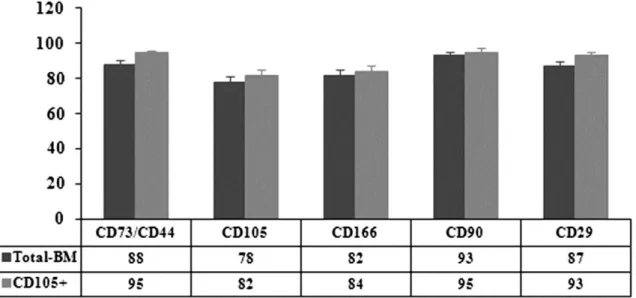
(7) 2.14. Statistical analysis Each experiment was repeated at least three times. The statistical significance of the differences between mean values was determined using a two-tailed t test; p<0.05 was considered significant. Results are expressed as the mean±standard deviation (mean±SD). 3. Results 3.1. Isolation of BM-MSCs populations Spindle-shaped bipolar cells attached to the flask were observed at the first medium change at 48 h of culture. We magnetically selected, differentiated, and analyzed the characteristics and multi-potentiality of two subsets of cells: unselected (not passed through the magnetic column, total-BM) and CD105selected cells (retained by magnetic column, CD105+), obtained as described in Section 2. 4. Characterization of the BM-MSC populations 4.1. Phenotypic analysis For BM-MSCs at the fourth passage, the percent of CD105-positive cells was between 73% and 86% before separation and increased to 95% in the CD105+ fraction, after the separation step. At the beginning of the differentiation experiments after culture expansion, the two subsets of cells were characterized phenotypically using flow cytometry. These cell subsets both showed very similar expression of surface markers without any statistically significant differences. The total-BM-MSCs and the CD105+ subset showed CD73 and CD44 antigens co-expressed at 88% and 95%, respectively; CD105 was expressed at 78% and 82%, respectively; and CD166 was expressed at 82% and 84%, respectively (Fig. 1). The percentage of CD90 expression was around 94% and of CD29 was around 90% (Fig. 1) in both subsets. The expression levels for CD271 and SSEA-4 ranged from 15% to 30%, and CD117 and Stro-1 were not seen in our populations. CD45 and CD34 were also absent (data not shown).. Fig. 1. Surface antigen expressions of non-selected (total-BM) and selected (CD105+) cells. Each value is given as the percent of positive cells.. 4.2. Multi-differentiation potential We induced adipogenic, osteogenic, and chondrogenic differentiation to confirm the multi-potentiality of our cultured expanded cells (Fig. 2)..
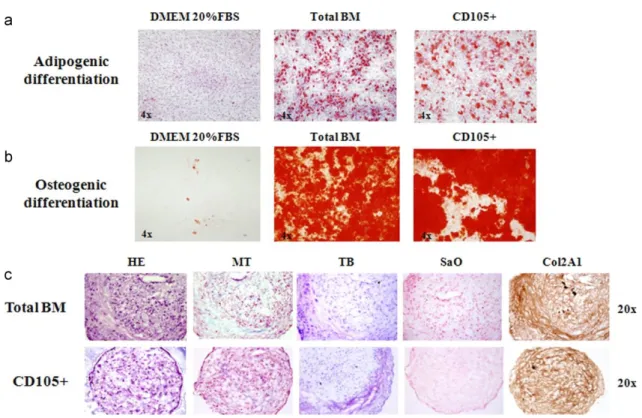
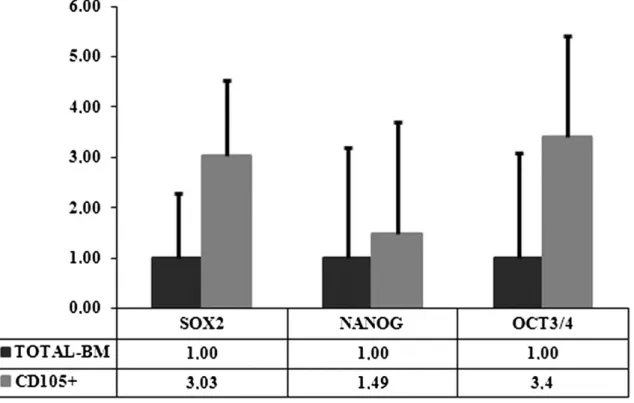
(8) Fig. 2. Staining techniques for non-selected (total-BM) and selected (CD105+) differentiated cells. The photos are from day 21 of culture. (a) Oil Red O staining of cells differentiated toward adipocytes, compared to the control cells cultured for the same times in Dulbecco’s Modified Eagles Medium (DMEM) with 20% fetal bovine serum (FBS). (b) Alizarin Red staining of cells differentiated toward osteoblasts compared to the control cells cultured for the same duration in DMEM with 20% FBS. (c) Histochemical HE=hematoxylin–eosin; MT=Masson’s thrichome; TB=toluidine blue; SaO=safranin O staining results and immunohistochemical results for collagen type II (Col2A1) cells differentiated toward chondrocytes.. After 21 days of culture with the appropriate differentiation medium or with 20% FBS for the controls, the cells were stained with Oil Red O for lipid droplets to evaluate adipogenic differentiation (Fig. 2a), or with Alizarin Red for calcium deposits to evaluate osteogenic differentiation (Fig. 2b). All the controls were negative for staining, showing the absence of lipid droplets or calcium deposits, while the cells grown in differentiation media were positively stained, showing the presence of lipid droplets or calcium deposits, indicating differentiation. The total-BM fraction showed a trend to have a higher differentiation potential, however, without statistically significant differences. To evaluate chondrogenic potential at 2, 4, 7, 14, 21, and 28 days of culture, either with differentiation medium or with 20% FBS, the aggregates were analyzed by histochemistry using hematoxylin–eosin (HE), Masson’s thrichrome (MT), toluidine blue (TB) and safranin O (SaO) staining, and immunohistochemistry for aggrecan and collagen types I and II. These techniques confirmed chondrogenic differentiation with no appreciable differences between the selected and unselected cells. Histochemistry showed no differences among days 2, 4, and 7 of culture (data not shown). Chondrogenic differentiation was detectable between days 14 and 21 of culture with no appreciable differences between normoxic and hypoxic conditions. At these analysis times, the presence of collagens and proteoglycans could be seen with no appreciable differences between the populations studied (Fig. 2c; photos show results at day 21 of culture and are representative of both times of analysis). Immunohistochemistry results for aggrecan (Agg) and Col1 were negative for all the times studies (data not shown). 4.3. Quantification of stem cell markers To determine whether the selected cells represent a more immature phenotype, we analyzed and compared the presence of stem cell marker genes (Sox2, Nanog, and Oct3/4) at the beginning of each experiment..
(9) For each gene, the reference value 1 was given to the lowest expression level and the results were measured as relative expression levels (R.E.L). Using this quantification, CD105+ cells appeared to be the more immature fraction, which showed a higher expression of Sox2, Nanog, and Oct3/4 (3.03, 1.49, and 3.40 times, respectively). However, these differences are not statistically significant (Fig. 3).. Fig. 3. Stem cell marker gene expression levels of non-selected (total-BM) and selected (CD105+) cells at the start of experiments. For each gene the reference value 1 is assigned to the lowest expression level.. 5. Characterization of cell sources: donor influence on chondrogenesis Analyzing each cell source individually, we could divide the six donors into two groups: A, B, and C represent the first group; D, E, and F the second one. This division was based on differences in the expression of the CD29 surface marker among the donors. Table 4 shows the data for age, sex, and surface marker expressions of the donors. Differences in the expression of CD73/CD44 and CD105 were not statistically significant, but the differences in CD29 expression were significant (p<0.005). The first group, designated the low level (LL) group, had a CD29 expression lower than 90%, while in the second group, designated the higher level (HL), the CD29 level exceeded 90%. No differences other than CD29 level was found between these groups..
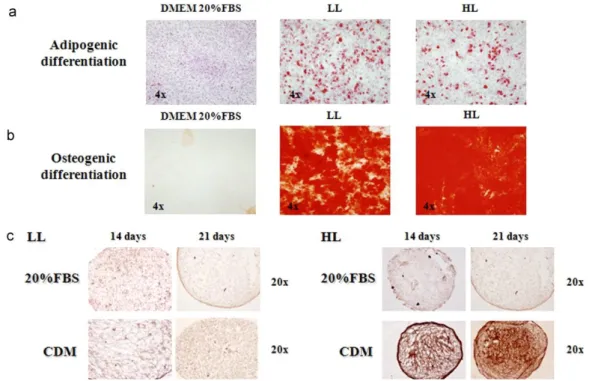
(10) Table 4. Characteristics of the donors included in the study. The division into two groups was based on CD29 surface antigen expression. DONOR YEARS SEX CD73/CD44 CD105 CD166 CD29 CD271 CD117 SSSEA4 Stro-1 CD34 CD35. A. B. C. D. E. F. 61 Female 85 73 84 87 15 Neg Neg Neg Neg Neg. 40 Male 75 60 77 76 Neg Neg 15 Neg Neg Neg. 72 Female 94 82 76 82 25 Neg 30 Neg Neg Neg. 65 Female 99 87 93 93 Neg Neg 18 Neg Neg Neg. 60 Male 80 75 80 96 22 Neg Neg Neg Neg Neg. 40 Male 98 82 96 94 30 Neg 26 Neg Neg Neg. GROUP. LL (low level). HG (high level). 5.1. Differentiation potential We compared the two donor groups for capability to differentiate toward different lineages. Adipogenic and osteogenic potentials were very similar between the HL and LL groups (Fig. 4a and b). The chondrogenic potential, however, differed between the LL and HL groups. Comparing cells cultured in differentiation medium with its control points, there was no difference in the amount of Col2A1 in the LL group, but an appreciable difference was seen in the HL group (Fig. 4c).. Fig. 4. Staining of low level (LL) differentiated cells (CD29 expression lower than 90%) and high level (HL) differentiated cells (CD29 expression exceeding 90%). (a) Oil Red O staining of the two groups when differentiated toward adipocytes compared to controls cultured in Dulbecco’s Modified Eagles Medium (DMEM) with 20% fetal bovine serum (FBS). The photos are from day 21 of culture. (b) Alizarin Red staining of the two groups when differentiated toward osteoblasts, compared to controls. The photos are from day 21 of culture. (c) Immunohistochemical results for Col2A1 in the two cell groups. For each group the comparison is made between controls cultured for equivalent time in DMEM with 20% FBS and cells grown in chondrogenic differentiation medium (CDM)..
(11) 5.2. Molecular events during chondrogenesis After finding significant (p<0.05) differences in the amount of Col2A1 between the LL and HL groups, we analyzed gene expression during the chondrogenic process at time intervals of 2, 4, 7, 14, 21, and 28 days, in both normoxic and hypoxic conditions. In this experiment, we compared the cells cultured in differentiation medium with the corresponding control cells cultured in DMEM with 20% FBS at each time interval. By analysis of chondrocyte marker genes (Sox9, Agg, and Col2A1) at 14 and 21 days of differentiation, we found that the LL group was not capable of differentiation toward chondrocyte-like cells, while the HL group did differentiate (Fig. 5). In Fig. 5, 20% FBS-HL and 20% FBS-LL represent the control points of the two groups and CDM-HL and CDM-LL represent the cells treated with chondrogenic differentiation medium (CDM) belonging to the two groups. For each gene, the value 1 was given to the lowest expression level to allow comparative measurement.. Fig. 5. Chondrogenic-specific gene expression levels of low level (LL) differentiated cells (CD29 expression lower than 90%) and high level (HL) differentiated cells (CD29 expression exceeding 90%) in hypoxic and normoxic conditions. Four experimental treatments, controls and treated cells from the HL group (20% FBS-HL and CDM-HL, respectively) and controls and treated cells from the LL group are compared (20% FBS-LL and CDM-LL, respectively). Control cells were cultured in Dulbecco's Modified Eagles Medium (DMEM) with 20% FBS, treated cells were cultured in differentiation medium for the same duration. (a) Expression levels of Sox9, aggrecan (Agg), and collagen type 2A1 (Col2A1) at days 14 and 21 of culture in normoxic conditions. (b) Expression levels of Sox9, Agg, and Col2A1 at days 14 and 21 of culture in hypoxic conditions. *indicates p<0.05.. At day 14 of culture in normoxic conditions (Fig. 5a), the HL group cells cultured in chondrogenic differentiation medium (CDM-HL) displayed significantly higher expression levels (p<0.05) of Sox9, Agg, and Col2A1 (81.86, 91.27, and 37.66 times, respectively). At day 21 of normoxic culture, Agg and Col2A1 levels of the CDM-HL samples remained significantly higher at 69.65 and 105.05 times, respectively (p<0.05), but the level for Sox9 gene expression of treated cells was significantly (p<0.05) lower than that of the control (8.37 times in treated cells compared to 34.18 times in the control cells). Under hypoxic conditions (Fig. 5b), at day 14 of culture the levels of Sox9 and Agg did not differ between the controls and treated cells. Only the level of Col2A1 was significantly higher (p<0.05) in CDM-HL (79.89 times). At day 21 in CDM-HL the expression levels of Sox9, Agg, and Col2A1 were, respectively, 70.16, 51.88, and 181.65 times higher and were statistically significant (p<0.05). At this point, we compared the expression of chondrocyte-specific genes in the HL group comparing hypoxic and normoxic conditions (Fig. 6). Sox9 gene expression levels were higher at day 21 in hypoxic conditions (20.53 times) followed by its expression at day 14 in normoxic conditions (9.78 times). Both these differences were statistically significant (p<0.05). At both days 14 and 21 of differentiation, expression levels of Col2A1 gene were higher in hypoxic conditions (71.26 and 162.02 times, respectively), but without any statistical significant difference. Regarding the Agg, the expression levels were higher at day 14 and at day 21 in normoxic conditions (15.62 and 11.92 times, respectively) and both differences were statistically significant (p<0.05)..
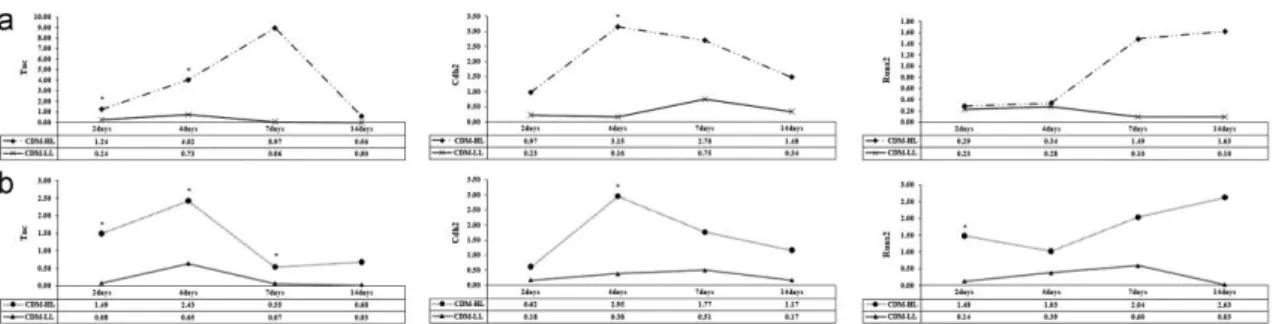
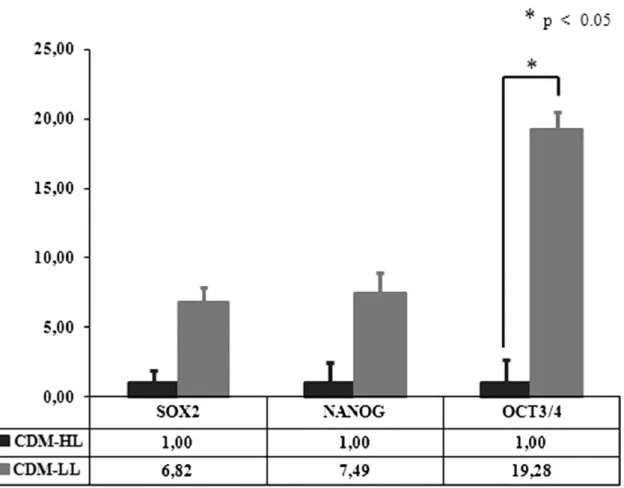
(12) Fig. 6. Expression levels of high level (HL) differentiated cells (CD29 expression exceeding 90%) during chondrogenic differentiation. Expression levels of Sox9, aggrecan (Agg) and collagen type 2A1 (Col2A1) at days 14 and 21 of culture in hypoxic and normoxic conditions. For each gene the reference value 1 is given to the lowest expression level between cells cultured in differentiation medium (CDM-HL) and cells cultured in DMEM with 20% fetal bovine serum (20% FBS-HL) in hypoxic and normoxic conditions. *indicates p<0.05.. We then studied the expression of other genes involved in the chondrogenesis of the cartilage growth plate. Gene expressions of cells grown in differentiation medium from the two donor groups were compared. The values for each gene were calculated for each time point; the differentiation medium cells were compared to their corresponding controls (Fig. 7). This study permitted us to establish, in our experimental conditions, the different phases of the process and to understand which genes are likely to be essential for chondrogenesis.. Fig. 7. Expression levels of low level (LL) differentiated cells (CD29 expression lower than 90%) and high level (HL) differentiated cells (CD29 expression exceeding 90%) during chondrogenic differentiation. For each gene at each time of assay the value is obtained by comparing cells cultured in differentiation medium to the same cells cultured in DMEM with 20% fetal bovine serum (FBS). (a) Tenascin-C (Tnc), cadherin 2 (Cdh2) and Runx2 expression levels at days 2, 7, and 14 of culture in normoxic conditions; (b) Tnc, Cdh2, and Runx2 expression levels at days 2, 7, and 14 of culture in hypoxic conditions. *indicates p<0.05.. Under normoxic conditions (Fig. 7a), chondro-progenitor condensation occurred between days 2, 4, and 7 when the Tnc and Cdh2 genes were upregulated in the HL group. Differences in gene levels between the HL and LL groups were statistically significant at days 2 and 4 for the Tnc gene (p<0.05) and only day 4 for the Cdh2 gene (p<0.05). Differences in Runx2 gene levels occurred between days 7 and 14 but were not statistically significant. Under hypoxic conditions (Fig. 7b), the up-regulation of Tnc and Cdh2 occurred between days 2, 4, and 7 of culture. The increases were statistically significant (p<0.05) in both the HL and LL groups at all three times, but differences in Cdh2 levels were statistically significant only at day 4 (p<0.05). In hypoxic conditions, Runx2 gene expression was significantly upregulated in the HL group at day 2 (p<0.05), and, even if upregulated at days 7 and 14, its different expressions were not statistically significant. 5.3. Stem cell markers quantification To determine which of the two groups represents the more immature phenotype, we compared the expression levels of stem cell marker genes (Sox2, Nanog, and Oct3/4) at the beginning of each experiment. For each gene, the reference value 1 was given to the lowest expression level. The LL group displayed a more undifferentiated state with higher expression of the Sox2, Nanog, and Oct3/4 genes (6.82, 7.49, and 19.28 times, respectively); however, the difference in Oct3/4 expression was the only one that was statistically significant (p<0.05) ( Fig. 8)..
(13) Fig. 8. Stem cell marker expression levels at the start of experiments comparing high level (HL) differentiated cells (CD29 expression exceeding 90%) and low level (LL) differentiated cells (CD29 expression lower than 90%). For each gene the reference value 1 is given to the lowest expression level. *indicates p<0.05.. 6. Discussion The interest in MSCs and their possible application in cell therapy have resulted in a better understanding of the basic biology of these cells. Bone marrow represents the most commonly used tissue source for the isolation of MSCs (Pittenger et al., 1999), but due to the low number of cells that can be isolated, culture expansion is necessary to obtain adequate cell numbers for clinical purposes and for the analysis of molecular mechanisms. In this study, we addressed the question of use of surface antigen selection of MSC populations. Our work focused on two aims: to identify a population with higher chondrogenic potential for possible application in cell therapy to treat cartilage defects and to elucidate the mechanism underlying chondrogenic differentiation. We therefore analyzed two different populations: one obtained through the positive magnetic selection of cells having the CD105 surface antigen (CD105+) and the second from unselected BM-MSCs (total-BM). CD105 (human endoglin) is a homodimeric integral membrane glycoprotein highly expressed in MSCs. It belongs to the transforming growth factor-β (TGF-β) receptor system (Cheifetz et al., 1992) and binds TGF-β1 and TGF-β3 to form a heteromeric complex with TGF-β type I and/or TGF-β type II receptors (Bellon et al., 1993). CD105 also interacts with bone morphogenetic protein-7 (BMP-7), associating with activin type II receptors, and with BMP-2, associating with ligand binding type I receptors (Barbara et al., 1999). Looking for the chondrogenesis, where members of the transforming growth factor family represent important signals in the development of cartilage tissue, we answered the question if CD105 presence could be helpful in chondrogenic differentiation. To investigate the properties of our two MSC populations, we compared the characteristics of our culture-expanded cells for phenotypic profiles, multi-lineage differentiation potential and expression of the stem cell marker genes, Nanog, Oct3/4, and Sox2. A number of previous studies using CD105+-enriched MSC populations have been reported. Some of these assessed the differentiation capacity and the phenotypic characteristics of the selected cells,.
(14) providing some indications of their chondrogenic capacity (Arufe et al., 2009 and Majumdar et al., 2000) and osteogenic potential (Aslan et al., 2006). Other studies compared different populations (Kastrinaki et al., 2008 and Jarocha et al., 2008) and demonstrated that the culture expansion necessary to obtain a sufficient number of cells leads to the development of similar characteristics in the different populations. After three to five passages, our cell populations displayed similar phenotypes, both related to that of MSCs. Both populations were positive for CD105, CD90, CD44, CD29, CD73, and CD44 and negative for CD34 and CD45. In addition, both populations displayed similar differentiation potentials for adipogenic, osteogenic, and chondrogenic lineages. Finally, the stem cell marker gene expressions were not significantly different. The results during the course of the experiments led us to analyze the data for individual donors. The phenotypic profiles of the donors suggested a division into two groups based on the amount of CD29 (β1integrin) surface antigen. We designated the donors with the higher expression level of CD29 (CD29>90%) as the HL group and the donors with the lower expression level (CD29<90%) as the LL group. Dividing the donors in this way permitted also the separation of the donors according to chondrogenic capability. Although cells from the HL and LL groups displayed similar differentiation potential for adipogenic and osteogenic lineages, their chondrogenic potential was markedly different. This difference could be seen both in the immunohistochemistry results for the amount of Col2A1 and in the qPCR results for the expression of chondrocyte-specific genes. The LL group did not have any significant differences between treated cells and control cells. However, the HL group treated cells had more capacity for chondrogenic differentiation capacity than their control cells. The HL group also had a higher expression of CD29; these results point to a strict relationship between the chondrogenic capacity of cells and the level of CD29 expression. CD29 is an integrin β-1 protein. Integrins are heterodimeric membrane receptors made up of alpha and beta subunits and are involved in cell–cell or cell–matrix interactions (Hynes, 1987). In general, these interactions are important for regulation of cell migration (Hemler, 1990), cartilage development (Woods et al., 2007), and cell survival (Cao et al., 1999). Regarding cartilage development and function, it has been described that administration of anti-β1 antibodies to cultures of mouse limb bud mesenchymal cells inhibits the formation of cartilagineous nodules (Shakibaei, 1998), suggesting a role of CD29 during both mesenchymal condensation and chondrocyte differentiation. In addition, deletion of β1 integrin in the limb bud results in multiple abnormalities of knee joints, playing a pivotal role in joint development and in its structural organization (Raducanu et al., 2009). Finally, mutant mice carrying a cartilage-specific deletion of the β1 integrin gene develop a chondrodysplasia of various severities (Aszodi et al., 2003). As reported in a recent study (Choi et al., 2009), we suggest the importance not only of the presence or absence of a receptor and its ligand but also of the density and affinity of interactions between those two entities. In addition, it is important to keep in mind the possibility that CD29 may heterodimerize with various alpha subunits, giving rise to different types of integrins. We analyzed the chondrogenesis process in the HL group. Through the comparison of days 14 and 21 of hypoxic and normoxic conditions, like in other papers (Koay and Athanasiou, 2008), we observed that gene expression levels of Col2a1 were higher in both times of analysis when the differentiations were carried out in a hypoxic environment. The gene levels of Sox9 were higher at day 21 in hypoxic condition, while Agg gene levels were higher at days 14 and 21 of normoxic conditions. Then, looking for the mechanism underlying chondrogenic differentiation of HL group, in agreement with earlier studies, we found a process similar to the one seen in growth plate cartilage. This process is initiated by the recruitment and condensation of mesenchymal cells, which depend on signals initiated by cell–cell and cell–matrix interactions (Cohn and Tickle, 1996). This cellular condensation is associated with the appearance of cell adhesion molecules, such as neural cadherin (Cdh2) (DeLise and Tuan, 2002) and tenascin-C (Tnc) (Mackie et al., 1987), that disappear in differentiating chondrocytes. In every condensation, one transcription factor is always expressed. This is runt-domain transcription factor Runx2, which is also known as core binding factor (Cbfa1) (Ducy et al., 1997). In this chondro-progenitor condensation step, we found an initial up-regulation of Tnc and Cdh2 at culture days 4 and 7, coinciding with the strengthened cell–cell interactions that follow the condensation stage (Chimal-Monroy and Díaz de León, 1999). The expression levels of Runx2, however, were not statistically significant at any culture time. As chondrogenesis differentiation continues, one of the earliest markers expressed is nuclear transcription factor Sox9 (Bi et al., 1999), required for differentiation of the chondro-progenitor cells to mature chondrocytes as well as for deposition of the cartilage matrix containing chondrocyte-specific genes, such as collagens II, IX, XI, and aggrecan (Lefebvre et al., 1997). In our experimental conditions, this step occurred between days 14 and 21, coinciding with the up-regulation of Sox9, Col2A1, and Agg genes. The last step in the differentiation process is hypertrophy of the chondrocytes, leading to cartilage matrix ossification and vascular invasion (Ortega et al., 2004). The hypertrophic phenotype is.
(15) characterized by an up-regulation of Runx2 in early hypertrophy, and of Col10 and MMP13 in the later hypertrophic stages. We indeed found an up-regulation of Col10 and MMP13 at day 28 of differentiation, confirming the hypertrophic state. None of these gene expression variations were seen in the gene expression analysis of the LL group samples. The last part of our study was the gene expression analysis for the stem cell marker genes, Sox2, Nanog, and Oct3/4. At the beginning of the experiments, higher expression levels of these markers were found in the LL group, the one with the lower chondrogenic potential. As seen in a previous study, lower gene expressions characteristic of stem cells were associated with a robust and efficient differentiation into chondrocyte-like cells (Lian et al., 2007). It is probable that the higher levels of stem cell gene markers in the population with the poorest differentiation would relate to different capabilities of the various isoforms of these genes (Lee et al., 2006). It is necessary to delve deeply into gene expression studies when the object is the prediction of stem cell activity. In conclusion, in this work we highlight the importance of the BM-MSC donor. It would be very useful to identify the differences in phenotypes of donor cells that influence increased capability for adipo-, osteo- or chondrogenic differentiation. In our experimental conditions, we found a correlation between CD29 expression and the chondrogenic capacity of cells. This suggests the importance of a high level of expression of the CD29 antigen when selecting BM-MSCs with a higher chondrogenic potential. Competing interests The authors declare that they have no competing interests. Authors’ contributions All authors were involved in the research presented, and drafted and approved the final manuscript. Acknowledgements This study was supported by grants from Servizo Galego de Saúde, Xunta de Galicia (PS07/84), Catedra Bioiberica de la Universidade da Coruña, and Instituto de Salud Carlos IIICIBER BBN CB06-01-0040. Claudia Cicione was supported by the CHU A Coruña Foundation, Spain. Silvia Díaz-Prado is the beneficiary of an Isidro Parga Pondal contract from Xunta de Galicia, A Coruña, Spain. Tamara HermidaGómez is the holder of a contract from Fondo de Investigación Sanitaria (2008), Spain. Emma MuíñosLópez is supported by the Rheumatology Spanish Foundation, Spain. We would like to thank M.J. Sánchez and P. Filgueira for technical assistance.. References Aslan et al., 2006. H. Aslan, Y. Zilberman, L. Kandel, M. Liebergall, R.J. Oskouian, D. Gazit, Z. Gazit. Osteogenic differentiation of noncultured immunoisolated bone marrow-derived CD105+ cells. Stem Cells, 24 (2006), pp. 1728–1737. Avilion et al., 2003. A.A. Avilion, S.K. Nicolis, L.H. Pevny, L. Perez, N. Vivian, R. Lovell-Badge. Multipotent cell lineages in early mouse development depend on SOX2 function. Genes Dev., 17 (2003), pp. 126–140. Arufe et al., 2009. M.C. Arufe, A. De la Fuente, I. Fuentes-Boquete, F.J. De Toro, F.J. Blanco. Differentiation of synovial CD-105+ human mesenchymal stem cells into chondrocyte-like cells through spheroid formation. J. Cell. Biochem., 108 (2009), pp. 145–155. Aszodi et al., 2003. A. Aszodi, E.B. Hunziker, C. Brakebusch, R. Fässler. Beta1 integrins regulate chondrocyte rotation, G1 progression, and cytokinesis. Genes Dev., 17 (2003), pp. 2465–2479. Buckwalter and Mankin, 1998. J.A. Buckwalter, H.J. Mankin. Articular cartilage: degeneration and osteoarthritis, repair, regeneration, and transplantation. Instr. Course Lect., 47 (1998), pp. 487–504. Bianco et al., 2001. P. Bianco, M. Riminucci, S. Gronthos, P.G. Robey. Bone marrow stromal stem cells: nature, biology, and potential applications. Stem Cells, 19 (2001), pp. 180–192. Barry et al., 1999. F.P. Barry, R.E. Boynton, S.E. Haynesworth, J.M. Murphy, J. Zaia. The monoclonal antibody SH2, raised against human mesenchymal stem cells, recognizes an epitope on endoglin (CD105). Biochem. Biophys. Res. Commun., 265 (1999), pp. 134–139. Bellon et al., 1993. T. Bellon, A. Corbi, P. Lastres, C. Cales, M. Cebrian, S. Vera, S. Cheifetz, J. Massague, M. Letarte, C. Bernabeu. Identification and expression of two forms of the human transforming growth factor-betabinding protein endoglin with distinct cytoplasmic regions. Eur. J. Immunol., 23 (1993), pp. 2340–2345. Barbara et al., 1999. N.P. Barbara, J.L. Wrana, M. Letarte. Endoglin is an accessory protein that interacts with the signaling receptor complex of multiple members of the transforming growth factor-beta superfamily. J. Biol. Chem., 274 (1999), pp. 584–594..
(16) Bi et al., 1999. W. Bi, J.M. Deng, Z. Zhang, R.R. Behringer, B. de Crombrugghe. Sox9 is required for cartilage formation. Nat. Genet., 22 (1999), pp. 85–89. Cheifetz et al., 1992. S. Cheifetz, T. Bellón, C. Calés, S. Vera, C. Bernabeu, J. Massagué, M. Letarte. Endoglin is a component of the transforming growth factor-beta receptor system in human endothelial cells. J. Biol. Chem., 267 (1992), pp. 19027–19030. Cao et al., 1999. L. Cao, V. Lee, M.E. Adams, C. Kiani, Y. Zhang, W. Hu, B.B. Yang. Beta-Integrin-collagen interaction reduces chondrocyte apoptosis. Matrix Biol., 18 (1999), pp. 343–355. Choi et al., 2009. Y.A. Choi, D.K. Kim, S.S. Kang, J.K. Sonn, E.J. Jin. Integrin signaling and cell spreading alterations by rottlerin treatment of chick limb bud mesenchymal cells. Biochimie, 91 (2009), pp. 624–631. Cohn and Tickle, 1996. M.J. Cohn, C. Tickle. Limbs: a model for pattern formation within the vertebrate body plan. Trends Genet., 12 (1996), pp. 253–257. Chimal-Monroy and Díaz de León, 1999. J. Chimal-Monroy, L. Díaz de León. Expression of N-cadherin, N-CAM, fibronectin and tenascin is stimulated by TGF-beta1, beta2, beta3 and beta5 during the formation of precartilage condensations. Int. J. Dev. Biol., 43 (1999), pp. 59–67. Dominici et al., 2006. M. Dominici, K. Le Blanc, I. Mueller, I. Slaper-Cortenbach, F. Marini, D. Krause, R. Deans, A. Keating, D.J. Prockop, E. Horwitz. Minimal criteria for defining multipotent mesenchymal stromal cells, The International Society for Cellular Therapy position statement. Cytotherapy, 8 (2006), pp. 315–317. DeLise et al., 2000. A.M. DeLise, E. Stringa, W.A. Woodward, M.A. Mello, R.S. Tuan. Embryonic limb mesenchyme micromass culture as an in vitro model for chondrogenesis and cartilage maturation. Methods Mol. Biol., 137 (2000), pp. 359–375. Derfoul et al., 2006. A. Derfoul, G.L. Perkins, D.J. Hall, R.S. Tuan. Glucocorticoids promote chondrogenic differentiation of adult human mesenchymal stem cells by enhancing expression of cartilage extracellular matrix genes. Stem Cells, 24 (2006), pp. 1487–1495. DeLise and Tuan, 2002. A.M. DeLise, R.S. Tuan. Analysis of N-cadherin function in limb mesenchymal chondrogenesis in vitro. Dev. Dyn., 225 (2002), pp. 195–204. Ducy et al., 1997. P. Ducy, R. Zhang, V. Geoffroy, A.L. Ridall, G. Karsenty. Osf2/Cbfa1: a transcriptional activator of osteoblast differentiation. Cell, 89 (1997), pp. 747–754. Goldring et al., 2006. M.B. Goldring, K. Tsuchimochi, K. Ijiri. The control of chondrogenesis. J. Cell. Biochem., 97 (2006), pp. 33–44. Hardingham et al., 2002. T. Hardingham, S. Tew, A. Murdoch. Tissue engineering: chondrocytes and cartilage. Arthritis Res., 4 (Suppl. 3) (2002), pp. S63–S68. Hombach-Klonisch et al., 2008. S. Hombach-Klonisch, S. Panigrahi, I. Rashedi, A. Seifert, E. Alberti, P. Pocar, M. Kurpisz, K. Schulze-Osthoff, A. Mackiewicz, M. Los. Adult stem cells and their trans-differentiation potential– perspectives and therapeutic applications. J. Mol. Med., 86 (2008), pp. 1301–1314. Heng et al., 2004. B.C. Heng, T. Cao, E.H. Lee. Directing stem cell differentiation into the chondrogenic lineage in vitro. Stem Cells, 22 (2004), pp. 1152–1167. Hemler, 1990. M.E. Hemler. VLA-proteins in the integrin family: structure, functions and their role on leucocytes. Annu. Rev. Immunol., 8 (1990), pp. 365–400. Jung et al., 2009. D.I. Jung, J. Ha, B.T. Kang, J.W. Kim, F.S. Quan, J.H. Lee, E.J. Woo, H.M. Park. A comparison of autologous and allogenic bone marrow-derived mesenchymal stem cell transplantation in canine spinal cord injury. J. Neurol. Sci., 285 (2009), pp. 67–77. Jarocha et al., 2008. D. Jarocha, E. Lukasiewicz, M. Majka. Advantage of mesenchymal stem cells (MSC) expansion directly from purified bone marrow CD105+ and CD271+ cells. Folia Histochem. Cytobiol., 46 (2008), pp. 307– 314. Johnstone et al., 1998. B. Johnstone, T.M. Hering, A.I. Caplan, V.M. Goldberg, J.U. Yoo. In vitro chondrogenesis of bone marrow-derived mesenchymal progenitor cells. Exp. Cell. Res., 238 (1998), pp. 265–272. Kastrinaki et al., 2008. M.C. Kastrinaki, P. Sidiropoulos, S. Roche, J. Ringe, S. Lehmann, H. Kritikos, V.M. Vlahava, B. Delorme, G.D. Eliopoulos, C. Jorgensen, P. Charbord, T. Häupl, D.T. Boumpas, H.A. Papadaki. Functional, molecular and proteomic characterisation of bone marrow mesenchymal stem cells in rheumatoid arthritis. Ann. Rheum. Dis., 67 (2008), pp. 741–749. Kastrinaki et al., 2008. M.C. Kastrinaki, I. Andreakou, P. Charbord, H.A. Papadaki. Isolation of human bone marrow mesenchymal stem cells using different membrane markers: comparison of colony/cloning efficiency, differentiation potential and molecular profile. Tissue Eng. Part C Methods, 14 (2008), pp. 333–339. Koay and Athanasiou, 2008. E.J. Koay, K.A. Athanasiou. Hypoxic chondrogenic differentiation of human embryonic stem cells enhances cartilage protein synthesis and biomechanical functionality. Osteoarthritis Cartilage, 16 (2008), pp. 1450–1456. Livak and Schmittgen, 2001. K.J. Livak, T.D. Schmittgen. Analysis of relative gene expression data using real-time quantitative PCR and the 2−ΔΔCt method. Methods, 25 (2001), pp. 402–408. Lefebvre et al., 1997. V. Lefebvre, W. Huang, V.R. Harley, P.N. Goodfellow, B. de Crombrugghe. SOX9 is a potent activator of the chondrocyte-specific enhancer of the pro alpha1(II) collagen gene. Mol. Cell. Biol., 4 (1997), pp. 2336–2346. Lian et al., 2007. Q. Lian, E. Lye, K. Suan Yeo, E.K.hiaW.ay Tan, M. Salto-Tellez, T.M. Liu, N. Palanisamy, R.M. El Oakley, E.H. Lee, B. Lim, S.K. Lim. Derivation of clinically compliant MSCs from CD105+, CD24− differentiated human ESCs. Stem Cells, 25 (2007), pp. 425–436. Lee et al., 2006. J. Lee, H.K. Kim, J.Y. Rho, Y.M. Han, J. Kim. The human OCT-4 isoforms differ in their ability to confer self-renewal. J. Biol. Chem., 281 (2006), pp. 33554–33565..
(17) Mitsui et al., 2003. K. Mitsui, Y. Tokuzawa, H. Itoh, K. Segawa, M. Murakami, K. Takahashi, M. Maruyama, M. Maeda, S. Yamanaka. The homeoprotein Nanog is required for maintenance of pluripotency in mouse epiblast and ES cells. Cell, 113 (2003), pp. 631–642. Majumdar et al., 2000. M.K. Majumdar, V. Banks, D.P. Peluso, E.A. Morris. Isolation, characterization, and chondrogenic potential of human bone marrow-derived multipotential stromal cells. J. Cell. Physiol., 185 (2000), pp. 98–106. Mackie et al., 1987. E.J. Mackie, I. Thesleff, R. Chiquet-Ehrismann. Tenascin is associated with chondrogenic and osteogenic differentiation in vivo and promotes chondrogenesis in vitro. J. Cell. Biol., 105 (1987), pp. 2569– 2579. Nichols et al., 1998. J. Nichols, B. Zevnik, K. Anastassiadis, H. Niwa, D. Klewe-Nebenius, I. Chambers, H. Schöler, A. Smith. Formation of pluripotent stem cells in the mammalian embryo depends on the POU transcription factor Oct4. Cell, 95 (1998), pp. 379–391. Ortega et al., 2004. N. Ortega, D.J. Behonick, Z. Werb. Matrix remodeling during endochondral ossification. Trends Cell. Biol., 14 (2004), pp. 86–93. Pittenger, 2008. M.F. Pittenger. Mesenchymal stem cells from adult bone marrow. Methods Mol. Biol., 449 (2008), pp. 27–44. Pittenger et al., 1999. M.F. Pittenger, A.M. Mackay, S.C. Beck, R.K. Jaiswal, R. Douglas, J.D. Mosca, M.A. Moorman, D.W. Simonetti, S. Craig, D.R. Marshak. Multilineage potential of adult human mesenchymal stem cells. Science, 284 (1999), pp. 143–147. Pelttari et al., 2006. K. Pelttari, A. Winter, E. Steck, K. Goetzke, T. Hennig, B.G. Ochs, T. Aigner, W. Richter. Premature induction of hypertrophy during in vitro chondrogenesis of human mesenchymal stem cells correlates with calcification and vascular invasion after ectopic transplantation in SCID mice. Arthritis Rheum., 54 (2006), pp. 3254–3266. Rubio et al., 2005. D. Rubio, J. Garcia-Castro, M.C. Martin, R. de la Fuente, J.C. Cigudosa, A.C. Lloyd, A. Bernad. Spontaneous human adult stem cell transformation. Cancer Res., 65 (2005), pp. 3035–3039. Richler and Yaffe, 1970. C. Richler, D. Yaffe. The in vitro cultivation and differentiation capacities of myogenic cell lines. Dev. Biol., 23 (1970), pp. 1–22. Raducanu et al., 2009. A. Raducanu, E.B. Hunziker, I. Drosse, A. Aszódi. Beta1 integrin deficiency results in multiple abnormalities of the knee joint. J. Biol. Chem., 284 (2009), pp. 23780–23792. Steinert et al., 2007. A.F. Steinert, S.C. Ghivizzani, A. Rethwilm, R.S. Tuan, C.H. Evans, U. Nöth. Major biological obstacles for persistent cell-based regeneration of articular cartilage. Arthritis Res. Ther., 9 (2007), p. 213. Spagnoli et al., 2007. A. Spagnoli, L. O'Rear, R.L. Chandler, F. Granero-Molto, D.P. Mortlock, A.E. Gorska, J.A. Weis, L. Longobardi, A. Chytil, K. Shimer, H.L. Moses. TGF-beta signaling is essential for joint morphogenesis. J. Cell. Biol., 177 (2007), pp. 1105–1117. Sekiya et al., 2002. I. Sekiya, J.T. Vuoristo, B.L. Larson, D.J. Prockop. In vitro cartilage formation by human adult stem cells from bone marrow stroma defines the sequence of cellular and molecular events during chondrogenesis. Proc. Natl. Acad. Sci. USA, 99 (2002), pp. 4397–4402. Sambrook et al., 1989. J. Sambrook, T. Maniatis, E.F. Fritsch. Molecular Cloning: A Laboratory ManualCold Spring Harbor Laboratory Press, New York (1989). Shakibaei, 1998. M. Shakibaei. Inhibition of chondrogenesis by integrin antibody in vitro. Exp. Cell. Res., 240 (1998), pp. 95–106. Tondreau et al., 2004. T. Tondreau, L. Lagneaux, M. Dejeneffe, A. Delforge, M. Massy, C. Mortier, D. Bron. Isolation of BM mesenchymal stem cells by plastic adhesion or negative selection: phenotype, proliferation kinetics and differentiation potential. Cytotherapy, 6 (2004), pp. 372–379. Tuli et al., 2003. R. Tuli, S. Tuli, S. Nandi, X. Huang, P.A. Manner, W.J. Hozack, K.G. Danielson, D.J. Hall, R.S. Tuan. Transforming growth factor-beta-mediated chondrogenesis of human mesenchymal progenitor cells involves N-cadherin and mitogenactivated protein kinase and Wnt signaling cross-talk. J. Biol. Chem., 278 (2003), pp. 41227–41236. Woods et al., 2007. A. Woods, G. Wang, F. Beier. Regulation of chondrocyte differentiation by the actin cytoskeleton and adhesive interactions. J. Cell. Physiol., 213 (2007), pp. 1–8..
(18)
Figure

+7

Documento similar
We have also shown an increased production of oxidative stress in bone marrow-derived cells from sham-operated or ovariectomized Nrf2 −/− mice and a higher responsiveness of
human mesenchymal stem cells from bone marrow and adipose tissue under xeno-free conditions for cell therapy. Stem Cell
Osteonecrosis of the Femoral Head Safely Healed with Autologous, Expanded, Bone Marrow-Derived Mesenchymal Stromal Cells in a Multicentric Trial with Minimum 5 Years
Through this review, we will consider the orthopaedic bone injuries that could constitute opportunities for bone regenera- tion techniques, the studies that are needed to establish
Human cancer cells show predominant expression of NANOGP8, whereas pluripotent cells (embryonic stem cells and embryonal carcinoma cells) express the NANOG variant
Cell viability after shipment was > 80% in all cases, enabling evaluation of (1) adhesion to plastic flasks and hydroxyapatite tricalcium phosphate osteoconductive
A novel lentiviral vector targets gene transfer into human hematopoietic stem cells in marrow from patients with bone marrow failure syndrome and in vivo in humanized mice.. The
We aimed to investigate whether intravenous administration of MSC-derived EVs could induce functional recovery, promote oligodendrogenesis and aid white matter fiber repair when
