Chemistry and microbiology of the Critical Zone along a steep climate and vegetation gradient in the Chilean Coastal Cordillera
21
0
0
Texto completo
(2) Catena 170 (2018) 183–203. R.A. Oeser et al.. architecture of weathering zone; (2) degree and rate of rock weathering, thus the release of mineral-derived nutrients to the terrestrial ecosystems; (3) denudation rates; and (4) microbial abundances of bacteria and archaea in the saprolite. From north to south, denudation rates from cosmogenic nuclides are ~10 t km−2 yr−1 at the arid Pan de Azúcar site, ~20 t km−2 yr−1 at the semi-arid site of Santa Gracia, ~60 t km−2 yr−1 at the Mediterranean climate site of La Campana, and ~30 t km−2 yr−1 at the humid site of Nahuelbuta. A and B horizons increase in thickness and elemental depletion or enrichment increases from north (~26°S) to south (~38°S) in these horizons. Differences in the degree of chemical weathering, quantified by the chemical depletion fraction (CDF), are significant only between the arid and sparsely vegetated site and the other three sites. Differences in the CDF between the sites, and elemental depletion within the sites are sometimes smaller than the variations induced by the bedrock heterogeneity. Microbial abundances (bacteria and archaea) in saprolite substantially increase from the arid to the semi-arid sites. With this study, we provide a comprehensive dataset characterizing the Critical Zone geochemistry in the Chilean Coastal Cordillera. This dataset confirms climatic controls on weathering and denudation rates and provides prerequisites to quantify the role of biota in future studies.. 1. Introduction. et al., 2003; Schutz et al., 2010). Several studies demonstrated that even in the saprolite active bacterial cells exist (Buss et al., 2005; Richter and Markewitz, 1995). Biogenic weathering is a potentially important mechanism because microorganisms in the regolith are highly specialized to their environment (Fritze et al., 2000; Ghiorse and Wilson, 1988; Zvyagintsev, 1994). Fungi and their associated bacteria can directly weather minerals (Balogh-Brunstad et al., 2008; Quirk et al., 2014; Smits et al., 2012). In this process they mobilize mineralbound nutrients (e.g. P, Ca, Mg, K) that are essential elements to plants. When these nutrients are made available for plants, a biogeochemical cycle is induced that, for some elements, exceeds the weathering flux measured in rivers up to a factor of 40 and more (e.g. Uhlig et al., 2017; Wilcke et al., 2017). This biotically modulated silicate weathering is of major significance for global atmospheric CO2 cycles in the Phanerozoic (Doughty et al., 2014; Pagani et al., 2009; Quirk et al., 2012) and for sustaining a continuous soil cover (Amundson et al., 2015a). Whether these biological mechanisms overwhelm the abiotic weathering mechanisms and whether they serve to provide a feedback balancing soil erosion and soil production have never been shown, owing to the lack of diagnostic observables that allow distinguishing between abiotic and biotic drivers. To resolve the control of climate and biota on rock disintegration, we combined the fields of geochemistry, soil science, biogeochemistry, and geomorphology and applied these to different study sites along the Chilean Coastal Cordillera. We did this within the German-funded “EarthShape” (Earth surface shaping by biota) research priority program along four Critical Zone field sites along a latitudinal transect in the Chilean Coastal Cordillera. The Coastal Cordillera of Chile encompasses a prominent climate and vegetation gradient that provides a natural laboratory for investigating biotic and abiotic weathering processes. Soil formation processes in this region were previously explored by Owen et al. (2011). The authors found a 40-fold increase in soil production rate from 1 m My−1 in the hyper-arid to 40 m My−1 in the arid region. Vázquez et al. (2016) described a > 30 m thick weathering profile developed on granitic bedrock in the Coastal Cordillera in the Mediterranean climate of central Chile. The authors calculated denudation rates (derived from cosmogenic 10Be) from 20 to 70 m My−1, leading to mean residence times of 0.5 to 1.8 Ma for minerals in the saprolite. The investigated areas of this study include (from north to south) the Pan de Azúcar National Park (~26°S), Santa Gracia Nature Reserve (~30°S), La Campana National Park (~33°S), and Nahuelbuta National Park (~38°S). Site selection for these areas was based on the minimal tectonic and lithologic differences, and their position along the climate (arid to humid) gradient. We thus followed the “climosequence” approach (e.g. Egli et al., 2003). In each of these four study sites, four regolith profiles were excavated on different slope positions. In this paper, we (1) describe the architecture of the weathering zone; and quantify (2) the degree and rate of rock weathering, thus the. The Earth's surface, where rock, the atmosphere, the hydrosphere, and the biosphere interact, is often referred to as the Critical Zone (Anderson et al., 2007). Soils, mantling 95% of the terrestrial Earth's surface, are the top layer of this zone. Soil is made “from below” by weathering, the breakdown of rocks and minerals (Riebe et al., 2017), and “from above” by the addition of organic matter and atmospheric inputs (Chorover et al., 2007). Weathering turns fresh rock into a loosely consolidated “regolith” (comprising both mobile soil at the top and weathered rock beneath it). The inorganic chemical process of weathering involves the dissolution of primary minerals and their partitioning into solutes and secondary minerals (e.g. amorphous and crystalline oxides, clays). These abiotic weathering products, as well as organic compounds, are exported from catchments via erosion and rivers (Gaillardet et al., 1999; Hilton, 2017). The Critical Zone thus plays an important role in the cycling of mineral nutrients across the Earth's surface and the mechanisms of weathering are key. Numerous studies have shown that soil physico-chemical parameters, such as soil organic matter, soil acidity, exchangeable ions, extractable oxides, and volumetric strain (ε) systematically change with temperature and precipitation (e.g. Bardelli et al., 2017; Bojko and Kabala, 2017; Khomo et al., 2013; Khomo et al., 2011; Khormali et al., 2012). Egli et al. (2003) have shown that the amount of smectite and the degree of weathering in Alpine soils increase with precipitation. Moreover, the degree of plagioclase weathering seems to increase exponentially with temperature and linearly with precipitation (Dere et al., 2013). Still, from studies that make use of climatic gradients no clear relationship between climate and denudation rates has yet emerged. Large variations in denudation rates in any given climate indicate that a potential climatic imprint might have been severely overprinted by factors such as uplift, physical and chemical bedrock characteristics, and biota (e.g. Dixon et al., 2009; Egli et al., 2004; Ferrier et al., 2012; Riebe et al., 2004; Schaller et al., 2018; Starke et al., 2017). In this context, Owen et al. (2011) postulated that a mean annual precipitation threshold exists below which bedrock denudation is precipitation-dependent and above which soil production from bedrock is controlled by complex feedback mechanisms between tectonics, temperature, and biota. One of the key players in weathering processes is biota, which is receiving increasing scientific attention in this context (Amundson et al., 2015b; Brantley et al., 2011; Egli et al., 2014; Hahm et al., 2014). A broad spectrum of biota (plants, animals, and microorganisms) interacts with the Earth's surface, although the direction and magnitude of the effects biota has on Earth-surface processes, and conversely the Earth surface effects on biota, are still not well understood (e.g. Wilcke et al., 2017). For example, little is known about microorganisms that live beneath soil, even though more than one third of the microbial biomass is concentrated in regolith depths deeper than 25 cm (Fierer 184.
(3) Catena 170 (2018) 183–203. R.A. Oeser et al.. release of mineral-derived nutrients to the terrestrial ecosystems; (3) denudation rates from cosmogenic nuclides; and (4) microbial abundances of bacteria and archaea in the saprolite. We discuss these results on (1) a continental scale, on which the observed geochemical signatures are mainly caused by large scale variations in precipitation and vegetation cover, on (2) a hillslope scale, where influences on weathering and microbial abundances are caused by differing solar irradiation on N- and S-facing slopes, and on (3) a regolith profile scale. Within the scope of the “EarthShape” research program, we thus contribute towards addressing the question: how does the gradient in precipitation and vegetation cover influence weathering, microbial abundances, and mineral nutrient supply to ecosystems? In a companion paper (Bernhard et al., 2018) the site-specific characterization of the soil and its properties are described. With these two papers, we also provide the basic Critical Zone background data that will serve as basis for future studies employing other field and laboratory techniques to decipher the role of biota along this transect. 2. Study area 2.1. Geological and climatic conditions Central Chile (~25–40°S) is built of three structural units (from West to East): The Coastal Cordillera, the Central Depression, and the Pre-Western Cordillera of the Andes. Of these, the Coastal Cordillera is the oldest and westernmost trench-parallel morpho-structural unit. The Coastal Cordillera is composed of the remnants of a Late Paleozoic to Mesozoic magmatic arc and Paleozoic metamorphic rocks (Charrier et al., 2007; Hervé et al., 2007; Hervé et al., 1988; Pankhurst and Hervé, 2007; Parada et al., 1988; Vázquez et al., 2016). The northern Coastal Cordillera (~21–27°S) is suggested to have experienced exhumation between ~118–152 Ma and 60–80 Ma prior to Andean mountain building (Juez-Larré et al., 2010). Following this (from ~40 Ma to present), deformation migrated to the east of the Coastal Cordillera and led to the onset of Andes mountain building and plateau formation (Barnes and Ehlers, 2009). Less well known is the tectonic history of the Coastal Cordillera south of 27°S, although it is commonly assumed to be similar to the northern Cordillera. More recently, ongoing and minor amounts of Quaternary neotectonic activity have been documented in the northern Coastal Cordillera (Riquelme et al., 2003; Starke et al., 2017). The EarthShape study area features a vegetation gradient controlled by climate, ranging over 1300 km (from 26°06′S to 37°48′S), spanning from arid, via Mediterranean, to humid-temperate climate conditions. Within this area four different sites were chosen, all located within 80 km of the Pacific coast and within plutonic rocks of the Chilean Coastal Cordillera (Fig. 1). The basement at those four sites is mainly composed of: (1) monzo- to syenogranitic intrusions (Pan de Azúcar, Triassic age; Parada et al., 2007), (2) pyroxene and hornblende-bearing diorites and monzodiorites (Santa Gracia granite, 98–89 Ma; Moscoso et al., 1982), and (3), (4) tonalites and granodiorites (Nahuelbuta complex, 294 Ma; Parada et al., 2007 and the Illapel Plutonic Complex in La Campana, 130–90 Ma; Parada et al., 1999). The 30-year mean annual precipitation (MAP) at the study sites increases from north to south, from 10 mm yr−1 in Pan de Azúcar, 89 mm yr−1 in Santa Gracia, 436 mm yr−1 in La Campana, to 1084 mm yr−1 in Nahuelbuta, respectively (Fig. 2a; Ministerio de Obras Públicas, 2017). The mean annual air temperatures (MAT) vary between 18.1 °C in the northernmost site and 14.1 °C in the southernmost site (Fig. 2b; Ministerio de Obras Públicas, 2017). The northernmost site, Pan de Azúcar, is located at the southern border of the Atacama Desert. The aridity of the Atacama Desert has developed in the Miocene (Clarke, 2006; Dunai et al., 2005), and the hyperaridity in the early Quaternary (Jungers et al., 2013). The sites were unglaciated during the last glacial maximum (Hulton et al., 2002) and are situated in national parks and nature reserves, where anthropogenic influence is minimized. Fig. 1. Intrusion age and spatial extension of the granitoid rocks in the four primary EarthShape study sites (open squares) along the Chilean Coastal Cordillera from north to south: Pan de Azúcar, Santa Gracia, La Campana, and Nahuelbuta. (Map modified from SERNAGEOMIN, 2003.). compared to the surrounding areas. However, occasional grazing by cows (La Campana; Rundel and Weisser, 1975) and goats (Santa Gracia; Armesto et al., 2007; Bahre, 1979) within the protected areas have been reported by local authorities. 2.2. Critical Zone description In each study site, three south-facing (S-facing) profiles at top-, mid-, and toe-slope position and, as an initial cross-check for aspect, a single north-facing (N-facing) mid-slope regolith profile were investigated (Figs. 3–6; Table S1). Here, we describe the soil as consisting of the O, A, and B horizon, underlain by a C horizon consisting of saprolite (bedrock that was weathered in situ). In this paper, we call the entire zone above unweathered bedrock “regolith” (Scott and Pain, 2008), which thus comprises saprolite and soil. The vascular flora of each study site was 185.
(4) Catena 170 (2018) 183–203. R.A. Oeser et al.. Fig. 2. Compilation of precipitation (A) and temperature (B) data from climate stations in vicinity of the respective EarthShape study sites (Ministerio de Obras Públicas, 2017). Bars on the very right-hand side of both panels show climate data from April 16 to April 17 at the EarthShape climate stations within the study sites (Ehlers et al., 2017).. Fig. 3. Photographs of the S-facing mid slope regolith profile (AZPED 50) in Parque Nacional Pan de Azúcar (AZ) including horizon boundaries (white dashed line), a schematic depth profile (a), a cross section through the S-facing catena and adjacent N-facing regolith profile (b). The regolith in AZ developed on a coarse-grained, feldspar-rich granite. Its cover lacks fine-grained particles which are removed by wind (c). Fractures are either filled with clay-sized particles of unknown composition or gypsum and carbonate (d).. granite gruss of a few cm in thickness with a grayish to yellow color (Fig. 3c). At the very top of this A horizon, where silt- and clay-sized particles are absent, angular fragments occur in size of up to 1 cm. Below the top layer, a B horizon of reddish-brown color is found. The size of fragments increases downwards. The transition to the saprolite of the C horizon occurs at 20 to 25 cm depth and does neither depend on slope position nor aspect. The saprolite has a reddish-brown color and is characterized by coarse-grained material (Fig. 3). The entire regolith is jointed, with joint width and joint spacing augmenting with depth. Joints are either. classified after Marticorena and Quezada (1985) and Luebert and Pliscoff (2006). 2.2.1. Pan de Azúcar The S-facing regolith profiles in Pan de Azúcar national park (AZ) are located on a slope of 9 m length. The N-facing slope is located at a distance of 30 m from the S-facing slope. The elevations range from 328 to 343 m above sea level (a.s.l.) with hillslope angles between 25 and 40° (Fig. 3b; Table S1). The profiles' surfaces are comprised of fine grained, quartz-rich 186.
(5) Catena 170 (2018) 183–203. R.A. Oeser et al.. Fig. 4. Photographs of the S-facing mid slope pit (SGPED 40) in Reserva Natural Santa Gracia (SG) including horizon boundaries (white dashed line), a profile sketch, and a cross section through the S-facing catena and adjacent N-facing pit. The catena developed on a medium grain size granitic substrate. The regoliths' upper layer is characterized by bioturbation and a high root density (a). At the pits' base, two major joint sets are preserved. Here, roots penetrate the fractures and weather the adjacent rock face (b).. Fig. 5. Photographs of the S-facing mid slope pit (LCPED 20) in Parque Nacional La Campana (LC) including horizon boundaries (white dashed line), a profile sketch, and a cross section through the S-facing catena and adjacent N-facing pit. Both coarse- and fine-grained granodiorite comprise the substrate of the regolith (boundary shown by the red dashed line) (a); scale bar size: 10 cm. Mid slope pits (S- and N-facing) are affected by mass movement downslope, leading to an accumulation of angular fragments in the soil columns (b). (For interpretation of the references to color in this figure legend, the reader is referred to the web version of this article.) 187.
(6) Catena 170 (2018) 183–203. R.A. Oeser et al.. Fig. 6. Photographs of the S-facing mid slope pit (NAPED 20) in Parque Nacional Nahuelbuta (NA) including horizon boundaries (white dashed line), a profile sketch, and a cross section through the S-facing catena and adjacent N-facing pit. Very high organic matter content, characterize the upper horizons of the four pits (a). Fragments are absent in the regoliths' A-Horizon; they occur in the B-Horizon in the form of weathered granodiorite (b). Rare fragments of mafic composition are also found.. filled with fine-grained material of unknown composition or with visible calcite and gypsum crystals (Fig. 3d). At the base of the regolith profiles, the width of the joints decreases; the joints pinch out to the bottom. Unweathered parent material was not observed. Dead root material has been found in the profiles only rarely. The area belongs to the vegetation formation “Mediterranean coastal desert scrub of Euphorbia lactiflua and Eulychnia saint-pieana” (Luebert and Pliscoff, 2006). The vegetation cover is very low (< 10%) and is represented only by small shrubs, geophytes and annual plants (Armesto et al., 1993), which are present in more abundance in small ravines. On the sampled S-facing slope, a few individuals of Tetragonia maritima, Nolana mollis, Perityle sp. and Stipa plumosa can be found. On the N-facing slope, single individuals of N. mollis and Cristaria integerrima are present. From these species, only T. maritima, N. mollis and C. integerrima maintain their vegetative structures during dry years.. fragments at the horizon's base. Fine roots pervade this horizon. The extent of the soil horizon (comprised of A and B horizon) increases from the top- to toe-slope regolith profiles of the S-facing slope from 30 to 55 cm (Table S1). The depth of the soil horizon in the regolith profile on the N-facing slope (SGPED70) is thinner (35 cm) and its brownish color less dominant. The orange-brownish saprolite is dominated by greenish-black weathered biotite and hornblende and reddish feldspars, respectively. Fragments are up to 1 cm in size and are surrounded by fine-grained material and fine roots. Joint spacing in the weathered granodiorite is approximately 30 cm. Roots (average diameter of 1 mm) penetrate the fractures and weather the adjacent rock face (Fig. 4d). In contrast to the S-facing regolith profiles, the weathered bedrock in the N-facing regolith profile exhibits a white and gray mottled pattern at depth, with only a few orange spots visible. The vegetation belongs to the “Interior Mediterranean desert scrub of Heliotropium stenophyllum and Flourensia thurifera” formation (Luebert and Pliscoff, 2006). The original vegetation has been highly disturbed and the current shrubby vegetation is influenced by livestock grazing (mostly goats; Bahre, 1979). For these reasons, combined with the semi-arid climate, vegetation cover is low, especially in the herbaceous layer. The shrub layer is sparse (∼30–40% cover) and is dominated by Proustia cuneifolia and Senna cumingii on the sampled Sfacing slope, and by Cordia decandra and Adesmia sp. on the N-facing slope. On the latter slope, the cactus Cumulopuntia sphaerica is very abundant and the columnar cactus Eulychnia acida is present with individuals of > 2 m height (i.e. cardonal vegetation community; Bahre, 1979). In the area, some individuals of the shrubs Balbisia peduncularis, Baccharis paniculata and Bulnesia chilensis also occur.. 2.2.2. Santa Gracia In the natural reserve of Santa Gracia (SG) the three S-facing regolith profiles are located on a 153-m long slope. The N-facing regolith profile is located at a distance of 160 m from the S-facing mid-slope profile. The elevations of these four profiles range from 628 to 718 m a.s.l. with the two mid-slope profiles at approximately 690 m a.s.l. Slope angle is slightly lower than in Pan de Azúcar and varies between 15 and 25° at the mid-slope regolith profiles (Fig. 4b; Table S1). The surface of the regolith profiles in Santa Gracia is composed of sub-angular, coarse sand-sized quartz and granodiorite fragments. This brownish A horizon is made of grussified granodioritic, silt to fine sandsized particles, supporting fragments of up to 2 mm in diameter. Roots are abundant in this horizon and reach diameters of up to 1 cm (Fig. 4). This horizon is underlain by a brownish white-spotted transitional (B) horizon. Within this horizon, the proportion of fragments increases with their size, resulting in a fine-grained matrix that is supported by coarse. 2.2.3. La Campana The regolith profiles in La Campana national park (LC) are located on 188.
(7) Catena 170 (2018) 183–203. R.A. Oeser et al.. abundance and size is increasing and the horizons' color is lighter. Unlike in the upper two S-facing regolith profiles, where the transition from soil to saprolite is gradual, the S-facing toe slope and the N-facing mid-slope profile are characterized by a thin soil-saprolite transition zone. At this transition, highly weathered mafic rock (NAPED30) and granodioritic core stones (NAPED40) appear, respectively. The saprolite is coarse-grained and disaggregates readily. Its color varies from dark gray to whitish. The dark color is attributed to weathered bedrock of mafic composition and the whitish color to weathered rock with an increased plagioclase abundance. Some reddish intercalations within the saprolite follow fluid pathways along formerly open fractures and pathways once occupied by roots. The dominant vegetation belongs to the “Coastal temperate forest of Araucaria araucana” formation (Luebert and Pliscoff, 2006). Here also, vegetation cover is 100%. The general area also supports tall evergreen mixed forest dominated by the broadleaved Nothofagus dombeyi and the iconic conifer A. araucana, but around the soil pits the forest is more open and dominated by the lower-stature deciduous trees Nothofagus obliqua and Nothofagus antarctica, together with the tall A. araucana. The dominant shrub species is Gaultheria mucronata, but other species like Azara microphylla, Baccharis sp., Ribes magellanicum and Berberis montana are also present. At the herbaceous level, Stipa sp. and Mutisia decurrens are very abundant. However, herbaceous diversity is very high and is also represented by e.g. Chusquea culeou, Bromus sp., Viola maculata and Adenocaulon chilense. Around the regolith profile on the Nfacing slope, N. obliqua and N. antarctica are the most abundant species in the canopy and the understory is dominated by G. mucronata and Stipa sp. Along the catena on the S-facing slope, the canopy is less dense and A. araucana is the most abundant species, followed by N. antarctica, while in the understory C. culeou is very common. Lichens of the genus Usnea abundantly cover most of the tree trunks and branches.. a S-facing slope of 152 m length where the S-facing and the N-facing mid-slope regolith profiles are separated by 173 m. The elevations of the four profiles range from 706 to 750 m a.s.l. with the two mid-slope profiles being at 730 and 734 m a.s.l., respectively. The mean slope angle at the mid-slope profiles is around 18° (Fig. 5b; Table S1). The regolith at this site is covered by an O horizon of a few centimeters thickness, composed of litter and tree-debris mixed with granitic gruss of sand size. The dark-brown A horizon on the S-facing catena has a thickness of up to 40 cm. In contrast, the N-facing regolith profile's A horizon is of grayish-brown color and measures only 12 cm. It is composed of fine-sand to silt-sized particles, hosting some granodioritic fragments of up to 3 mm in diameter and is highly permeated by roots of various sizes. The base of the soil horizon is characterized by a brown to orange-brown transitional (B) horizon. As the matrix is coarsening downwards, the number of fragments increases and the horizon shifts from a matrix- to a clast-supported one. The final transition from soil to saprolite occurs at a depth of 60 cm within 3 to 5 cm. At the N-facing slope, this transition occurs at a shallower depth. The saprolite develops from (at least) two distinct granodiorite types: a coarse-grained and a fine-grained one (Fig. 5c). In both cases, the granodiorite fabric is still visible and the mineral composition (plagioclase ≫ quartz ≫ K-feldspar & biotite) is similar. Throughout the saprolite, fine roots are common and are most abundant within fractures. The vegetation of La Campana belongs to the “Coastal Mediterranean sclerophyllous forest of Lithraea caustica and Cryptocarya alba” formation (Luebert and Pliscoff, 2006) and includes examples of all the major biotic communities of sclerophyllous forest of central Chile (Gajardo, 1994; Rundel and Weisser, 1975). Vegetation cover is high, with almost 100% ground cover. The forest canopy is dominated by the evergreen sclerophyllous trees L. caustica, C. alba, Quillaja saponaria, and in lower abundance Kageneckia oblonga. The medium shrub layer is dense and dominated by Colliguaja odorifera, Aristeguietia salvia and Retanilla trinervia, and in less abundance Podanthus mitiqui. The herbaceous layer presents a high cover and diversity and is especially rich in annual species. The most abundant species are Geranium robertianum, Stellaria media and the fern Adiantum chilense. Along the Sfacing catena, the trees L. caustica and C. odorifera are the most abundant and dominant species. In less abundance, P. mitiqui and A. salvia are found in the shrub layer, while the herbaceous layer is dominated by Alstroemeria sp., G. robertianum, S. media, Solenomelus pedunculatus and A. chilense. Near the N-facing slope profile, high vegetation is less abundant and less rich in species. The canopy is strongly dominated by L. caustica, accompanied by some individuals of Jubaea chilensis. The most abundant shrub is R. trinervia, followed by A. salvia and C. odorifera. Poaceae spp. and Sonchus oleraceus dominate the herbaceous layer, where climbing species like Tropaeolum sp. and Dioscorea sp. also occur.. 3. Material and analytical methods 3.1. Sampling Regolith samples were collected from bottom to top (if applicable) in a continuous sequence of depth increments, amounting to a thickness of 5 cm (uppermost two samples), 10 cm (3rd sample from top), and 20 cm (4th sample from top and below), respectively. About 1 kg of material was taken per sample. In addition, saprolite samples (50 ml) were taken under sterile conditions for DNA-based analyses of microbial abundances. These latter samples were stored and transported under frozen conditions to Germany. Underlying unweathered bedrock has not been reached in the regolith profiles of this study and the depth to bedrock remains unknown. However, a set of 20 bedrock samples (4 in Pan de Azúcar, 8 in Santa Gracia, 5 in La Campana and 3 in Nahuelbuta, respectively) was thus obtained from nearby outcrops. All sample metadata are already available on a public server using unique sample identifiers in form of the new “International Geo Sample Number” (IGSN).. 2.2.4. Nahuelbuta The regolith profiles in the Nahuelbuta national park (NA) are located on a 136-m long S-facing slope where the S-facing and the N-facing mid-slope regolith profiles are separated by 145 m. The elevations of these four profiles range from 1219 to 1248 m a.s.l., being the highest among the four study sites. Slope angles of around 14° at the mid-slope profiles are the smallest of the study area (Fig. 6b; Table S1). The regolith at Nahuelbuta is covered by a 2 to 5 cm thick O horizon, almost entirely composed of roots, leaves, and moss. The A horizon is characterized by a large number of roots (various sizes, up to 3 cm in diameter; Fig. 6) and a brown to black color. This horizon is mainly composed of silt-sized particles, forming nodular soil aggregates, giving this layer a granular texture. In the upper part of the A horizon, up to 1 mm large quartz grains are embedded and at the base, larger granodioritic fragments occur. The transitional (B) horizon increases in thickness from the top to the toe slope regolith profile on the S-facing catena. Its matrix is made of fine-sand sized particles, hosting sub-angular granodioritic fragments. As depth increases, fragment. 3.2. Bedrock and regolith geochemistry Major and trace element concentration of bedrock and regolith samples were determined using the PANalytical AXIOS advanced X-Ray Fluorescence spectrometer at the GFZ German Research Centre for Geosciences, Section “Inorganic and Isotope Geochemistry”. The device is equipped with a Rh anode X-ray tube, which was operated at an excitation voltage of 25 to 60 kV and currents between 60 and 160 mA. Measuring times for major elements varied between 10 and 20 s, for trace elements it was set to 40 s. Prior to measurement, each sample was milled in an agate mortar and sieved through a 62 μm gauze sieve. Powdered samples were dried at 105 °C for 24 h before glass bead preparation. Glass beads were made 189.
(8) Catena 170 (2018) 183–203. R.A. Oeser et al.. ACC GCG GCT GCT GG–3′) (Muyzer et al., 1993), and the archaeal primer pair 340F (5′–CCC TAC GGG GYG CAS CAG–3′) and 1000R (5′–GGC CAT GCA CYW CYT CTC–3′) (Gantner et al., 2011). The qPCR assay was carried out in a total reaction volume of 20 μl using the KAPA SYBR® FAST qPCR Kit Master Mix (2X) Universal (Kapa Biosystems, Sigma-Aldrich, Germany) in accordance with the manufacturer's recommendations. Quantification was performed in the CFX96 Connect™ Real-Time System (Bio-Rad Laboratories, CA, USA) with the following cycling program for bacterial 16S rRNA genes (and archaeal 16S rRNA genes): initial denaturation at 95 °C for 3 min, followed by 40 (45) cycles of denaturation at 95 °C for 3 s, annealing at 60 °C (57 °C) for 20 s, elongation at 72 °C for 30 s. Fluorescence was measured at 80 °C. The melting curve was recorded by rising temperature from 65 to 95 °C. Due to preliminary experiments, DNA extracts were used in 1:10 for archaea and 1:100 dilutions for bacteria to avoid putative inhibitions of co-extracted substrates. Every qPCR run included blanks, calibration standards in triplicates and saprolite samples in quadruplicates. The reaction efficiency ranged between 92.0 and 98.6%. Data analysis was carried out using the CFX Manager™ Software (Bio-Rad Laboratories, CA, USA).. with 1 g of sample material, 6 g of dilithiumtetraborate, and up to 1 g of ammonium nitrate, brought to complete fusion in a heating system in six steps of up to 8-minute intervals. The intervals were adjusted depending on the concentration of organic compounds. The loss on ignition for each sample was determined by weighing the glass beads and the platinum crucibles used for glass bead preparation before and after fusion. XRF data of regolith samples have been recalculated to a volatile free basis using.. [X ]recalc =. [Xmeasured ] , SUMmeasured − (LOImeasured − LOIbedrock ). (1). where [X]recalc and [Xmeasured] refers to the recalculated and measured concentration of an element, SUMmeasured to the sum of all elements analyzed, and LOImeasured to the samples' loss on ignition, respectively. LOIbedrock is the average loss on ignition of associated bedrock samples. Pedogenic oxides of Iron (Fe), Aluminum (Al), Manganese (Mn), and Silicon (Si) were determined at University Bern with the dithionite-citrate method as described by Mehra and Jackson (1958). Active oxides of the same elements were examined as ammonium-oxalate extractable compounds (Schwertmann, 1964; modified after Tamm, 1922). Oxides associated with soil organic matter (SOM) were extracted with a 0.1 M pyrophosphate reagent (Na2P2O7 × 10 H2O) at pH 10. Elements have been analyzed on an ICP-MS (7700x Agilent Technologies). Mineral assemblages and approximate mineral abundances in representative bedrock samples were estimated at GFZ Potsdam using thin section microscopy and standard point counting techniques. 3.3. Cosmogenic. 10. 4. Calculation of weathering indicators and denudation rates To quantify the element fluxes as well as the weathering intensities that emerge when the bedrocks' elements are solubilized in percolating fluids and new elements are introduced from the atmosphere, various indices and coefficients have been developed. The common denominator of all these approaches is the identification of an element considered to be immobile during weathering. Furthermore, cosmogenic nuclide concentration can be converted into rates of mass removal. In the following, we outline these quantification approaches.. Be in quartz. For determination of the in situ-produced 10Be concentration in quartz, the saprolite samples were washed, dried, and sieved to a fraction of 0.25 to 2.0 mm at the University of Tübingen, Department of Geosciences, Germany. The 1.0 to 2.0 mm fraction was crushed to 0.25 to 1.0 mm. After magnetic separation and treatment with HCl, the sample material was leached with HF/HNO3. The remaining non-quartz minerals were dissolved and meteoric 10Be was removed from quartz grains by HF etching. A total of 15 to 35 g of cleaned quartz was spiked with ∼0.3 mg 9Be and dissolved with concentrated HF. Beryllium was separated from other elements with column chromatography and precipitation techniques after von Blanckenburg et al. (1996). After oxidation BeO was mixed with Nb powder for measurement of 10Be/9Be ratios at the accelerator mass spectrometer (AMS) facility in Cologne. Uncertainty on measured ratios is reported as 1σ. Calculated sample concentrations were corrected for a combined mass spectrometry and chemistry blank of 3.4 × 10⁴ atoms.. 4.1. Chemical index of alteration (CIA), chemical depletion fraction (CDF), mass transfer coefficient (τ), and volumetric strain (ε) To assess the relative degree of chemical weathering, we used the CIA (Eq. (2)) developed by Nesbitt and Young (1982). In this approach, aluminum is assumed to be an immobile element and the degree of weathering is traced by comparing the aluminum content of a sample with this of the readily soluble cations calcium, sodium and potassium in silicate minerals.. CIA =. Al2 O3 × 100. Al2 O3 + CaO + Na2 O + K2 O. (2). The CIA in unweathered granitoid rock has values of 45 to 55. The degree of weathering has to be evaluated from the CIA in weathered material relative to its respective unweathered precursor. As weathering proceeds the CIA evolves to a maximum value of 100 (Nesbitt and Young, 1982). To calculate the relative mass loss caused by chemical weathering of the parent rock we used the chemical depletion fraction (CDF; Riebe et al., 2003):. 3.4. DNA extraction and quantification of 16S rRNA gene copies Total genomic DNA was extracted at GFZ Potsdam from saprolite samples which were collected under sterile conditions. The PowerSoil® DNA Isolation Kit was used for soils from La Campana, Santa Gracia, and Nahuelbuta with a maximum sample amount of 0.25 g each. Samples from Pan de Azúcar were treated with the PowerMax® Soil DNA Isolation Kit (both from MoBio Laboratories, CA, USA). Before processing, saprolite samples from Pan de Azúcar and Santa Gracia were crushed by hand. Following this, DNA was extracted in triplicates following the manufacturer's protocol with one exception; DNA elution was done with PCR-grade water. Final concentrations were measured with a NanoPhotometer® (P360, Implen GmbH, Germany). Purity was controlled by the optical density values of OD260/OD280 and OD260/ OD230. Gene copy numbers of universal bacteria and universal archaea were determined by quantitative polymerase chain reaction (qPCR). 16S rRNA genes were amplified by using the bacterial primer pair Eub341F (5′–CCT ACG GGA GGC AGC AG–3′) and Eub534R (5′–ATT. CDF = 1 −. [Xi ]parent [Xi ]weathered. CDF = 1 −. [Xi]parent [Xi]weathered. ,. (3). where [Xi]weathered and [Xi]parent represent the concentration of the immobile element Xi in weathered regolith and unweathered parent bedrock, respectively. If no element loss has occurred during the transition from parent rock to regolith, the CDF is zero. If weathering has proceeded to completion (i.e. only quartz, clay minerals, and secondary oxides remain), the CDF attains a maximum value of ca. 0.5 in granitic rock. To estimate the relative loss of individual elements (X), we used the mass transfer coefficient τ (tau; Anderson et al., 2002; Brimhall and Dietrich, 1987). It is important to note that the ratio of X in weathered material to X in unweathered parent rock depends on both the loss of X 190.
(9) Catena 170 (2018) 183–203. R.A. Oeser et al.. denudation rate calculation are 3.92 atoms g−1 yr−1 (Borchers et al., 2016), 0.012 atoms g−1 yr−1, and 0.039 atoms g−1 yr−1, respectively (Braucher et al., 2011). SLHL production rates were scaled to sample altitude and latitude with the online tool of Marrero et al. (2016) using the scaling procedure based on Lifton et al. (2014). Shielding factors for topography and slope are 1.0. No shielding by snow has been taken into account. However, in order to correct for the influence of increasing vegetation cover on the production rate, shielding by vegetation of 2.3% for acadian/boreal forest and 7.3% for rain forest have been applied in La Campana and Nahuelbuta, respectively (Plug et al., 2007). Shielding factors due to sample overburden (depth and soil density) were calculated for nucleonic, stopped, and fast muonic production rates. The adsorption lengths used were 157, 1500, and 4320 g cm−2, respectively (Braucher et al., 2011). Denudation rates D [t km−2 yr−1] were calculated based on the blank-corrected nuclide concentrations [atoms g−1], the 10Be decay constant λ = 4.99 × 10⁻⁷ yr−1 (Chmeleff et al., 2010; Korschinek et al., 2010), and the respective production rates P [atoms g−1 yr−1] at sample depths and adsorption lengths Λ [g cm−2] for each production mechanism using Eq. (7):. and the loss of other elements besides X. To take the loss of other elements into account, the calculation of τ involves concentrations of an immobile element Xi in parent material relative to weathered material:. τX =. [Xi ]parent [X ]weathered × − 1. [X ]parent [Xi ]weathered. (4). If τ = 0 no loss of X has occurred compared relative to the parent material. τ < 0 denotes relative elemental loss, τ > 0 denotes gain, respectively. The conversion of primary minerals into secondary phases and solutes is usually accompanied by a change in density ρ and volume V. A measure of this change and an estimate of deformation is the volumetric strain ε (Brimhall and Dietrich, 1987):. ε=. ρparent ρweathered. ×. [Xi ]parent [Xi ]weathered. − 1.. [Xi]parent [Xi]weathered. (5). Positive values of ε indicate dilation, negative ones collapse of a profile. Values near zero are evidence of isovolumetric weathering.. P D = ⎛ 10 − λ⎞ Λ [ ⎝ Be] ⎠. 4.2. Denudation rates based on cosmogenic nuclides and immobile elements. ⎜. At each primary study site, the total denudation rate D (in t km−2 yr−1) was determined for the mid-slope regolith profile of the Sfacing and N-facing catena (AZPED50 & 21, SGPED40 & 70, LCPED20 & 40, and NAPED20 & 40; Table S6). To ensure that the calculated D reflects that of the regolith profiles and is not influenced by mixing of the surface layer with material from above (e.g. Heimsath et al., 1997), mobile material from the soil layer was avoided. Thus, we determined the in situ-produced 10Be concentrations in quartz from material sampled from the top of the physically immobile saprolite just below the mobile soil layer (see Schaller et al., 2018). D measures the total mass loss within the adsorption depth of cosmic rays (ca. 1 m; e.g. Dixon et al., 2009; Riebe and Granger, 2013; Riebe et al., 2001), which entails chemical loss (weathering, W) and physical loss (erosion, E):. D=E+W. ⎟. (7). The weathering rate can be calculated from D by using the CDF, which is a measure of the fraction of the total denudation that is accounted for by chemical weathering or also the ratio of chemical weathering to total denudation W/D. W is given by:. W = D ·CDF .. (8). We determined W with the CDF averaged over all soil samples, thus calculating a maximum chemical loss over the entire regolith profile. 5. Results 5.1. Chemical and mineralogical bedrock composition and classification. (6). Major and selected trace element concentrations and density of local bedrock for each of the study sites are listed in Table S2. The bedrock in Pan de Azúcar and La Campana is characterized by SiO2 > 71 wt% and a high Na2O and K2O content (∼7 wt%; Fig. 7a). Apart from Mg, Ca, and Ba, major and trace elements show uniform concentrations (i.e. standard deviations below 15%). In contrast, bedrock samples from Santa Gracia and Nahuelbuta show extensive compositional. If mass loss by weathering occurs beneath the cosmic ray adsorption depth, as it is likely in the saprolite that is weathered at great depth in the Chilean Coastal Cordillera (Vázquez et al., 2016), then the 10Be concentration does not account for this loss and D is a minimum estimate (Riebe and Granger, 2013). Nucleonic, stopped muonic, and fast muonic production rates P at sea level and high latitude (SLHL) used for. Fig. 7. Classification diagrams for siliceous igneous and volcanic rocks. (a) Total alkali versus silica diagram introduced by Le Bas et al. (1986). (b) Q-AnOr diagram of Streckeisen and LeMaitre (1979), where the mineral modes were determined from XRF analyses by the CIPW norm calculation. Field association as follows: a Alkali-feldspar granite; b - Syenogranite; c - Monzogranite; d - Alkali-feldspar Quartz Syenite; e - Quartz Syenite; f - Quartz Monzonite; g - Quartz Monzodiorite; h Syenite; i - Monzonite; j - Monzogabbro; k – Diorite. 191.
(10) Catena 170 (2018) 183–203. R.A. Oeser et al.. schemes of igneous and volcanic rocks introduced by Le Bas et al. (1986; Fig. 7a) and Streckeisen and LeMaitre (1979; Fig. 7b), the bedrock samples from Pan de Azúcar, La Campana, and Nahuelbuta are granites, granodiorites, and tonalites, respectively. Santa Gracia bedrock yield CIPW-based mineral modes for plagioclase- (An + Ab) of 67 vol%, pyroxenes (14 vol%), quartz (9 vol%), and K-feldspar (5 vol%) rock. Both schemes classify these rocks as gabbros and diorites – igneous rocks with a low quartz content.. heterogeneities. In Santa Gracia and Nahuelbuta, the standard deviation of the major and trace element concentrations is 33 and 50%, respectively. At Santa Gracia, the SiO2 concentration is by far the lowest (50 wt% < SiO2 < 64 wt%) whereas the MgO concentration is the highest (0.91 wt% < MgO < 5 wt%) of all analyzed bedrock samples. The major element bedrock composition at Nahuelbuta is similar to that of Santa Gracia with the exception of SiO2 concentrations that are 65–70 wt%. Modal mineral abundances based on CIPW norm calculation (Johannsen, 1937) of average bedrock composition for each study site are given in Table S3. With the exception of Santa Gracia, bedrock composition includes quartz (≥35 vol%) and feldspar-rich (Pl ≥ 35 vol %; Kfs ≥ 17 vol%) granitoid rocks. According to the two classification. 5.2. Regolith chemistry and weathering patterns Major element concentrations of the four regolith profiles at each site are shown in Table S4 and Fig. 8. The principle differences in the. Fig. 8. Depth-dependent major element composition (corrected for LOI following Eq. (1)) of the four primary EarthShape study sites (regolith profile names indicated above). Differences between sites are attributed to large-scale bedrock variations and differences within the single catenae to small-scale lateral and vertical bedrock heterogeneities. Vertical variations within a profile (i.e. LCPED30, NAPED20, NAPED40) reflect a change in substrate. Dashed lines indicate the soil – saprolite boundary. 192.
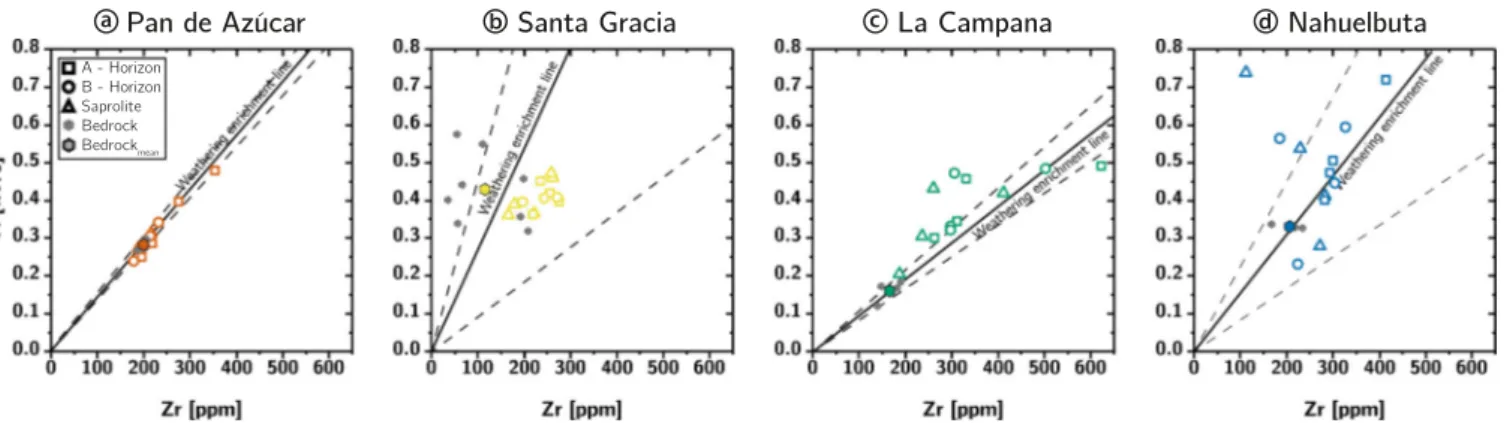
(11) Catena 170 (2018) 183–203. R.A. Oeser et al.. Fig. 9. Weathering trends for regolith profiles in Pan de Azúcar (red), Santa Gracia (yellow), La Campana (green), and Nahuelbuta (blue) in the ternary space of ACN-K (a) and A-CNK-FM (b) as introduced by Nesbitt and Young (1982) (molar proportions). Note that (a) corresponds to the CIA which is 100 at pure Al2O3, and 50 at connecting line between Pl and Kfs. The gray diamonds represent idealized mineral compositions: Bt - biotite; Cpx - clinopyroxene; Fsp - feldspar; Gbs - gibbsite; Hbl - hornblende; Ilt -illite; Kfs - K-feldspar; Kln - kaolinite; Ms. - muscovite; Pl - plagioclase; Sme – smectite. (For interpretation of the references to color in this figure legend, the reader is referred to the web version of this article.). overall compositions between the sites reflect the differences in bedrock composition. The compositional heterogeneity is small in Pan de Azúcar, Santa Gracia and La Campana within the saprolite. Only at Nahuelbuta the saprolite shows a high level of compositional heterogeneity between and within profiles, which is due to initial bedrock heterogeneity. Importantly, no gradients towards the base of the profiles are observed, implying that the weathering front has not been reached in any of these profiles. A and B horizon samples have a higher degree of heterogeneity, with some showing an increase in P and Ca concentrations. The compositional features translate into the following patterns of weathering intensity (CIA, Fig. 9). CIA of the EarthShape bedrock samples lie within the typical range of granitoid rocks (44–55; Nesbitt and Young, 1982; Table S5). The CIA at Pan de Azúcar ranges from a bedrock average value of 55 ± 1 to a value as low as 32 in soil and saprolite (Table S5). This trend is opposite to that expected from weathering and is presumably due to atmospheric additions (see also Bernhard et al., 2018). The CIA at Santa Gracia ranges from a bedrock value of 43 ± 4 to 52 in regolith, which is due to the reaction of plagioclase to clay (Fig. 9a; Table S5). At La Campana the bedrock CIA value is 52 ± 1. The range of CIA of regolith samples between 50 and 58 is similar and indicates a low degree of weathering (Table S5). The bedrock CIA at Nahuelbuta is 54 ± 1, regolith samples show progressively increasing CIA values (Table S5) from 56 in saprolite to 75 in the A horizon. Thus, the degree of chemical weathering in the study area is generally relatively low, except for Nahuelbuta, and increases from Pan de Azúcar to Nahuelbuta.. evaluation for Zr and Ti. A line (i.e. weathering enrichment line, including uncertainty envelopes representing bedrock heterogeneity) was constructed from the initial Ti/Zr ratios of bedrock samples. The line describes the expected relationship between these elements' concentration in regolith if they were entirely immobile during chemical weathering, and if a change in their concentration is solely due to weathering (i.e. no external input, no differential mobility), such that their concentrations increase in proportion to each other by loss of other elements (Hewawasam et al., 2013). Only Zr and Ti concentrations in regolith samples in Pan de Azúcar and La Campana roughly plot on the weathering enrichment line (Fig. 10a, c). In La Campana, exceptions are restricted to LCPED30 (Fig. 10c) and are most likely caused by compositional heterogeneities of the regoliths' parent material (Table S2). In Santa Gracia, regolith samples plot exclusively below the weathering enrichment line (Fig. 10b). Ti loss cannot be excluded, given the higher solubility of Tibearing minerals (i.e. biotite, titanite) when compared to zircon. In Nahuelbuta, most soil samples plot along the weathering enrichment line, but saprolite samples scatter widely (Fig. 10d). The high concentration of Ti in the saprolite and B horizon of samples from NAPED20 and NAPED40 can only be explained by heterogeneity in the substrate. Based on the possibility that Ti is mobile in some samples and the fact that Zr is used as a reference element in the majority of weathering and soil production studies worldwide (e.g. Green et al., 2006; Hewawasam et al., 2013; Riebe and Granger, 2013; Riebe et al., 2001; Uhlig et al., 2017), we will use Zr as immobile reference element in our study.. 5.2.1. Assessing Zr and Ti immobility in the study area Zr, Ti, and Nb are commonly assumed to be least mobile during weathering (Chadwick et al., 1990; White et al., 1998) and are thus used in estimates of mass loss in the dissolved form during weathering (Eqs. (3) & (4)). We first evaluated the suitability of these elements on a case to case basis, as their abundance can be biased from rock values by heterogeneity, loss, or external inputs. In Fig. 10 we perform this. 5.2.2. Chemical depletion fraction (CDF) Whereas the CIA presented above describes relative weathering trends, the CDF quantifies elemental loss. The CDF has been calculated using the study sites' average bedrock Zr concentration. The median CDF of the entire sampled regolith is between 0.2 and 0.5 for Nahuelbuta, La Campana, and Santa Gracia. At these sites, the CDF in the A and B horizon is also higher than that in the saprolite (Fig. 11). 193.
(12) Catena 170 (2018) 183–203. R.A. Oeser et al.. Fig. 10. Ti and Zr concentration measured in soil, saprolite, and bedrock at the four primary EarthShape study sites. Solid lines (with error envelope, dashed) indicate the weathering enrichment line for bedrock composition, constructed from initial element ratios from bedrock samples and their uncertainty, as quantified by the Ti and Zr concentration of multiple bedrock samples.. rock samples. We thus evaluate vertical structure in elemental loss or gain relative to the base of the regolith profiles, rather than relative to bedrock. For Fig. 12, we averaged τ values for A, B and saprolite horizons within each site (Table S5) to resolve statistically significant patterns for each site. The regolith at Pan de Azúcar shows almost no losses, but an enrichment (i.e. τ > 0) of Ca and Mg with decreasing depth. At Santa Gracia, averaged τ values for major elements and P in the saprolite indicate neither loss nor gain (i.e. τ = 0; Fig. 12b). These elements are slightly depleted in A and B horizons. In La Campana, only Na and Si are lost in significant proportions from the saprolite (Fig. 12c; Table S5). These elements are progressively depleted with decreasing depth. P and K are depleted in the A and B horizon relative to the saprolite. Significant differences are apparent in the depletion of Ca, Mg, Fe, and Mn between the N- and the S-facing mid slope profile (Table S5). In Nahuelbuta, τ values spread widely around their median values, which we attribute to the large chemical heterogeneity within the parent material (Fig. 12d; Table S4 and S5). In the A and B horizons, τ values indicate moderate (i.e. τCa, K, Mg ≈ −0.25) to high depletion (i.e. τP, Si ≈ −0.60).. This increase in the intensity of weathering between saprolite and soil is most pronounced in the S-facing mid-slope profile at Santa Gracia (weathering intensity increase by 28%) and in the top-slope pit at La Campana (weathering intensity increase by up to 35%; Table S5). Only in Pan de Azúcar the degree of weathering as quantified by the CDF is very low: at this site, the saprolite CDF is zero within uncertainty and only the thin A horizon shows some loss with a median CDF of 0.1. The B horizon shows enrichment (CDF < 0), which is due to atmospheric input and the formation of gypsum and calcite precipitates in this horizon. Differences in the degree of weathering between N- and S-facing regolith profiles are either not resolvable or, as in Nahuelbuta, caused by substrate heterogeneities within the profile. However, all CDF values are subject to high uncertainties, as shown by the standard deviation of the pooled samples at each site (Fig. 11). These uncertainties stem from the chemical heterogeneity in the bedrock (Figs. 7 & 10; Table S2) and heterogeneities within the regolith profiles (Fig. 10; Table S4). This limits the attainable resolution in CDF to ± 0.04 at Pan de Azúcar, ± 0.6 at Santa Gracia, and ± 0.1 for Nahuelbuta and La Campana (Table S5). Due to the high uncertainty of the CDF in Santa Gracia, we cannot exclude that the degree of weathering is actually lower than estimated at this site. The large variation in the Zr concentration within the regolith profiles in Nahuelbuta, especially in NAPED20 (Table S4), account for the high variability in CDF values in this study site.. 5.2.4. Volumetric strain (ε) Volumetric strain has been calculated using each study sites' average bedrock density and Zr content (Table S2) along with the regolith samples' bulk density (Bernhard et al., 2018) and Zr content (Table S4). Largest volumetric expansion is seen in saprolite and soil samples from Nahuelbuta, ranging from 0.22 in saprolite to 1.54 in soil (Fig. 13; Table S5). The saprolite in the two sites further north (La Campana and Santa Gracia) experienced neither expansion nor collapse (Fig. 13; Table S5). For Pan de Azúcar, strain values in saprolite have. 5.2.3. Elemental mass transfer coefficients (τ) Elemental mass transfer coefficients (τ) have been calculated using the Zr concentration of each regolith profile's lowermost sample as reference since the geochemical heterogeneity of bedrock (Table S2) does not allow the identification of a representative Zr concentration from. Fig. 11. Chemical Depletion Fraction (CDF) for each study sites' averaged A horizon (top), B horizon (middle) and saprolite (bottom) samples. See legend in panel a for the explanation of the uncertainty bars. The accuracy of the absolute CDF values is limited by the variability in the respective sites' bedrock Zr concentration as indicated by the gray 1σ bar at the graphs' bottom. Note that the Y-axis scale is expanded by a factor of three for the A and B horizon in Pan de Azúcar. 194.
(13) Catena 170 (2018) 183–203. R.A. Oeser et al.. Fig. 12. Elemental mass transfer coefficient (τ, the fractional element loss that was calculated here relative to the sample at the base of the regoliths profile) for each study sites' averaged A horizon (top box), B horizon (middle box), and saprolite (bottom box) samples. The upper graphs show τ values for Si, Mg, and P, whereas the lower graphs show τ values for Na, K, and Ca. Note that the shown τ values are only stacked for visualization reasons and represent τ values averaged over the study sites' specific horizons. Further, the Y-axis scale is expanded by a factor of three for the A and B horizon in Pan de Azúcar.. towards the A horizon (Fig. 14a–c). Differences between oxalate- and dithionite-extractable Fe are most pronounced in Pan de Azúcar and La Campana. In Nahuelbuta, both the Fed/Fetot and Feo/Fetot ratios increase to values up to 0.24 in the A and B horizons. Pyrophosphateextractable Fe (Fep, organic-bound colloidal Fe) range from 15 to 6870 ppm. The absolute Fep concentration substantially increase from La Campana to Nahuelbuta. The northern three study sites' average Fep is ∼200 ppm. From the oxalate-extractable Al (Alo, amorphous Al-Si-OH) and dithionite-extractable Al (Ald, clay) we have calculated oxalate-extractable (Alo/Altot) and dithionite-extractable Al fractions (Ald/Altot) that range between 0.1 and 0.2 (Fig. 14). Large differences between the two extracts were observed only in Nahuelbuta and to some extent in Santa Gracia (Fig. 14b and d). In Nahuelbuta, fractions of extractable Al. not been calculated because no measurements of density were available. Whereas the soil horizons in La Campana and Santa Gracia are affected by minor dilation (ε ≈ 0.25) and collapse (ε ≈ −0.25), respectively, the A- and B-horizons in Pan de Azúcar show a higher volume expansion (ε ≈ 0.8; Fig. 13; Table S5). 5.3. Pedogenic oxides The oxalate-extractable Fe (Feo, ferrihydrite and poorly crystalized goethite) and dithionite-extractable Fe (Fed, well crystalized goethite, hematite, and lepidocrocite) were normalized to the total samples' Fe concentration determined from XRF analyses (Table S4). The Feo/Fetot ratio in Pan de Azúcar, Santa Gracia, and La Campana ranges from 0.002 to 0.025 with slightly increasing proportions of extractable Fe. Fig. 13. Volumetric strain (ε) for each study sites' averaged A horizon (top), B horizon (middle) and saprolite (bottom) samples. Positive values denote to expansion and negative values to collapse of the regolith profile. See legend in panel a for the explanation of the uncertainty bars. The accuracy of the absolute ε values is limited by the variability in the respective sites' bedrock Zr concentration as indicated by the gray 1σ bar at the graphs' bottom. Note that the Y-axis scale is expanded by a factor of three for the A and B horizon in Pan de Azúcar. In this study site, no ε is available for the saprolite, as bulk density has not been determined for these samples. 195.
(14) Catena 170 (2018) 183–203. R.A. Oeser et al.. Fig. 14. Ratios of Al and Fe concentrations of the pedogenic oxide fraction (oxalate extracted, closed symbols; dithionite extract, open symbols) relative to total sample concentration. Regolith profile names are indicated above and dashed lines indicate the soil–saprolite boundary.. 5.4. Denudation, weathering, and erosion rates. increase towards the profiles' A and B horizons. Here, the differences between oxalate- and dithionite-extractable fractions become increasingly pronounced. Pyrophosphate-extractable Al (Alp, organic-bound colloidal Al) ranges from 30 to 12,500 ppm. Alike Fep, the highest absolute Alp concentration is observed in Nahuelbuta. Only small amounts of Si were extracted by oxalate (Sio), dithionite (Sid), and pyrophosphate (Sip). Oxalate-extractable Si ranges from 65 to 1500 ppm, dithionite-extractable Si ranges from 65 to 3800 ppm, and pyrophosphate-extractable Si ranges from values below detection limit to 1615 ppm, respectively (Table S4). For all fractions, lowest values are observed in Pan de Azúcar (with the exception of Sip in La Campana) and highest values are observed in Nahuelbuta. The oxalateextractable Mn (Mno), dithionite-extractable Mn (Mnd), and pyrophosphate-extractable Mn (Mnp) range from 36 to 1400 ppm, from 22 to 1600 ppm, and from 1 to 420 ppm, respectively (Table S4).. In situ-produced 10Be concentrations in quartz used for denudation rate calculations range between 8.9 ± 0.4 and 45.0 ± 1.4 × 10⁴ atoms gQtz−1 (Table S6). Denudation rates D calculated from these nuclide concentrations increase from Pan de Azúcar (Sfacing: 11.0 ± 0.7 t km−2 yr−1; N-facing: 8.2 ± 0.5 t km−2 yr−1) to Santa Gracia (S-facing: 22.4 ± 1.5 t km−2 yr−1; N-facing: −2 −1 15.9 ± 0.9 t km yr ) and La Campana (S-facing: 53.7 ± 3.4 t km−2 yr−1; N-facing: 69.2 ± 4.6 t km−2 yr−1). D at the southernmost location, Nahuelbuta, is lower than that at La Campana (S-facing: 47.5 ± 3.0 t km−2 yr−1; N-facing: 17.7 ± 1.1 t km−2 yr−1; Table S6). Based on denudation rates and the CDF derived from Zr concentrations in soil and bedrock samples, respectively, the chemical 196.
(15) Catena 170 (2018) 183–203. R.A. Oeser et al.. Nahuelbuta ranging from 14.0 ± 1.0 to 26.0 ± 2.0 μg gregolith−1. In contrast, highest DNA yields and variations from 20.5 ± 0.5 to 44.1 ± 11.1 μg gregolith−1 were obtained in saprolites from Santa Gracia. DNA concentration in La Campana mainly varied around 27.0 μg gregolith−1 (Table S7). Quantification of 16S rRNA genes revealed consistently higher abundances of bacteria than archaea within the saprolite samples (Fig. 16). Pan de Azúcar was the only primary study site with no topography-specific variations. Bacterial cell numbers ranged constantly around 105 gene copy numbers per gram of regolith. Archaea were lower by up to two orders of magnitude. Saprolites from Santa Gracia revealed the overall highest bacterial abundances in the top slope with 6.5 × 10⁷ gene copies gregolith−1. The lowest bacterial cell numbers with 3.9 × 10⁴ copy numbers gregolith−1 were detected in the mid-slope (N) in La Campana. In Nahuelbuta, the highest and lowest archaeal abundances were obtained, ranging from 1.2 × 10² in the mid-slope (S) to 5.2 × 10⁶ gene copy numbers gregolith−1 in the toe-slope. However, relative microbial abundances did not significantly differ between the regions Nahuelbuta, La Campana, and Santa Gracia (P > 0.09). Only data from Pan de Azúcar turned out to be significantly different from all other study sites (P < 0.05). In general, bacteria outnumber archaea in all study sites. In the driest regions Santa Gracia and Pan de Azúcar, the highest archaea-to-bacteria ratios were detected (Table S7). The overall highest archaea-to-bacteria ratio (1:217) was obtained in the mid-slope (N) in Santa Gracia. The mid-slope (S) of La Campana showed the lowest archaea-to-bacteria ratio (1:3).. Fig. 15. Concentration of extracted DNA, averaged over the entire sampled saprolite depth. Box plots represent the sum of values of all topographic positions combined in Nahuelbuta (NAPED), La Campana (LCPED), Santa Gracia (SGPED) and Pan de Azúcar (AZPED). Median lines are indicated within the boxes of which the size corresponds to ± 25% of the data, whereas the whiskers show ± 1 st dev of all data. DNA was extracted from saprolite samples in triplicates.. weathering rate and the physical erosion rate are calculated using Eqs. (6) and (8) (Table S6). The average chemical weathering rates increase from Pan de Azúcar (≈0.9 t km−2 yr−1; excluding the negative W value for AZPED21) to Santa Gracia (≈9.5 t km−2 yr−1) and La Campana (≈32.8 t km−2 yr−1). The physical erosion rate is similar in Pan de Azúcar and Santa Gracia (≈10.1 and ≈9.6 t km−2 yr−1), whereas the physical erosion rate is higher in La Campana (≈28.7 t km−2 yr−1) than at the locations further North. The heterogeneity in bedrock and regolith Zr concentrations prohibits the calculation of an accurate weathering rate at Nahuelbuta. Taking the total denudation rates at face value, the estimated chemical weathering rates in Nahuelbuta would be ≈5.5 t km−2 yr−1 and the physical erosion rates would be ≈27.1 t km−2 yr−1. However, we have no confidence in the accuracy of these estimates.. 6. Discussion Assuming that the EarthShape approach, namely that geological boundary conditions (i.e. bedrock, rock uplift rate) do not differ along the transect, the bio-climatic forcings can be evaluated. We initiate this evaluation by structuring the observed geochemical trends into three categories: (1) A continental latitudinal trend, where (chemical) weathering intensity increases from north to south as precipitation and vegetation cover increase; (2) a local trend, where regolith on the Nfacing catenae is exposed to more incoming solar radiation and thus less moisture is available for weathering reactions and plant biomass compared to the S-facing slope, and (3) an in-situ trend, where weathering intensity decreases with increasing regolith depth. We discuss these trends for the four EarthShape study sites. Further, we discuss the drivers of weathering and whether it is possible to discern abiotic from biotic processes.. 5.5. Microbial abundance in saprolite The extraction of total genomic DNA resulted in high variability (Fig. 15). Lowest DNA amounts were detected in saprolites from Pan de Azúcar with a minimum of 14.5 ± 2.5 μg gregolith−1, followed by. Fig. 16. Abundance of bacterial (open) and archaeal (patterned boxes) 16S rRNA gene copy numbers per gram of regolith in the primary study sites, averaged over the entire sampled saprolite depth. Saprolite samples were collected along the hillslope catena at four different positions. Box plots represent the sum of all replicate samples, each measured in quadruplicate qPCR reactions. Median lines are indicated within the boxes of which the size corresponds to ± 25% of the data, whereas the whiskers show ± 1 st dev of all data. S = south facing, N = north facing.. 197.
Figure


+5


Documento similar
After the Spanish withdrawal from the territory in 1975, Morocco waged a brutal military campaign against the Polisario, and large numbers of people fled to refugee camps, where
In the “big picture” perspective of the recent years that we have described in Brazil, Spain, Portugal and Puerto Rico there are some similarities and important differences,
- Competition for water and land for non-food supply - Very high energy input agriculture is not replicable - High rates of losses and waste of food. - Environmental implications
For a short explanation of why the committee made these recommendations and how they might affect practice, see the rationale and impact section on identifying children and young
The expansionary monetary policy measures have had a negative impact on net interest margins both via the reduction in interest rates and –less powerfully- the flattening of the
Jointly estimate this entry game with several outcome equations (fees/rates, credit limits) for bank accounts, credit cards and lines of credit. Use simulation methods to
In the previous sections we have shown how astronomical alignments and solar hierophanies – with a common interest in the solstices − were substantiated in the
As in the case of pistachio, DIC treatment reduces band intensity as pressure and time increase, and the most effective treatment is DIC8 in which both the number and intensity of
