An analysis of credit distribution in Spain through sectors from a financial perspective
23
0
0
Texto completo
(2) Index of contents 1.. Introduction. ........................................................................................................... 2. 2.. State of the Art. ...................................................................................................... 5. 3.. Credit distribution analysis. .................................................................................... 6. 4.. 5.. 3.1. The sample. .................................................................................................... 6. 3.2. The indicators. ................................................................................................ 7. Results of the analysis. ........................................................................................ 10 4.1. Inequality measures: Gini index and Lorenz curve. ....................................... 11. 4.2. Credit increase over assets and Z-score. ...................................................... 12. 4.3. Credit increase over total assets and Leverage. ........................................... 14. 4.4. Credit increase over total assets and Current ratio. ...................................... 16. 4.5. Credit increase over total assets and Profitability. ......................................... 18. Conclusions. ........................................................................................................ 20. Table of illustrations. Illustration 1: Bankruptcy evolution in Spain. Source: INEbase, Estadísticas de la construcción. ................................................................................................................ 3 Illustration 2: Factors contributing to tightening credit standards. From 4th quarter of 2006 to 4th quarter of 2008. .................................................................................................... 4 Illustration 3: Bankruptcy evolution in Spain. ................................................................. 4 Illustration 4: Gini index evolution of size indicators. Construction sector. ................... 11 Illustration 5: Lorenz Curve of Total Assets 2007 ........................................................ 12 Illustration 6: 2012 Credit in construction .................................................................... 13 Illustration 7: 2002 Credit in Construction.................................................................... 13 Illustration 8: Leverage in t-1 and Bank Loans Increase over Assets. 2013. Manufacturing Sector. ........................................................................................................................ 15 Illustration 9: Bank Loans increase and Current Ratio 2007. Construction Sector. ...... 16 Illustration 10: Current Ration and Credit Increase over assets. Services sector......... 17 Illustration 11: Credit increase over total assets and profitability. 2014. Construction. . 18. 1.
(3) 1. Introduction. Financial Crisis. (Beginning. Causes. Consequences). As a background. In 2007-2008 the world experienced a financial crisis considered by many economists as the worst since the Great Depression in 1930s (Eigner and Umlauft, 2015). The financial sector in an economy has the aim of allocating exceeding financial resources in an efficient way: arrive to an equilibrium between savers (supply) who act as lenders, and those with saving deficit (demand) who act as a borrower. As a science, the economy has the aim of assigning the scarce resources efficiently. An efficient allocation on an economy implies assignment procedures, that is, a market structure that permits the agents (demand and supply) comparatively more productive, given a limited amount of factors, access to that scarce resources. But imperfection of markets leads to inefficient situations reflected in market imperfections on the supply side and on the demand side (Greenwald and Stiglitz, 1993). Globalization has made world economy increasingly interlinked. A huge complex system as the world economies become part of a global village in which the scope of economic factors get increasingly wider and where risks and opportunities increases for every agent in the economy. In this sense, the financial markets have suffered a transformation towards a financial globalization in which financial markets get in touch generating new equilibrium and other gains and pains (see Rajan, 2005). Another consequence of globalization is the increase of systemic risk. The possibility to access to finance from all over the world brings with itself the offshore of investment risks, regardless personal decisions. As mobility costs decreases, capital flows increase, enabling more efficient allocations, what implies greater fluctuations of capital across countries and higher volatility caused by constant changes in capital allocation, and thus market becomes more sensitive to shocks, increasing systemic risk (see Schwerhoff and Edenhofer, 2014). Interdependence as a result of globalization propitiate trade and economic unions, as the European Union or NAFTA, and create institutions to regulate international flows where two or more parties play with different legislation. In these agreements there is a link is created among countries whereby the economic performance is going to be backed by the union in case of failure or need; interdependence make of every part too important to let them fall. A similar fact occurs within a region when a company becomes so big that its performance becomes of public interest. There exists then, a moral hazard for any government institution which has the duty to regulate the system, and the experience of the financial crisis has taught us that when this happens, agent’s behavior becomes irresponsible (see Murdock, Hellmann and Stiglitz, 2000; Bubb and Kaufman, 2014). At the beginning of the 21st century we have assisted to many corporate frauds and scandals of companies like for example: Enron and his auditor company Arthur Andersen (2001), Worldcom (2002), Lehman Brothers (2008) bankruptcy, which is considered by many to be the beginning of the crisis (Soltani, 2014); specially remarkable the case of Lehman Brothers, often recognized as the official beginning of the crisis, and perfect example of Moral Hazard. To control the risks governments and institutions regulate the economic activity in order to shape decisions towards a responsible performance. Financial regulation, then, is aimed at controlling that investments follows efficient activities in order to maintain the sector’s stability (Balseven, 2016).. 2.
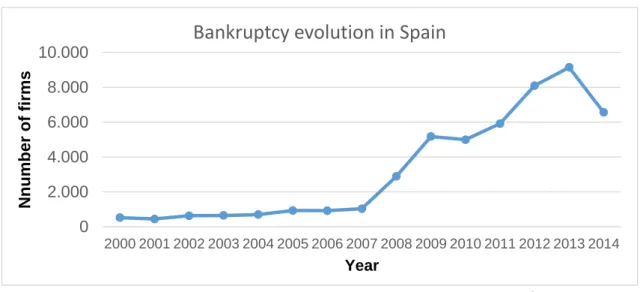
(4) At this stage, one important matter to regard is how markets determine prices, equilibria. And the Efficient Market Hypothesis offer us an answer stating that a price market contains all information to take into account for any user of information, so that a stock market, for instance, with an overvaulted price (according to previous market price or according to market agents) is giving account for a fact that has changed its fundamental value (see Malkiel, 2003). However, according to the empirical results, reality shows that state of affairs to accomplish this theory are never given all at the same time. At this point arises the aim of this paper: do financial markets take into account indicators? We are not trying to review the Efficient Market Hypothesis; the purpose of this study is to analyze how Credit distribution rely on financial indicators. We, then, study the Financial Resources Assignment. As scarce resource it has to be efficiently assigned, for which Supply (Banks and Financial Institutions) will look for the more profitable investments for its exceeding financial resources; and Demand (in this case we only look at firms) will try to attract free capitals offering an attractive interest rate. In this paper we try to make an approach to the efficiency in the allocation of financial Resources in Spain for the period of 2000-2014 from the supply side. We try to understand how credit is assigned to companies based on financial indicators i.e.: leverage, Zscore, profitability and current ratio. For this purpose we also study allocation of financial resources from the perspective of equality using Gini index and Lorenz curve to represent graphically size variables of firms. Empirical researches shows that inequality is extended over a great range of firms’ size features, and specially Bank Debt, which is the aim variable of this study (Axtell, 2001; Alfarano et al., 2012). It is worth to denote the relevance of construction sector as one of the main causes of the crisis in Spain as leading sector that experimented a huge economic growth. The construction sector mainly leaded economic growth in Spain in the period prior to crisis. From 2000 to 2007 in Spain were constructed 5.5 million of new houses2. Speculation in Spain was one of the major driving forces of the construction boom. From 2000 to 2007, price of new houses grew at an accumulated annual rate of 11.7%3. That explain that from 200 to 2007, the annual accumulated inflation rate in Spain was of 3.19% while in the European Union was of 2.14%4. From 1999 to 2007 there is a change on credit. Bankruptcy evolution in Spain Nnumber of firms. 10.000 8.000 6.000 4.000 2.000 0 2000 2001 2002 2003 2004 2005 2006 2007 2008 2009 2010 2011 2012 2013 2014. Year. Illustration 1: Bankruptcy evolution in Spain. Source: INEbase, Estadísticas de la construcción. 2. INEbase, Estadísticas de la construcción. Ibidem. 4 Eurostat. 3. 3.
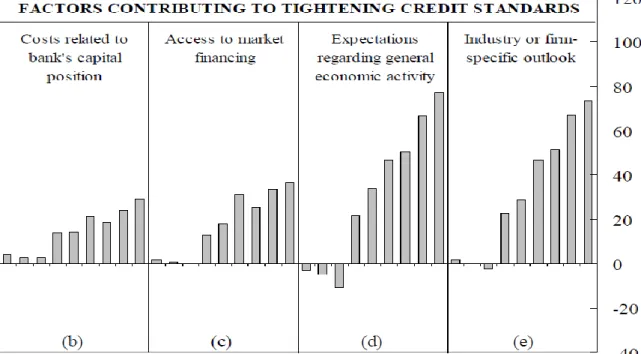
(5) distribution between construction sector and manufacturing sector. In 1999 each sector hold around 30% of total credit; in 2007 construction received the 55% of total credit in Spain, meanwhile manufacturing sector accounted for 15% of total credit in Spain (Petrovic, Teglio and Alfarano, 2016). One key question on the analysis of financial distribution distortions is that caused by the overvaluation of the underlying asset, as is the case of construction sector’ growth in Spain; and when it becomes systemic, it tends to create a bubble on the sector affected (Akin et al., 2014). Two factors contribute specially to biased appraisals of house projects for which consumers asked for a loan to the bank. The first fact was the extremely inflated prices in real-estate sector, and thus, the underlying asset did not really cover possible failures. The second fact is that banks could match their clients; enterprises with households, and thus assure accomplishment of both sides. As we can see in the table above, in 2008 the number of firms defaults increases dramatically with the financial crisis. It is important to know that financial crisis implies that many firms enter in state of defaulting not because of bad economic performance, but because of inability of debtors to pay dues, or because Banks lose their confidence on the economy because of the general situation. In any case, we look at bankruptcy as an important issue for our study as a financial fact. Bankruptcy, as Lundqvist and Strand interpret, is a natural result of Capitalism, according with the creative destruction term that uses Schumpeter that arises from industrial structures mutation. We make use of literature about Companies Default Prediction. Through this prediction model we try to find a relation between credit granted for companies and its probability of bankruptcy. In relation with this, we can see in the table below factors affecting the access to finance. These are the results of the Euro Area Lending survey made by the European Lending survey to banks of the Euro Area. This table shows how banks dramatically increased. 06 Q4 07 Q1 07 Q2 07 Q3 07 Q4 08 Q1 08 Q2 08 Q3 08 Q4. 06 Q4 07 Q1 07 Q2 07 Q3 07 Q4 08 Q1 08 Q2 08 Q3 08 Q4. 06 Q4 07 Q1 07 Q2 07 Q3 07 Q4 08 Q1 08 Q2 08 Q3 08 Q4. 06 Q4 07 Q1 07 Q2 07 Q3 07 Q4 08 Q1 08 Q2 08 Q3 08 Q4. Illustration 3: Bankruptcy evolution in Spain.. Illustration 2: Factors contributing to tightening credit standards. From 4th quarter of 2006 to 4th quarter of 2008.. 4.
(6) terms and conditions (standards) from the 3rd quarter of 2007, due to the expectations and the fact that the financial market was feeling the effects of years of the over growth. This at last, results in a decrease of supplied funding. And it is seen that the two factors that most affect are based on expectations, not on technical aspects, −although the contribute to make more difficult the access to credit− like the access to market financing of costs related to bank’s capital position. 2. State of the Art. For this financial analysis, we have to take into account that as an economic agent, a company has to play a role on business taking into account that technical part of a company has a limited role on success. Therefore, any assessed factor, however defined it may be, has a limited interpretation. There is a human factor that affects a company at every stage, which we could name as social factors, and they cannot be delimited, as they are not quantitative facts. And they mutually affect (for example Herding behavior) in the analysis, the causes, consequences and interpretation of any economic or financial fact. That is the essence of a social science, as it is the economy. Quantitative methods can parameterize some variables. But there will always be a further human election that changes the quantification of preferences and thus the internal structure of any analytical system tool, causing the non-universal results of trials under same circumstances that any natural science can use as axiom to construct science. Anyway, further from leaving our object, we try to consider this aspect when analyzing. We try to measure financial performance and financial risk, and assess their importance to determine the access of a company to financing. Financial risk as such is complex to measure. For banks and other financial institutions, risk information of borrowers and other historical information of economic variables such as solvency, leverage, etc. are pretty worthy. The history of financial analysis for credit decisions begins in 1870, although until 1890 it did not became of general use. It began with a basic Financial Statement comparison, and it progressively evolved in a more complex and accurate analysis (Altman, 1968). Afterwards, throughout the 20th century quantitative analysis of companies has evolved as a way to measure economic performance. On credit granting to borrowers, there exist specialized companies in rating company’s ability to repay the loan based on historical payment data. That results in a prime risk that the company has to pay on the granted loan (Ramos and Simôes, 2012). Furthermore the limits on historical data analysis, there is a problem related with the privatization of this rating industry. An aggressive competence among these companies can cause dishonest behaviors from demand and supply, making companies look for those companies that gives them a better rating (Mathis, McAndrews and Rochet, 2009). In the academic world, there has been many studies related with Financial Statement analysis for Bankruptcy prediction modelling. In 1966 William H. Beaver published a paper where he analyzed thirty ratios from 79 failed and 79 non-failed firms, mainly from manufacturing sector (Beaver, 1966). He determined some ratios as bankruptcy predictors to measure healthiness of a company. He thus putted somehow basis for multivariate analysis (Altman, 2000). In 1968 Altman was the pioneer in modelling with a multiple discriminant analysis without non-financial background on his study. He thus obtained the Z-score which measures risk of financial distress through weighted financial ratios for listed companies. He has later on developed and updated the predictor on time. 5.
(7) and sample scope (industries). In 2000 he re-estimated his model for unlisted companies substituting variables that only listed companies has, like market value of equity. Accurate predictions or analysis require a deep approach to the sample. In accordance with the nature of this work, rigorousness is based upon papers and studies of experts in the subject. Although other tools for the analysis are straightforwardly related with aim of the study. 3. Credit distribution analysis. On conducting the analysis we have nor focused on determining the causes of the bank credit loans allocation (drivers of economic growth, expectation, market conditions, etc) neither why did banks financed determined firms (link between balance sheets). Our goal is to understand the allocation in Spain of Financial Resources through a firms’ Financial Statement approach. To do so, we analyze the balance sheet and other financial statement information of firms across sectors. This perspective of the economic facts that took place in Spain from 1999 to 2014 does not move away from a real perspective of the problem, which many would point out to be the fundamental value upon which the economy was growing. The growing value of the underlying assets on which many credits were based on, as any other indicator, has a financial effect, and as such, this fact is in accordance with our approach. Consequently, this viewpoint, let us see from a unusual perspective how Spain went from prosperity and growth to an economic crisis of great and depths consequences in the system and address to the causes of the crisis from a financial outlook. As we have said previously, there are factors affecting the access to credit for a firm which ranges from quantitative, non-quantitative, and other with limited interpretation. There are many factors that we have not taken into account to explain credit distribution, which would have required an individual explanation. 3.1 The sample. To conduct the analysis, adequate information and create new variables we have used the program RStudio, an Integrated Development Environment. The sample of information is formed by 26.776 Spanish companies which belong to four sectors: 1) Construction 2) Manufacturing, 3) Trade and 4) Services. All the information of companies has been obtained from SABI database. The selected period goes from 1999 to 2014. This period let us see how credit distribution evolved and behaved along the economic boom in Spain, and how it changed when the economic crisis begun. According to its typology there are 14 types of companies, namely: a) Public limited company, b) Limited liability company, c) General partnership, d) Limited partnership, e) Cooperative, f) Association, g) Civil company, h) Public body, i) Religious congregation, j) Other legal form and k) Branch of a foreign company. The variety of legal forms is important especially when we consider services firms, which usually find inappropriate the most common forms like Limited Liability Company or Limited Partnership. We have selected only active companies in order to find clearer results of whether banks made a right distinction or they followed non-financial performance criteria. Choosing just 6.
(8) active companies let us also to have a sample of companies which is supposed to be able to continue its economic activity; and therefore it permits us to understand how banks analyzed their investments. We have also selected just companies that accessed to credit. By doing so we avoid companies that did not received credit, or repaid dues, and would have affected the study with negative or null values: we want to explain those criteria that Banks and Financial Institutions followed when they granted lending to corporates. 3.2 The indicators. To compare how credit distribution in Spain was related with economic performance we use Financial Statement and Balance Sheet Information. The variables upon which we have based our study are mainly ratios and other figures from the company. We have also introduced a little of what financial literature has contributed to economic science since the 60’s, using the above mentioned Z-score as a company's bankruptcy predictor. It is important to point out that the use of bankruptcy prediction models in this analysis is not aimed at neither reviewing any model nor construct a new one based on our empirical study. Selected financial literature in this work, previously cited, and their results applied here serves us just as a tool analysis. Many of the indicators used are –as literature review has shown- useful in company’s default prediction; they are not used as a way to predict the financial resources they will be able to obtain. Nevertheless, they indicate from a different outlook financial performance across sectors and along years. The rest of indicators used in this study are frequently within the range of requisites that credit score agencies or banks study to assess borrowers. To conduct the analysis we plot different variables as a method to study the relation between credit obtained and: Zscore, Leverage, Profitability and Current Ratio. We also graph other indicators alone: Gini the coefficient evolution and Lorenz curve. For the analysis, we have used this variables, putting some of them in relation through plots for every sector and every year. The variables compared are: a) Bank Loans increase over assets. Bank Loans increase over assets has been calculated dividing the difference in t and t1 over total assets in t-1. We have calculated Bank Loans increase over total assets instead of total bank loan growth to introduce a measure of relative size of the company. It can give us a more accurate information than calculating growth over loans. Otherwise, using credit growth, we would have obtained striking values of companies which has never asked for loans, and furthermore, we would not obtain an indicator that takes into account the size of the company. Bank Loans increase over assets=. Total Bank Loanst - Total Bank Loanst-1 (1) Total Assetst-1. 7.
(9) Bank loans increase over assets is used as a reference variable, i.e. we try to find a relation between the credit increases of companies through its comparing with financial efficiency indicators, which are the rest. We explain below the meaning and significance of every expression. This variable is measured together with other variables that we present below. As we later mention, it can give us information on how a bank’s balance sheet is linked with the one of a firm. b) Zscore. Zscore is a bankruptcy predictor calculated by Edward Altman. This score indicates the probability within a range of values that a firm has to default. Values of Zscore below 1.21 indicate high probability of bankruptcy. Values between 1.21 and 2.9 mean inconclusive result; and values over 2.9 means low probability of bankruptcy. In this study we use it alternatively as a financial performance measure; it is reasonable to assume that a firm’s probability of default is related with the financial performance. Zscore=0,71. Working Capital Equity E.B.I.T. T. Assets Turnover +0,84 T. Assets +3,107 T. Assets +0,42 T. Liabilities +0.99 T. Assets Total Assets. (2). X1 – Working capital over Total assets. Working capital is calculated as the difference between current assets and current liabilities. This difference shows the exceeding short-term-liquid resources of a firm. It is a liquidity measure which putted in relation to total assets shows the ability of a firm to assume long run obligations in the short term. The importance of this ratio stems on the structural capacity of a firm to assume long-run debts in the short-term, which endows a firm with autofinancing capacity from its own activity. Working Capital = Current Assets - Current Liabilities (3) X2 – Equity over Total assets. This indicator is commonly known as Shareholder Equity Ratio. It is a measure of the private finance of a firm. Besides its importance as an indicator of the share of private investment, as financial ratio it indicates the economic performance of a firm along years, as it contains retained earnings. A firm which has continually rightly worked will earn profits year after year, being able to auto-funding. For a young firm, ceteris paribus, this indicator will be less representative, but we do not attend to this aspect. X3 – Earnings before interest and tax over Total assets (EBIT). The use of earnings before interest and taxes indicates more precisely a firm’s ability to generate profits, regardless its size (taking into account a progressive tax over profits), and its financial history (which can cause higher finance costs). It also subtract the effect of companies that tribute abroad, for foreign branches. Once made this considerations, the importance of the profitability over an asset’s firm is one the most important indicators that any stakeholder will look at any firm, although it is, as any other financial indicator, of limited interpretation. Earnings before Interest and Tax = Net Income + Interest + Taxes (4) X4 – Total Assets over Total Liabilities. This ratio shows by how much total assets are bigger than their debts. It shows in other terms the indebtedness of a firm. The bigger this ratio is, the most assets rely on self-investment.. 8.
(10) X5 – Turnover over Total assets. Dividing sales over total assets you can find a firm’s assets capacity of generating sales. Although this ratio has more significance analyzed together with profitability, it is very important to know whether assets are productive or not. c) Leverage. We have measured Financial Leverage as debt over equity. It is a very significant figure which measures the degree to which a company appeals to external finance to develop its economic activity, instead of risking its own resources in that investment. A high degree of leverage can be due to a high risk that investors do not want to run. It also can show to which degree investors are confident on a business so that they leverage the company in order to boost profits due to a higher amount of capital invested. Leverage=. Total Liabilities (5) Private Equity. This ratio together with credit increase over assets gives complementary information. In theory, Banks are prone to finance companies with a low leverage rate, as a company that is running year after year by getting indebted can be a signal of bad results. There is also a key question on assessing leverage of a firm, which is the link created between one or more banks and a firm. Big firms have more facilities to access to credit market with better conditions than small firms. It can create a relationship of dependence between the bank and the firm. Although in relative terms a big company can be equally leveraged than small firms; in relative terms, bank becomes much more dependent on how that big firm performs economically. Thus, a firm near to financial distress will have easier support of a Bank that has previously lent money to the firm due to the effects that bankruptcy would have on the bank’s balance sheet. In this situation, a bank will be more prone to try to refinance the company in order to save potential losses rather than demand the liquidation of the firm, which can be riskier if overlying asset has a low degree of liquidity or has lost value. d) Profitability. Profitability is calculated as Earnings Before Interest and taxes, but now over total sales. This ratio shows a firm’s ability to generate exceeding income over their total sales in relative term. In this study, profitability is used as a contrast variable, which together with other external financing indicators let us study whether credits were granted taking into account economic performance. Profitability =. Earnings Before Interests and Taxes ×100 (6) Operating Revenue. It can be interpreted by stakeholders as an expected rate of return that they would obtain from their investments in any company. A high profitability can indicate that a firm is able to return to shareholders profits from their investments through dividends. e) Current Ratio. We have used current ratio as a liquidity measure. Current ratio is calculated by dividing Current Assets over Current liabilities. It is a similar indicator to the one used previously in Zscore. But thus expressed, we obtain the relative size of current assets with respect to current liabilities. This indicator does not take into account the relative size over total assets, it just relate them alone. Its utility stems in 9.
(11) the ability of a firm to generate liquid resources. A company that access to credit should show a higher degree of liquidity the greater the amount of credit it wants to obtain. Current Ratio=. Current Assets (7) Current Liabilities. The study of these two variables is very useful in studying the efficiency of the financial sector. This is one of the indicators that banks and credit score agencies most value at the time of granting or scoring creditworthiness. And so it is reasonable to assume that an efficient distribution will take into account his variable, so that we can observe for a groups of companies with similar characteristics in financial terms a partial relation. f) Gini Index (coefficient) and Lorenz Curve (Graphical representation). To complement the approach from a financial perspective, we also perform an equality analysis, to provide consistency to aim of the study. Not to mention the adequacy of Gini Index and the Lorenz curve to study credit distribution. Equality indicators complement the efficiency study showing how biased are resources allocated. Firstly, we have studied some simple facts about the company’s characteristics that received funding and try to establish a relation between credit granted and the company’s features in order to study the equality across companies. Equality in credit distribution according to size of total assets, leverage, or other financial statement figures let us know how the financial market is biased towards a definite type of companies. We will see how it evolved along years with various indicators. It also sheds more light than comparing through plot in some cases, permitting us to see in just one figure how total credit is relatively distributed among companies. We will also use the Lorenz curve, which graphically permit us to see how any variable is cumulatively distributed among sample firms. 4. Results of the analysis. In this section we present the results of our credit distribution analysis. We do so by presenting the variables previously explained putting them in relation. The analysis of the credit market from the borrower’s side let us to explain some facts that we previously mentioned. With the plots of indicators used to assess credit distribution we study correlation which let us to extract conclusions on credit distribution. For reasons of extension, much of the results obtained from the study of each year and each indicator are not shown in this work. We will show the most representative facts that account of our purpose in this work. In order to interpret the results, we want to remember the assumption we have made previously assuming that every company demands every year a determined quantity of loans according to its financial performance, and that conditions shape demand and supply until they arrive to an efficient equilibrium. This assumption let us to explain better whether there is a bad allocation of resources in terms of efficiency.. 10.
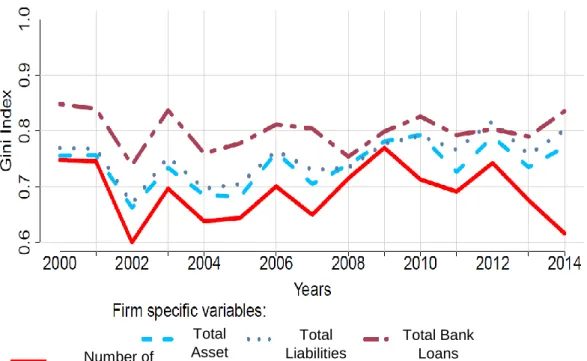
(12) 4.1 Inequality measures: Gini index and Lorenz curve. Inequality indicators can give us a deeper perspective of the causes of the credit distribution in Spain for the period studied. In next subsections we will approach to the problem from a financial perspective to assess financial performance. Now, the study of measures like the total number of employees, total assets, total liabilities and Total Bank Loans will let us to understand better how this resources are distributed in Spain tint terms of equality (inequality).. Number of employees. Total Asset s. Total Liabilities. Total Bank Loans. Illustration 4: Gini index evolution of size indicators. Construction sector. In the illustration above we measure the evolution of Gini index for some variables of the Construction sector: for Total Assets, Total Liabilities, Total Bank Loans and the Number of employees. At first sight we can see that the most unequally distributed variable is Bank debt. Total Bank Loans present the higher unequal distribution, evidencing that it is a resource that is allocated without attending to performance indicators. During the Spanish economic boom, construction sector experimented a huge growth which led to an allocation of resources towards this sector, what can only be explained by higher actual and expected rates of interest, which would attract investors and banks. Expectations on assets value generated demand for bank financing making it more competitive for companies to access. If we focus our attention know on equality within this sector, we can see how Gini index also shows a non-equal allocation of resources for the companies of this sectors. Hence, we can state that during the economic growth in Spain, there was a shift of resources towards a small part of companies that represented a big share of resources in the sector. That competitiveness is an explanation of the relatively constant equality on Leverage, as well as growth of credit over assets and the absolute amount of credit lent. But, as 11.
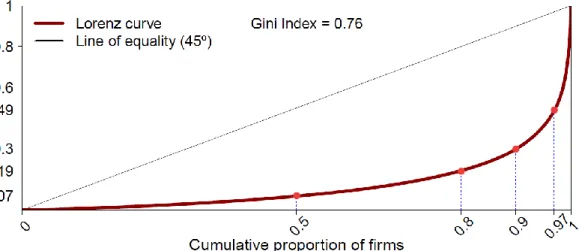
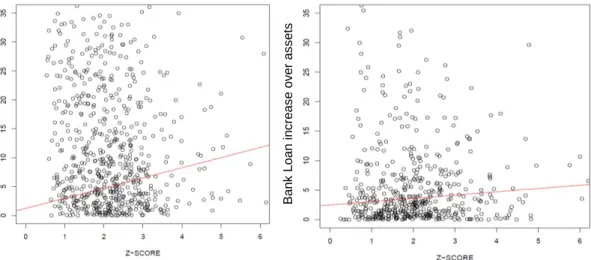
(13) Cumulative proportion of Total Assets. the graph shows, when the economic downturn begins in Spain, credit distribution in terms of equality suffer a shape towards a fewer number of companies, which explains that bias of banking sector towards big companies.. Illustration 5: Lorenz Curve of Total Assets 2007 From this perspective such inequality sugest that Banks were not assessing risks properly whenever they gave loans to a firm. 4.2 Credit increase over assets and Z-score. The first indicators we have plotted are Credit increase over assets and Zscore. Plotting these two variables across sectors and along the years for all companies that accessed to credit and were active, shows that many companies accessed to credit with a high probability of bankruptcy –according to Altman’s study in default prediction– with a Zscore equal or less than 1.2. Some of them even accessed to a 20% and 30% of increase in bank loans with respect to their total assets. Following the Altman’s score, the companies within the range of non-concluding results –i.e. between 1.2 and 2.9– which accounts for a major number of firms, also obtained funding with represented a percentage over their assets ranging from 10% and 35%. Now we present the results across sectors, what let us see furthermore the overall efficiency of the distribution whether financial resources allocation across sectors was efficient or not. a) Construction sector. The construction industry shows the most biased distribution of lent funds towards companies with a lower Zscore. We can easily see in illustration 1 that there was just a few proportion of companies which were granted credit with a Zscore above 2.9 (considered as mentioned before, as a low probability of default). This interpretation is consistent if we consider that the 3rd quartile of Zscore is equal to 2.7; its mean is equal to 2.099 and that the 75% of company’s growth of credit were above 3.7%; with an average growth of 18.18% growth and a 3rd quartile of 24.5% growth.. 12.
(14) Bank Loan increase over assets. Bank Loans increase over assets. The same analysis for 2009 shows a greater number of firms. We have chosen 2009 as a reference year of the crisis because of as we have already mentioned, changes are calculated over the previous year, which in this case is 2008. Otherwise, using 2008’s result would be based on 2007, when the recession had not begun with the same dimensions.. Illustration 7: 2002 Credit in Construction. Illustration 6: 2012 Credit in construction. Continuing with our analysis, for 2009 we can see that there is a decrease in the mean value as well as in the 3rd quartile of Credit increase over total assets. These results are, on the one hand, consistent with the facts that occurred in Spain during that period, but on the other hand, if we consider the change in Zscore, the 3rd quartile even decrease to 2.58, which means that the 75% of companies with the lowest score are even worse than previously. This decrease also happens with the mean value. For 2012, there is a recovery in the mean and 3rd quartile values of Zscore of companies that access to credit. Credit increase over total assets also recovers with a mean even greater than in 2002. b) Trade sector. Trade is the one that in 2002, the 1st quartile of Zscore is near to the limit of a nonconcluding result, with a value of 2.65. The mean value and the 3rd quartile are 3.65 and 4.26 respectively, values which according to the Altman’s classification stands for a very low probability of default. Let us put it another way: financial resources allocated in the trade sector show an efficient behavior. If we look at credit increase over total assets, it presents a smoother distribution with a mean of 13.8% in 2002, 11.68% in 2009 and of 8.08% in 2012. For 2009 and 2012, Zscore presents a low variation; upward in 2009 and downward in 2012. c) Manufacturing sector. The manufacturing sector also shows a more efficient distribution with a mean value of Zscore of companies that accessed to credit near to the non-concluding value in 2002 and even over that limit in 2009 and just under, again, in 2012. These results accord with the fact that there is a tightening on credit granted in 2009, what results in an allocation on more efficient companies, and hence, a greater Zscore value. Nevertheless, in 2009, the reduction on credit granted does not provoke an increase in Zscore, as a performance measure of companies. 13.
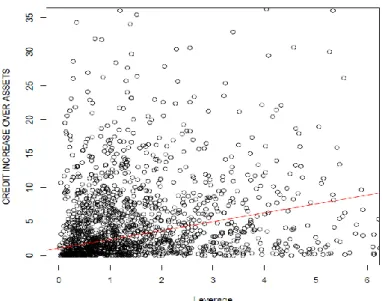
(15) d) Services sector. The service sector shows that in 2002 Zscore was near to the limit of non-concluding results and in 2009 increases over the 2.9 and in 2012 the mean still grows till 3.63. These results shows that credit in manufacturing sector followed an efficient distribution. Credit increase over total assets mean for 2002 is 7.54%, and unlike the construction sector, it increases, what putted together with Zscore change for this year, can be explained by a substituting effect of financial resources towards the most efficient sectors. On the contrary, in 2012 there is a decrease in the average credit increase over total assets to 8.9%, still greater than in 2002, although, as we have already said, companies are more efficient if we look a Zscore. 4.3 Credit increase over total assets and Leverage. With this two variables we study credit increase over total assets from t-1 to t, together with leverage in t-1. The purpose of this study is the same as in the previous section but now instead of looking at the financial reliability through Zscore, we try to understand how credit was assigned taking into account leverage. The major implication that can be withdrawn from the analysis of both indicators is whether indebtedness holds back credit increase over total assets. a) Construction sector. In the construction sector there is a very low correlation between these two variables. There are many different cases for which can find companies that access to a relatively high increase on their loans together with a high level of leverage. And on the contrary, we also find many companies that access to a relatively low increase of bank loans with a low degree of leverage. In this sector we can find many extreme values, which also give us information about how there was another bias inside the credit to this industry towards bigger companies. Although results are not too conclusive, we can observe that in 2003 correlation was equal to 0.137, and then it begins to decrease, with a slight recovery in 2005, with a nearto-zero value in 2008, and a negative value in 2012. b) Manufacturing sector. Manufacturing presents lower values for all years in the average leverage, and with a slow change along the years. This sector, although still insufficient, presents one of the higher coefficient of relation for every year, arriving at its maximum of 0.184 in 2004. But, we have also seen that since 2007 there is a yearly decrease until arriving at a correlation of 0.05 in 2014. As an example, in Illustration 6, above, we can see the plot of Leverage in 2012 and Credit increase in 2013. There is an observed concentration around a pretty low degree of leverage and a very low increase in Bank Loans over Assets.. 14.
(16) This concentration, cyclical for every year for these indicators, shows that only a few companies access to a high degree of financing, but banks do not require for them any determined level, what is unusual among the credit sector. In this sense, it is an empirical evidence of inefficient credit distribution from a financial point of view.. Illustration 8: Leverage in t-1 and Bank Loans Increase over Assets. 2013. Manufacturing Sector. c) Trade sector. In the trade sector we can find that there is a very low correlation in every year for these two variables studied. For example, in 2002 the correlation between leverage and credit increase over assets is equal to 0.068, even though for the rest of year there is a slight positive evolution, while it is still insignificant, equal to 0.085 in 2012. In what respects to the average leverage at which companies access to credit. Since 2000, when the leverage mean is equal to 4.1, there is a slight downward tendency until 2006 when it gets till 3.74, and again in 2009 it begins again to fall till 2.99 in 2014. d) Services sector. Services sectors presents a smother evolution on the average leverage at which companies access to credit. But the correlation between the Bank Loans increase over assets and leverage for every year is under 0.05, what means very weak relation among them. Comparing between sectors we can say that the evolution of mean Leverage at which companies increase Bank Loans over assets is higher in the construction sector, and its yearly evolution is skewed towards a higher degree of leverage. The results shows that there is a very high degree of dispersion for all samples. From this perspective, we can say that leverage is not regarded at the time of assigning credit increase over total assets.. 15.
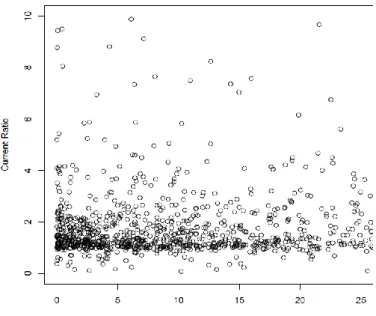
(17) 4.4 Credit increase over total assets and Current ratio. Here we present the analysis of plotting Credit Increase in Loans with Current ratio in previous year. The analysis of how current ratio affects credit distribution is important to determine a firm’s ability to assume short run debts; and according to our aim with this study there should be a positive relation between this two variables. Current ratio is a variable that presents a uniform distribution among companies and sectors. All the companies that have accessed to credit, no matter the wage the increase represented over their assets, have a value for this ratio which is around 2. There is no room for those companies with a low current ratio to obtain credit. In this sense we can assume that financial allocation follows an efficient distribution. In the sector distribution analysis, Construction, Manufacturing and Services are one of the remarkable sectors which show a tendency along the years and among companies which accessed to credit towards a higher current rate. Nonetheless, there is a residual group of companies that remain on a range of low currency ration, and they access to funding. a) Construction sector. The average current ratio of this companies increases from 1.64 in 200 to 2.41 in 2008, and it continues to increase until 3.77 in 2014 for construction sector; as we can see in illustration 4, the majority of firms that access to credit has a Current Ratio above 1, with a dispersed group of companies that also access to credit with a Current Raito above 3. On illustration 7 below we have an example of the clear current ratio limit that banks apply to access to financing.. Illustration 9: Bank Loans increase and Current Ratio 2007. Construction Sector.. 16.
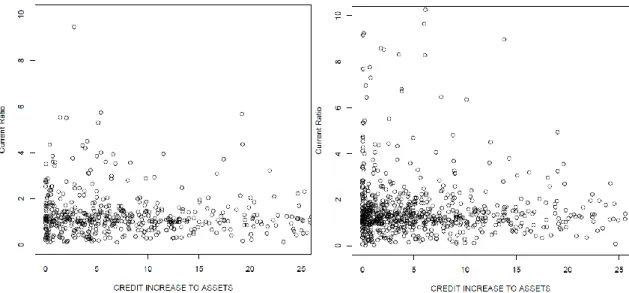
(18) b) Manufacturing sector. For the manufacturing sector also presents an upward trend, although smoother, from 1.50 in 2000 till 1.61 in 2008 and 2.09 in 20014. The evolution of the average current rate of companies that access to credit goes from 1.31 in 2000 till 1.58 in 2008 and 2.9 in 2014, what is in relative terms a great increase. c) Services sector. The services sector presents a constant tendency along years toward an increase in the average current rate at which companies’ access to credit, as well as a residual group of dispersed companies that access at higher current ratios. Plot Credit Increase and Current Ratio. 2002. Plot Credit Increase and Current Ratio. 2011. Illustration 10: Current Ration and Credit Increase over assets. Services sector.. d) Trade sector. For the Trade sector there is first a growth of current ratio for companies that asked for funding, going from 1.4 in 2001 to 2.82 in 2006. But this tendency is then broken, and in 20014 the current ratio returns to 1.83, a similar level to thee initial. Furthermore, the average current ratio for the Trade sector presents a lower standard deviation for every year, in comparison with the rest of the sectors, what from other point of view give us strong results, if we consider that there were more firms within this sector that were subject to this limit. This facts explained have the implication that the coefficient of correlation is near to zero, being sometimes slightly negative, and other times positive. In any case that does not reduce the importance of this variable to study the credit distribution. As we have just said, all companies that accessed to credit are around the same value, what ultimate shows that, considering credit distribution from financial efficiency, credit was efficiently assigned. On the other hand, there were no difference for a company which wanted to increase its credit over assets at rate of 30% and for one company that just wanted to access just at a 5%. As we have already said, this is not the most efficient distribution of credit that we may have, which is the one with a positive relation with credit increase over total assets and current ratio. Nonetheless, there is certain coherence between the results, which shows 17.
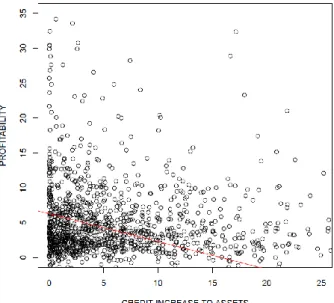
(19) that the majority of firms access to credit with a current ratio equal or higher than 1, and theory, which expects Banks to put certain limits to financial access. 4.5 Credit increase over total assets and Profitability. In the analysis of the relation between the profitability of a firm and the increase in bank loans over total assets, we try to found a relation between the ability of a firm to generate profits in relative terms with respect to their turnover, and the amount of credit in relative terms they can access. These two variables should present, according to a theoretical perfect distribution of credit, a positive relation. When banks grant any loan, they expect that the loan, as an investment, is supported by a productive structure which is able to recover the investment and generate exceeding resources, which are profits. And the empirical results for the four sectors and for all the years show that there is a slight positive relation, and mainly, we find that profitability acts as a restraining variable, as current ratio. Nonetheless, we can find that every year, in each sector, there is a small group of companies that access to credit with a negative profitability. a) Construction sector. For the construction sector there is a downward tendency along years towards a low profitability and level of bank loans over total assets granted. This tendency can be divided into two phases: before and after the economic crisis in Spain, in 2008. For the first period there is a slight downward tendency in profitability for a same level of acquired indebtedness. But, once the crisis begins in 2008, the effects are clearly felt in 2009, were the downward tendency gets sharper for both profitability and also for the amount of credit at which the companies can access. b) Manufacturing sector. For the manufacturing sector we can observe a lower average profitability at which firms can access to credit for every year in comparison with the construction sector, as well as a downward tendency, which is also joint with a higher standard deviation. This, together with a decreasing evolution of standard deviation and mean for Bank Loans increase. Illustration 11: Credit increase over total assets and profitability. 2014. Construction. 18.
(20) over assets results in an aggrupation of companies towards a same profitability at which they access to credit within a narrower range of indebtedness rate of increase.. c) Trade sector. The behavior of these variables in the trade sector also follows an upward standard deviation trend for profitability and a downward profitability mean trend. This is caused firstly by a trend of a core group of companies which has a similar value of profitability that follows a downward trend, and each on gets credit at very different relative levels. In this sense, it follows a trend towards favoring best companies. d) Services sector. The average profitability at which service’s sector companies follows a downward trend and a high and unevenness standard deviation trend, which decreases form 27.2 in 2000 to 13.05 in 2005, and then goes up and down, like for example in 2009, when is equal to 50.8, and in 2011, when is equal to 19.9. This high volatility of profitability that persists over time makes the interpretation useless to study how profitability affects the access to credit of companies. Except for construction and services sector, there is a common feature on the evolution of profitability of companies accessing to credit i.e. a downward trend of average profitability and an upward trend on its standard deviation. It implicates that, on the one hand, banks reduce standards to access to credit, although there is a wider variety of companies who do so at higher profitability, which can be interpreted as a higher selection of companies, focusing on more specific factors unrelated with profitability. To understand better the relation between both variables, it is important to consider that companies sometimes access to external funding as a fruit of a transitional situation, and not that much as a consequence of their financial structure. This means that when a company has successive losses for some years because of external factors (economic situation of the market, the country, uncertainty, and expectations) they are forced to appeal to external funding. A company with solid commercial relations, a big commercial portfolio, experience on the sector, etc. will have more facilities when asking for bank funding; as they are solid companies, regardless their transitional situation, they will probably be able to access to funding as they has an strong structure, which is able to recover. On the other hand, a young company which may be, also transitionally, obtaining profits may have difficulties to access to credit, as they are still not well positioned in the sector, or they are still in the process of development. These are common situations that we can see in any market. And it offer us a deeper understanding of the fact that for the whole period, in every sector we can find some companies that present near-to-zero and even negative profitability, and they access to credit. At last, fitting our study purpose with the empirical results found for profitability as a financial performance indicator, we can state that credit growth did not follow an efficient distribution.. 19.
(21) 5. Conclusions. The approach to how credit was distributed from an inequality and financial performance perspective let us to estate some conclusion on how the credit sector allocates their resources. The analysis of individualized indicators also let us to know how Banks assessed the features of firms. And the inequality measures let us to show in other terms that credit distribution was allocated following non-financial performance criteria. The first conclusion of this study is that Banks assigned credit without a prudential assess of financial structure of firms. That is: the leverage analysis show that banks were prone to grant loans to firms regardless their indebtedness level, increasing potential losses in case of default and disregarding the importance of this indicator as linking factor among balance sheets, and therefore of systemic risk. The study of profitability shows that trade and manufacturing follow upward trends along years, what led to a credit assignment that favored companies that were obtaining good results; on the contrary, the construction and services sectors followed a trend where there is no room to assume that Banks intended to favor companies obtaining good results. Current ratio, with a constant tendency along years and with a similar behavior for every sectors, acts for all companies as a contention barrier to credit, what is a sign of right credit assignment, although a positive relation would mean a more effective assignment. Finally, the analysis of Zscore is used as a structural financial performance indicator; this indicator sheds light in a general view of how firms that obtained credit are placed within a range of global financial performance. And the results show that a big proportion of firms, around 66% obtained credit within the range of high probability of bankruptcy and inconclusive results. From which we can conclude that Banks invested a great part of their resources on risky firms. Finally, the study of inequality let us to conclude that the size of some firm’s characteristics affect the amount of credit it is able to obtain. From this perspective we can support the results and conclusions in the financial performance analysis. The concentration of variables like total bank loans, total assets, number of employees displaces the importance of financial performance of companies when demanding funds, causing distortions on the credit market. The overall results presented and explained in this work suggest that the Spanish credit market needs a revision in order to avoid problems like the financial crisis that affected the whole world. Regulation of the financial markets is a key factor to get an efficient behavior and to adapt to an increasingly globalized and competitive environment.. 20.
(22) References. Akin, O. et al. (2014) The real estate and credit bubble: Evidence from Spain. Economics Working Paper 1430. Department of Economics and Business, Universitat Pompeu Fabra. Available at: https://ideas.repec.org/p/upf/upfgen/1430.html (Accessed: 28 May 2017). Altman, E. I. (1968) ‘Financial Ratios, Discriminant Analysis and the Prediction of Corporate Bankruptcy’, The Journal of Finance, 23(4), pp. 589–609. doi: 10.1111/j.1540-6261.1968.tb00843.x. Altman, E. I. et al. (2016) ‘Financial Distress Prediction in an International Context: A Review and Empirical Analysis of Altman’s Z-Score Model’, Journal of International Financial Management & Accounting, p. n/a-n/a. doi: 10.1111/jifm.12053. Balseven, H. (2016) ‘The Political Economy of Financial Regulation Policies Following the Global Crisis’, International Journal of Economics and Financial Issues, 6(2), pp. 607–616. Beaver, W. H. (1966) ‘Financial Ratios As Predictors of Failure’, Journal of Accounting Research, 4, pp. 71–111. doi: 10.2307/2490171. Bielsa, J. and Duarte, R. (2011) ‘Size and linkages of the Spanish construction industry: key sector or deformation of the economy?’, Cambridge Journal of Economics, 35(2), pp. 317–334. Bubb, R. and Kaufman, A. (2014) ‘Securitization and moral hazard: Evidence from credit score cutoff rules’, Journal of Monetary Economics, 63(C), pp. 1–18. Cohen-Cole, E., Duygan-Bump, B. and Montoriol-Garriga, J. (2009) Forgive and forget: who gets credit after bankruptcy and why? Risk and Policy Analysis Unit Working Paper QAU09-2. Federal Reserve Bank of Boston. Available at: https://ideas.repec.org/p/fip/fedbqu/qau09-2.html (Accessed: 28 May 2017). Eigner, P. and Umlauft, T. S. (2015) The Great Depression(s) of 1929-1933 and 2007-2009? Parallels, Differences and Policy Lessons. SSRN Scholarly Paper ID 2612243. Rochester, NY: Social Science Research Network. Available at: https://papers.ssrn.com/abstract=2612243 (Accessed: 28 May 2017). Greenwald, B. C. and Stiglitz, J. E. (1993) ‘Financial Market Imperfections and Business Cycles’, The Quarterly Journal of Economics, 108(1), pp. 77–114. Horrigan, J. O. (1968) ‘A Short History of Financial Ratio Analysis’, The Accounting Review, 43(2), pp. 284–294. Jagtiani, J. and Li, W. (2013) Credit access and credit performance after consumer bankruptcy filing: new evidence. Working Paper 13–24. Federal Reserve Bank of Philadelphia. Available at: https://ideas.repec.org/p/fip/fedpwp/13-24.html (Accessed: 28 May 2017). Malkiel, B. G. (2003) ‘The Efficient Market Hypothesis and Its Critics’, Journal of Economic Perspectives, 17(1), pp. 59–82. doi: 10.1257/089533003321164958. 21.
(23) Mathis, J., McAndrews, J. and Rochet, J.-C. (2009) ‘Rating the raters: Are reputation concerns powerful enough to discipline rating agencies?’, Journal of Monetary Economics, 56(5), pp. 657–674. Murdock, K. C., Hellmann, T. F. and Stiglitz, J. E. (2000) ‘Liberalization, Moral Hazard in Banking, and Prudential Regulation: Are Capital Requirements Enough?’, American Economic Review, 90(1), pp. 147–165. Petrovic, M., Teglio, A. and Alfarano, S. (2016) The role of bank credit allocation: Evidence from the Spanish economy. Working Paper 2016/17. Economics Department, Universitat Jaume I, Castellón (Spain). Available at: https://ideas.repec.org/p/jau/wpaper/2016-17.html (Accessed: 28 May 2017). Rajan, R. G. (2005) Has Financial Development Made the World Riskier? Working Paper 11728. National Bureau of Economic Research. doi: 10.3386/w11728. Ramírez, J. A. (1959) La Quiebra. Barcelona: Bosch. Ramos, A. and Simôes, M. (2012) Credit Rating Agencies, Finance and Growth. Book Chapters. Institute of Economic Sciences, pp. 192–207. Available at: https://ideas.repec.org/h/ibg/chaptr/euinpro-10.html (Accessed: 28 May 2017). Schwerhoff, G. and Edenhofer, O. (2014) The Globalization Paradox Revisited. CESifo Working Paper Series 4878. CESifo Group Munich. Available at: https://ideas.repec.org/p/ces/ceswps/_4878.html (Accessed: 28 May 2017). Soltani, B. (2014) ‘The Anatomy of Corporate Fraud: A Comparative Analysis of High Profile American and European Corporate Scandals’, Journal of Business Ethics, 120(2), pp. 251–274. TablaPx (no date). Available at: http://www.ine.es/jaxi/Datos.htm?path=/t38/bme2/t07/a081/l0/&file=1300010.px (Accessed: 31 May 2017).. 22.
(24)
Figure
+6
Documento similar
Through an analysis of the changes in the judo rules which took place between 2010 and 2020, we could observe the intentions of the International Judo Federation in: reducing
Through a definition of trauma and an analysis of the same in the film Cloverfield, the lack of resolution and resultant paranoia since the attacks are demonstrated, and the
The above analysis leads to an experimental scenario characterized by precise mea-.. Figure 4: The allowed region of Soffer determined from the experimental data at 4GeV 2 ,
While much of Richard Ford’s fiction thus seems to illustrate the traditional connection between masculinity and violence in American literature, his fictional works not only
We advance the hypothesis that fraudulent behaviours by finan- cial institutions are associated with substantial physical and mental health problems in the affected populations.
Using changes in manufacturing output, changes in employment in the US service and manufacturing sectors, corporate tax receipts and changes in manufacturing imports, this
The first part is devoted to the analysis of cosmological implications of hidden sectors, and uses a very simple extension of the SM through a coupling between the Higgs and a group
Distribution of the Answers in the Pre-MOOC survey regarding Participants Perspective if the challenges for Sustainable Development are of Ecological Nature.. Distribution
