Twenty years of lichen cover change in a tropical habitat (Costa Rica) and its relation with air pollution
11
0
0
Texto completo
(2) 310. REVISTA DE BIOLOGÍA TROPICAL. are correlated (Wheeler and Rolfe 1979, Rodrigo et al. 1999). For many years, there has been some debate about the relative importance of pollution and other factors associated with lichens (review in Barkman 1958, Carreras et al. 1998). Among many factors known to affect lichens are light (Plitt and Pessin 1924), and humidity (review in Barkman 1958). A detailed study in New York (Brodo 1968) showed the value of transplant experiments and basically corroborated the long list of physical factors presented by Barkman (1958), with humidity and substrate stability outstanding. Basically, the same trends are found in the tropics (JMN personal observation), but taxonomy and ecology of tropical lichens are poorly known (Sipman and Harris 1989) The importance of tree species and local climate for lichens has been postulated by some (e.g. Brodo 1968, Hurka and Winkler 1973), but criticized by others (e.g. Rominger et al. 1994). The debate led Addison (1984) to suggest that electronic monitoring is required for a reliable assessment of air condition because lichen ecology is still controversial. Sample size has also been criticized (Trass 1973). However, recent studies corroborated the value of lichens as bioindicators (McCune 1988, Rubiano 1988) and the effect of pollution on lichen biodiversity (Wetmore 1988, Ekman 1990). Pollution also has a clear effect on lichen microinvertebrate communities (Uetz et al. 1980, Stubbs 1989), but this area of investigation is mostly virgin territory. The relationship between pollution, lichen cover and lepidopteran occurrence has been debated for many years regarding industrial melanism (Bishop et al. 1975, Monge-Nájera et al. 1998) and was reported to be real but not obligatory in three tropical locations (Monge-Nájera 1988). Lichens and pollution have been studied in Latin America for half a century, first in Caracas, Venezuela by Vareschi in 1953 and then mainly in Colombia (Ibagos 1977, García and Rubiano 1984, Rubiano 1988). Besides its effect on lichens, pollution reduced the diversity of higher plants in México City (Rapoport. et al. 1983). Work in Costa Rica is going on for over 30 years. Oetjen (1965) found that foliose lichen cover increased with humidity and decreased at lower temperatures, and that it lacked a correlation with cardinal direction. Méndez and Fournier (1980) published their classical study of air pollution and lichens in the capitol city, San José, using transplants, counts of dead cells and overall lichen cover. Chemical data for the city extend back to the last 20 years (Rodríguez 1982) but lichen taxonomic knowledge is still quite limited to some groups (Lücking 1989). Using palm trees to homogenize trunk characteristics, L.D. Alfaro found that the north side, more protected from desiccation because of wind and sunlight incidence, had the greatest lichen cover (unpublished 1991 study, pers. comm.). Recent data show that air pollution in San José reached four times the recommended maximum, with a negative effect on health, buildings and tourism (Anonymous 1996). This study analyses twenty years of lichen change in the Costa Rican capital, a relatively long period for a tropical city if one considers that the longest known study in a temperate city is only three times as long (Munich: Winkler 1977).. MATERIALS AND METHODS Changes in lichen cover in an urban habitat for 20 years: Foliaceous lichen cover was measured by counting lichen occurrence in 1 cm2 squares with a 10 X 10 cm template (Méndez and Fournier 1980), positioned 1.5 m above ground on the south, east, north and west sides of ten phorophytic trees per station (11 stations) from 1976 through 1997. Annual means for San José (located 1172-1299 m above sea level) are: precipitation 2000 mm, dry season of about five months and temperature 21ºC. For more details about site, phorophyte species and method see Méndez and Fournier (1980). A critical comparison of methods and a new method are described by Monge-Nájera et al. (2001)..
(3) INTERNATIONAL JOURNAL OF TROPICAL BIOLOGY AND CONSERVATION. Cover pattern along an urban transect: To compare trends with temperate studies done along pollution transects, as well as the effect of sampling at different heights above the ground, lichen cover was also measured in a transect using a 200 point template (10 x 20 cm, Grüninger et al. 1980) in 1992 (the transect measurements were made independently of the stations study). Trunk diameter values at breast height (dbh) along the transect were: Section I, Avenue 0, very high traffic density: mean 0.49 m (range: 0.19-1.12) , N = 15 trees; Section II, Avenue 10, high traffic density: 0.35 m (0.160.62), N = 9; Section III, Los Yoses residential area, comparatively lower traffic density: 0.41 m (0.16-1.20), N = 23 (transect along the north-south axis, i.e. across avenues). Comparison with a less polluted rural habitat: In 1985, a rural station with 63 trees was studied in a relatively unpolluted area (secondary growth on pastureland, Turrúcares, Alajuela Province, Costa Rica). The region is in the Tropical Premontane Moist Forest life zone (Holdridge 1964) and potential vegetation is classified as Deciduous Lowland Forest by Gómez (1985) The mean annual precipitation is 1710-2050 mm with a prolonged dry season, and yearly temperature means range between 23-27ºC (Herrera 1985). Tree measurements: dbh 0.40 m (range 0.04-1.26), height 7.4 m (3-13). The percent cover by foliose lichens was measured with a template with 100 randomly selected points. Measurements were made on the north, south, east and west sides, both 0.5 and 1.5 m above the ground (Méndez and Fournier 1980). Voucher specimens are deposited in the Berlin and University of Costa Rica herbaria.. RESULTS Changes in lichen cover in an urban habitat for 20 years: A total of 1760 cover values were recorded, 440 for the first part of this project (published by Méndez and Fournier in 1980, see this reference also for. 311. maps and tree species) and the rest for the present part. Lichen species appear in Table 1. Variation by station: Lichen cover differed among stations and years (R-squared 0.36), but not all stations had the same trend from year to year. ANOVA significance values follow: station (p = 0.0001); year (p = 0.0001); station by year (p = 0.0001); Tree side (p = 0.0134); station by tree side (p = 0.0471); tree side by year (p = 0.3717); station by tree side by year (p = 0.9340). (Note: a standard ANOVA and a Kruskal-Wallis ANOVA produced the same results). The side of the tree, and consequently, cardinal orientation, had a lower statistical significance. Trends were not linear (R-squared always under 5%) so data were plotted for visual analysis (Figs. 1-3). For the city, the overall mean lichen cover was 23% in 1976, 12% in 1986, 9% in 1990 and 22% in 1997. There was no correlation with temperature or precipitation (Fig. 4) but the trend was clearly opposite to that of number of vehicles until Pb was eliminated from gasoline. With the exception of Paseo Colón, which has been a lichen desert since the 1986 sampling (Fig. 5), most stations suffered a large cover reduction after 1976 but improved from 1986 to 1990 (exceptions: San Bosco av. 4, Ferrocarril al Atlántico and González Lahmann, that decreased; and Otoya, where there was practically no change). From 1990 to 1997, lichen cover increased in all stations with the exception of the lichen desert station, which remained a lichen desert (Fig. 5). Effect of cardinal orientation: When all stations and years (1986-1997) are pooled, lichen covers by cardinal orientation were: west 17%, east 14%, north 13% and south 12%. We also recorded sidewalk data (N = 95) and found more cover in the east and west (i.e. street) sidewalks (Fig. 6) which suggests that pollution was lower in streets than in avenues (San José streets run north-south, avenues east-west). However, this suggestion is not supported statistically: the north differed from the south (ANOVA, p = 0.0001) but other.
(4) 312. REVISTA DE BIOLOGÍA TROPICAL. Fig. 1. Mean lichen cover (%) by side of tree trunks in several stations, San José city. Vertical lines are standard deviations, numbers near bars indicate sample size. Years 1986, 1990, 1997. E east, W west, N north, S south. Station 1 (Paseo Colón) is not illustrated because lichen counts were zero. Detailed location of stations in Fig. 5.. Fig. 2. Lichen cover (%) by side in several stations, San José city. Explanation in Fig. 1.. combinations did not differ (east vs. west p = 0.3670, north+south vs. east+west p = 0.1830). At a very small scale, water runoff tracks had more cover, especially in polluted stations (Fig. 7) and this may override the effect of pollution regarding cardinal differences in lichen cover.. Cover pattern along transect: For the transect, all factors had a significant but weak effect on cover (all Pearson correlation coefficients under 0.31 and positive), namely: transect section (p = 0.0001), height of lichens above ground (p = 0.0001), and tree trunk diameter (p = 0.0016). Overall, Section I (high.
(5) INTERNATIONAL JOURNAL OF TROPICAL BIOLOGY AND CONSERVATION. Lichen cover (%). 313. Vehicles (N). 25. 600000. 20. 500000 400000. 15. 300000 10. 200000. 5. 100000. 0. 0 Lichen cover (%). Temperature (…C). 25. 23.5. 20. 23. 15 22.5 10 22. 5. 21.5. 0 Lichen cover (%). Precipitation (mm). 25. 2000. 20. 1500. 15 1000 10 500. 5. 0. 0 1976. Fig. 3. Lichen cover (%) by side in several stations, San José city. Explanation in Fig. 1.. traffic) tended to have a low cover and Section III (low traffic) a high cover, while Section III (mid traffic) was intermediate in lichen cover (Fig. 8). Mean cover was higher 2.5 m above the ground and lower near the ground (Fig. 8). In comparison with other transect sections, data variation was lower in section II. When heights were compared among themselves, data variation was lower 0.25 m above ground. Less polluted rural station: A total of 18 tree species were found in the sample plot and. 1990. 1986. 1997. Pb reduced. Pb eliminated. 1986. 1996. Fig. 4. Lichen cover (%) versus number of vehicles, temperature and precipitation in San José city in 1976, 1986, 1990 and 1997. Pb in gasoline was reduced in 1989 and eliminated in 1996. There was no correlation between lichen cover and rain (Spearman rank correlation SRC p = 0.94), or temperature (SRC p = 0.38). For the samples taken before the elimination of Pb from fuel (gray), an inverse correlation coefficient (-0.99) between number of vehicles and lichen cover almost reaches significance (SRC p = 0.06).. sixteen lichen species were identified (Table 1). There were no significant differences in relative foliaceous lichen cover among compass directions and the two considered vertical levels (Kruskal-Wallis ANOVA, p > 0.05, Table 2).. DISCUSSION Changes in lichen cover in an urban habitat over 20 years: Paseo Colón, one of.
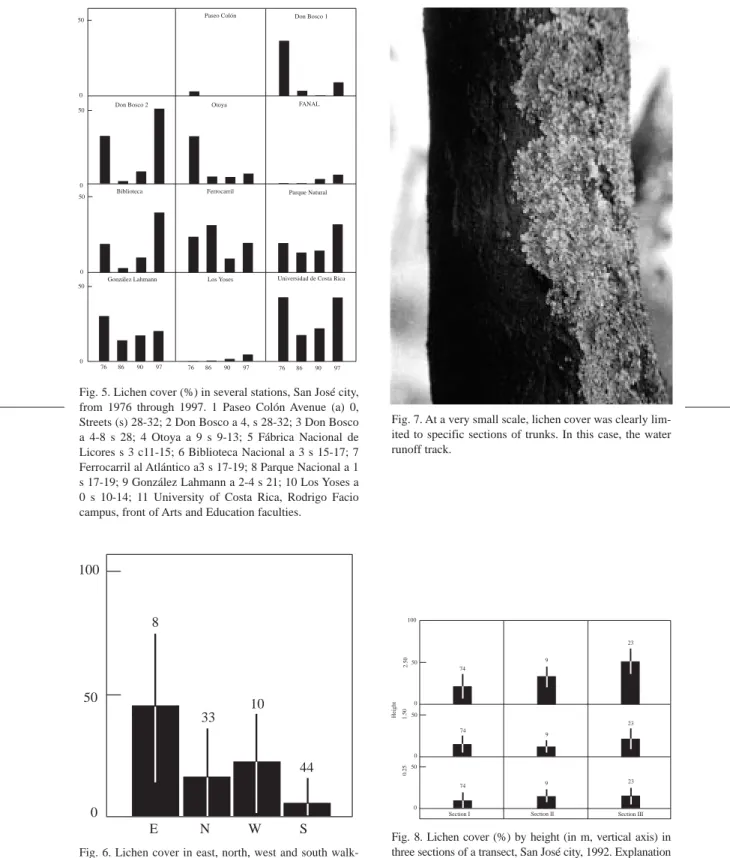
(6) 314. REVISTA DE BIOLOGÍA TROPICAL. Fig. 5. Lichen cover (%) in several stations, San José city, from 1976 through 1997. 1 Paseo Colón Avenue (a) 0, Streets (s) 28-32; 2 Don Bosco a 4, s 28-32; 3 Don Bosco a 4-8 s 28; 4 Otoya a 9 s 9-13; 5 Fábrica Nacional de Licores s 3 c11-15; 6 Biblioteca Nacional a 3 s 15-17; 7 Ferrocarril al Atlántico a3 s 17-19; 8 Parque Nacional a 1 s 17-19; 9 González Lahmann a 2-4 s 21; 10 Los Yoses a 0 s 10-14; 11 University of Costa Rica, Rodrigo Facio campus, front of Arts and Education faculties.. Fig. 7. At a very small scale, lichen cover was clearly limited to specific sections of trunks. In this case, the water runoff track.. 100. 8. 100. Height. 10 33. 2.50. 50. 1.50. 23 50. 50. 9 74. 0 23 74. 9. 0.25. 0. 44. 50 74. 9. 23. 0. 0. Section I. E. N. W. S. Fig. 6. Lichen cover in east, north, west and south walksides, San José city. Explanation in Fig. 1.. Section II. Section III. Fig. 8. Lichen cover (%) by height (in m, vertical axis) in three sections of a transect, San José city, 1992. Explanation in Fig. 1..
(7) INTERNATIONAL JOURNAL OF TROPICAL BIOLOGY AND CONSERVATION. 315. TABLE 1 Lichen species from three urban stations with varying degrees of air pollution (San José) and from the rural station (Turrúcares, Alajuela), Costa Rica San José Ciudad Universitaria Canoparmelia carneopruinata (Zahlbr.) Elix and Hale Canoparmelia texana (Tuck.) Elix and Hale Dirinaria applanata (Fée) Awas. Parmotrema hababiana (Gyelnik) Hale Biblioteca Nacional Candelaria concolor (Dicks.) B. Stein. Canoparmelia texana (Tuck.) Elix and Hale Barrio Don Bosco Candelaria concolor (Dicks.) B. Stein Canoparmelia carneopruinata (Zahlbr.) Elix and Hale Heterodermia albicans (Pers.) Swinsc. and Krog Physcia integrata Nyl. Pyxine subcinerea Stirt.. Turrúcares Arthoniaceae Cryptothecia sp.. Verrucariaceae Agonimia? (sterile) Lecanoraceae Lecanora sp. Opegraphaceae Chiodecton? (sterile) Parmeliaceae Bulbothrix laevigatula (Nyl.) Hale Parmotrema endosulphureum (Hillm.) Hale Parmotrema tinctorum (Nyl.) Hale Pseudoparmelia sphaerospora (Nyl.) Hale Pyxinaceae Dirinaria applanata (Fée) Awasthi Heterodermia albicans (Pers.) Swinsc. and Krog Hyperphyscia adglutinata (Flk.) Mayrh. and Poelt Hyperphyscia pyrithrocardia (Müller Arg.) Moberg and Aptroot Physcia atrostriata Moberg Physcia integrata Nyl. Pyxine eschweileri (Tuck.) Vainio Roccellaceae Helminthocarpon sp.. (This list probably is not comprehensive. Years of collection: San José 1988, Turrúcares 1990).. TABLE 2 Descriptive statistics for foliaceous lichen cover (%) by height and side in Turrúcares, Alajuela, Costa Rica (measured in 1985) Height and side Lower north Upper north Lower south Upper south Lower east Upper east Lower west Upper west. Mean. Standard deviation. Maximum. 5.8 4.6 3.9 4.9 7.8 5.0 4.1 5.0. 11.6 9.8 9.1 9.9 14.9 11.2 8.5 11.8. 57 46 47 55 64 65 41 59. Height above ground: Upper 1.5 m, lower 0.5 m. In all cases, minimum = 0.. the main avenues, is a lichen desert. Stations with high traffic such as Fábrica de Licores and Los Yoses (27 000-40 000 vehicles/day, years 1976-1996) had low lichen cover, while Otoya, which in 1976 was a low pollution residential area with high lichen cover, had a maximum traffic count of 18 000 vehicles/day that year. It then became part of a main public. transportation route (25 000 vehicles/day in 1990) and lost much of its lichen cover. The University of Costa Rica campus, where vehicle traffic is stringently limited and green areas dominate the scenery, has a high lichen cover (an unpublished study estimated a mean of 25 (range 0-325) lichen colonies/m2, Z. Barrientos 1987 pers. comm.). Generally, our results agree.
(8) 316. REVISTA DE BIOLOGÍA TROPICAL. with those of Méndez and Fournier (1980) with the mentioned exception of Otoya station and agree with the hypothesis that traffic, pollution and lichen cover are correlated. Heavy metal concentration can vary greatly in small distances and is highly affected by traffic details; some values for San José were published by Fournier (1993) and generally agree with our results, with the University of Costa Rica campus being the less polluted site. The improvement in recent years probably reflects the reduction in 1989 and the elimination in 1996 of Pb from gasoline (Castro 1997) as well as legislation changes that have reduced traffic bottlenecks. Air Pb concentration was 0.73 µg/m3 in 1993 and 0.23 µg/m3 in 1996. Blood Pb concentration fell from 17.5 µg/dl in 1986 to 3.8 µg/dl in 1996 (Moreno 1997, Sánchez 1997). Pollution in the city of San José was recently found to affect the fungi and bacteria of epiphytic plants (Brighigna et al. 2000). In northern temperate areas, lichen cover tends to be higher on the northern side of trees, because temperature and pH are more favorable there (Barkman 1958, Brodo 1973, Stubbs 1989). In San José, where relative air humidity is high (Gómez 1985), the highest cover is in the western side, which in this tropical city is the side that receives less sun and wind during the dry season. In this region, air moves predominantly from northeast to southwest, and wind increases in the dry season (Herrera 1985). Future work should include Santa Ana, a city west of San José, to check if pollution increases there because of air arriving from the capital. Unpublished previous studies with smaller samples have found higher covers on the northern side of palms (L.D. Alfaro C. 1991 pers. comm.) and in the northwestern side of evergreen trees (Z. Barrientos Llosa 1987 pers. comm.) and have concluded that the side protected from local wind has a higher lichen cover, as found also in Colombia and in temperate regions (Barkman 1958, Rubiano 1988). Lichens located in the windward side retain more pollutants (Malhotra and Khan 1983).. More cover was expected in the east and north sidewalks, where trees are protected from the dominant wind by buildings, but this was not the case. Rather, vehicle traffic is heavier in avenues than in streets, and this can explain why lichen cover was higher in the eastern and western sidewalks, i.e., street and not avenue sidewalks. Cover pattern along a transect: The low traffic residential section had, as expected (Wheeler and Rolfe 1979), higher lichen covers than the two high traffic sections. In other regions, epiphyte communities are not a function of trunk diameter, but thick tropical trees have more lichens apparently just because they are older (Sipman and Harris 1989). We found a weak but highly significant positive correlation of lichen cover with trunk diameter and tree height, supporting the hypothesis of Sipman and Harris (1989). The lower lichen cover values under a 2 m height differs from temperate areas where higher moisture near the ground favor lichen growth there (Brodo 1968, Eversman et al. 1987). This result could be explained by pollution because heavy metals concentrate at lower heights: in Paseo Colón, the station that is a lichen desert 2 m or less from the ground, lichens grow above 3 m (JMN pers. observ.). Unfortunately for humans, pollution concentrates near our heads except for those living above the first floor in buildings. A practical implication is that in polluted cities human activity should concentrate above the first floor of buildings (particularly in hospitals and schools). Comparison with rural station: Cover in the rural station was near the city values. Data from a period when pollution probably was lower (Oetjen 1965) show that the 22% cover measured in 1997 in San José is near the middle of its range (17-29%). In our study of the rural station, mean cover ranged from 4 to 8%, which can be considered low because, 20 years before our sampling, at the nearby site of Ciruelas de Alajuela, cover range was 7-15% (Oetjen 1965). Apparently, even this rural site has suffered significant pollution, but low values may also reflect a drier climate..
(9) INTERNATIONAL JOURNAL OF TROPICAL BIOLOGY AND CONSERVATION. The rural area sample deserves special discussion because there is little information about the spatial distribution of tropical lichens (Sipman and Harris 1989). In both temperate and tropical forests, physical factors produce a heterogeneous distribution of lichens on the phorophyte trunk (Plitt 1924, Sipman and Harris 1989). In isolated trunks (northern hemisphere), insolation increases downward while temperature increases upward (Barkman 1958) but light dominates (for varied opinions, see Barkman 1958, Haynes 1964, Brodo 1973). Humidity decreases in the higher parts of trunks and is of key importance in lichen occurrence and abundance (Barkman 1958, Brodo 1973, Eversman 1987, Sipman and Harris 1989). In our station, lichen cover was independent of height and side, even though wind blows from the northeast during the dry season, which is more straining for lichens (Barkman 1958, Brodo 1968). This result is not an anomaly: in a general survey of Costa Rica, no constant association between cover of foliaceous corticolous lichens and cardinal direction was found (Oetjen 1965). Trunk diameter, and bark texture and color were expected to have a clear influence on lichens, as occurs in temperate areas (Hale 1952, Eversman et al. 1987) but again this was not the case (Monge-Nájera 1988). A possible explanation is that these tropical lichen communities are spatially homogeneous in life form but not in taxonomical constitution. A future study of individual species distribution should test this hypothesis.. 317. Sipman also determined lichen samples. H. Sipman, L.A. Fournier (University of Costa Rica) and Artemis Papert (Geneva) commented on earlier drafts and allowed us to greatly improve the manuscript. Our thanks also to Javier López, Patricia Valverde Uzaga and Luisa Moreno for field assistance, Marisol Rodríguez for the illustrations, Isabel Vargas, Federico Corrales and Olman Ramírez (Ministerio de Obras Públicas y Transportes, Costa Rica) for traffic statistics and Zaidett Barrientos for climatic data.. RESUMEN Se analizaron los cambios en la cobertura de líquenes foliosos de troncos en la ciudad de San José, Costa Rica, de 1976 a 1997, con base en conteos de cobertura que usaron cuadrículas de 10 X 10 cm en 11 estaciones. Las coberturas medias totales fueron 23% en 1976, 12% en 1986, 9% en 1990 y 22% in 1997. Hubo un deterioro después de 1976 y una mejora a partir de 1986, al disminuir la cantidad de plomo en la gasolina y mejorarse los patrones de tránsito. La mayor cobertura se da en el lado oeste de los troncos y en las aceras de calles más transitadas. En una localidad rural estacional (Turrúcares de Alajuela) no hubo relación entre cobertura de líquenes y lado, altura sobre el suelo, y diámetro, color y textura del tronco.. REFERENCES Addison, P.A. 1984. Biomonitoring of air pollution impacts in the Athabasca Oil Sands forests. Alberta Northern Forest Res. Centre Forestry Rep. Nr. 30: 4-5. Anonymous. 1996. Más contaminación en el aire. Ambio Noticias (San José, Costa Rica) 9: 2.. ACKNOWLEDGMENTS We thank the late Sieghardt Winkler for academic advise and Luis A. Fournier O. for allowing the senior author to continue his 1976 co-project with Méndez, as well as Harrie Sipman (Berlin Herbarium), Peter Döbbeler (Munich Herbarium) and Alvaro Coto Rojas (Costa Rican Oil Company RECOPE) for their advise and support. H.. Barkman,J.J. 1958. Phytosociology and ecology of cryptogamic epiphytes. Koninlijke van Gorcum, Assen, Nederlands. 628 p. Billings,W.D. & W.B. Drew. 1938. Bark factors affecting the distribution of corticolous bryophytic communities. Amer. Midl. Natur. 20: 302-333. Bishop, J.A., L.M. Cook, J. Muggleton & M.R.D. Seaward. 1975. Moths, lichens and air pollution along a transect from Manchester to North Wales. J. Appl. Ecol. 12: 83-98..
(10) 318. REVISTA DE BIOLOGÍA TROPICAL. Brighigna, L., A. Gori, S. Gonnelli & F. Favilli. 2000. The influence of air pollution on the composition of the phyllosphere microflora of Tillandsia leaves. Rev. Biol. Trop. 48: 511-517. Brodo, I.M. 1968. The lichens of Long Island, New York: A vegetational and floristic analysis. University of the State of New York. 330 p. Brodo, I.M. 1973. Substrate ecology, p. 401-441. In V. Ahmadjian (ed.). The lichens. Academic, New York. Carreras, H.A., G.L. Gudino & M.L. Pignata. 1998. Comparative biomonitoring of atmospheric quality in five zones of Cordoba city (Argentina) employing the transplanted lichen Usnea sp. Environ. Pollut. 103: 317-325. Castro S., R. 1997. Se reduce la contaminación del aire en Costa Rica, p. 4-5. In A. Mora (comp.). Reducción de la contaminación del aire en Costa Rica. Refinadora Costarricense de Petróleo (RECOPE), San José, Costa Rica. DeSloover, J. & F. LeBlanc. 1968. Mapping atmosphere pollution on the basis of lichen sensitivity, p. 42-56. In R. Misra & B. Gopal (eds.). Proc. Symp. Recent Adv. Trop. Ecol. Varanasi, India. Ekman, S. 1990. Lavfloran i Dalby Söderskog. Svensk. Bot. Tidskr. 84: 191-198. Eversman, S., C. Johnson & D. Gustafson. 1987. Vertical distribution of epiphytic lichens on three tree species in Yellowstone National Park. The Bryologist 90: 212-216. Fournier O., L.A. 1993. Recursos naturales. Universidad Estatal a Distancia, San José, Costa Rica. 220 p. García, L.C. & L.J. Rubiano. 1984. Comunidades de líquenes como indicadores de niveles de calidad de aire en Colombia. Contam. Amb. 8(13):73-90.. Hale, M.E., Jr. 1952. Vertical distribution of cryptogams in a virgin forest in Wisconsin. Ecology 33:398-406. Haynes, F.N. 1964. Lichens, p. 64-115. In J.D. Carthy & C.L. Duddington (eds.). Viewpoints in biology (vol. 3). Butterworths, London. 260 p. Herrera, W. 1985. Clima de Costa Rica. Universidad Estatal a Distancia, San José, Costa Rica. 118 p. Holdrige, L. 1964. Life zones system. Tropical Science Center, San José, Costa Rica. 183 p. Hurka, H.V. & S. Winkler. 1973. Statistische Analyse der rindenbewohnenden Flechtenvegetation einer Allee Tübingens. Flora 162: 61-80. Ibagos, A.L. 1977. Contribución al estudio de la contaminación atmosférica en la ciudad de Bogotá. Tesis de Grado, Dpto. Biología, Universidad Nacional de Colombia, Bogotá. Jiménez-Saa, J.H. 1967. Los árboles más importantes de la región de Upala. Instituto de Tierras y Colonización, San José, Costa Rica. 211 p. Lücking, R. 1989. Foliicolous lichens - A Contribution to the knowledge of the lichen flora of Costa Rica, Central America. M.Sc. Thesis, Ulm University, Ulm, Germany. 123 p. Malhotra, S.S. & A.A. Khan. 1983. Sensitivity to SO2 of various metabolic processes in an epiphytic lichen, Evernia mesomorpha. Biochem. Physiol. Pflanzen 178: 121-130. Méndez, O. & L.A. Fournier. 1980. Los líquenes como indicadores de la contaminación atmosférica en el área metropolitana de San José, Costa Rica. Rev. Biol. Trop. 28: 31-38.. Gómez, L.D. 1985. La vegetación de Costa Rica. Universidad Estatal a Distancia, San José, Costa Rica. 283 p.. Monge-Nájera, J., F. Hernández, M.I. González, J. Soley, J.A. Pochet & S. Zolla. 1998. Spatial distribution, territoriality and sound production by tropical cryptic butterflies (Hamadryas, Lepidoptera: Nymphalidae): Implications for the “industrial melanism” debate. Rev. Biol. Trop. 46: 297-330.. Grüninger, W. & J. Monge-Nájera. 1988. Use of the temperate lichen Hypogymnia physodes (Parmeliaceae) to evaluate air pollution in the tropics. Rev. Biol. Trop. 36 (2B): 545-547.. Moreno, N. (1997). El plomo, p. 14-15. In A. Mora (comp.). Reducción de la contaminación del aire en Costa Rica. Refinadora Costarricense de Petróleo (RECOPE), San José, Costa Rica.. Grüninger,W. , E. Gruner & I. Schnitzer. 1980. Flechten und Luft Quälitat. Luftqualität in Freiräumen und Verdichtungsräumen, angezeigt durch Rindenflechten (IAP-Verfahren). Stadtverwaltung, Reutlingen, Germany.. McCune, B. 1988. Lichen communities along O3 and SO2 gradients in Indianapolis. Bryologist 91(3): 223-228. Monge-Nájera, J. 1988. Mariposas crípticas del género Hamadryas (Lepidoptera: Nymphalidae): Uso de.
(11) INTERNATIONAL JOURNAL OF TROPICAL BIOLOGY AND CONSERVATION. sustrato, territorialidad, emisión de sonido y morfología. Tesis de M.Sc., Sistema de Estudios de Posgrado, Universidad de Costa Rica. 61 p. Monge-Nájera, J., M.I. González, M. Rivas R. & V.H. Méndez-Estrada. 2001. A new method to assess air pollution using lichens as bioindicators. Rev. Biol. Trop. 50: 321-325. Oettjen, D. 1965. A study of the ecological distribution of lichens in Costa Rica. Associated Colleges the Midwest, San José, Costa Rica. 54 p. Papert, A. 1990. Bryophytes corticoles dans le canton de Genève: Apercu floristique et bioindication. Saussurea 21: 123-146. Plitt, C.C. & L.J. Pessin. 1924. A study on the effect of evaporation and light on the distribution of lichens. Bull. Torrey Club 51: 203-210. Plitt, C.C. 1924. An ecological study of lichens. Ecology 5: 95-98. Rapoport, E.H., M.E. Díaz-Betancourt & I.R. LópezMoreno. 1983. Aspectos de la ecología urbana en la ciudad de México. Flora de las calles y baldíos. Limusa, México, D.F. 197 p. Rodrigo, A., A. Ávila & A. Gómez-Bolea. 1999. Trace metal contents in Parmelia caperata (L.) Ach. compared to bulk deposition, throughfall and leafwash fluxes in two holm oak forests in Montseny (NE Spain). Atmosph. Environ. 33: 359-367. Rodríguez, J.C. 1982. Determinación de la contaminación atmosférica causada por partículas en suspensión en el Area Metropolitana de San José. Tesis de Licenciatura, Escuela de Química, Universidad de Costa Rica, San José, Costa Rica. 78 p. Rominger, E.M., L. Allen-Johnson & J.L. Oldenmeyer. 1994. Arboreal lichen in uncut and partially cut subalpine fir stands in woodland caribou habitat, north-. 319. ern Idaho and south-eastern British Columbia. Forest Ecol. Manage. 70: 195-202. Rubiano, L.J. 1988. Líquenes como indicadores de contaminación en el complejo industrial de Betonia y la termoeléctrica de Zipaquira, Cundinamarca. Acta Biol. Colomb. 1(4): 95-125. Sánchez, M. 1997. Niveles de plomo sanguíneo en población normal, p. 9-11. In A. Mora (comp.). Reducción de la contaminación del aire en Costa Rica. Refinadora Costarricense de Petróleo (RECOPE), San José, Costa Rica. Sipman, H.J.M. & R.C. Harris. 1989. Lichens, p. 303-309. In H. Lieth & M.J.A. Werger (eds.). Tropical Rain Forest ecosystems. Biogeographical and ecological studies. Elsevier, Amsterdam. 713 p. (Vol. 14B of the series: Ecosystems of the World.) Stubbs, C.S. 1989. Patterns of distribution and abundance of corticolous lichens and their invertebrate associates on Quercus rubra in Maine. Bryologist 92: 453-460. Trass, H. 1973. Lichen sensitivity to the air pollution and index of poleotolerance (I.P.). Fol. Cryptogam. Estonica 3: 19-22. Uetz, G.W., C.A. Meininger & J. Snider. 1980. Effect of air pollution on microcommunities of invertebrates in lichens and mosses. Electric Power Research Institute, Palo Alto, California. 94 p. Wetmore, C.M. 1988. Lichens and air quality in Indiana Dunes National Lakeshore. Mycotaxon 33: 25-40. Wheeler, G.L. & G.L. Rolfe. 1979. The relationship between daily traffic volume and the distribution of lead in roadside soil and vegetation. Environ. Pollut. 18: 265-274. Winkler, S. 1977. Flechten und Moose als Bioindikatoren, p. 155-176. In W. Frey, H. Hurka & F. Oberwinkler (eds.). Beiträge zur Biologie der niedern Pflanzen. Fischer, Stuttgart, Germany.. Editor: José A. Vargas.
(12)
Figure


Documento similar
The accumulation of viral proteins ICP4, VP16 and gC was analysed by immunoblotting in SK-N-MC cells simultaneously treated with X-XOD and infected with HSV-1 at a moi of 1 and 10
Considering LCC A as the Land Cover Component for land cover class A, and LCC B as the Land Cover Component for land cover class B, Equation 1 is transformed into
Thus, the aim of this study was to (i) determine the effect of the cover management techniques (grazing, mowing and tillage) on the floristic composition in the cover vegetation
Los resultados de la revisión sistemática y metaanálisis (trabajo: González-Moles, M. Association of oral lichen planus with hepatic disorders and hepatocellular carcinoma:
The expansionary monetary policy measures have had a negative impact on net interest margins both via the reduction in interest rates and –less powerfully- the flattening of the
Jointly estimate this entry game with several outcome equations (fees/rates, credit limits) for bank accounts, credit cards and lines of credit. Use simulation methods to
In our sample, 2890 deals were issued by less reputable underwriters (i.e. a weighted syndication underwriting reputation share below the share of the 7 th largest underwriter
Variables used in DCA were coverage of each plant species found in plots and vegetation cover of three strata (barren soil, herbaceous, and shrub) using the data obtained with
