Catastrophic expenditure in health and income elasticities by item of expenditure in health services in Mexico
25
0
0
Texto completo
(2)
(3) WELL-BEING AND SOCIAL POLICY VOL 2, NUM. 1, pp. 47-69. CATASTROPHIC EXPENDITURE IN HEALTH AND INCOME ELASTICITIES BY ITEM OF EXPENDITURE IN HEALTH SERVICES IN MEXICO Carlos Cruz Rivero Department of Economics, Universidad Iberoamericana carlos.cruz@uia.mx. Gabriela A. Luna Ruiz Department of Economics, Universidad Iberoamericana gabriela.luna@uia.mx. Raquel Morales Barrera Department of Economics, Universidad Iberoamericana raquel.morales@uia.mx. Carlo G. Coello Levet Department of Economics, Universidad Iberoamericana carlo.coello@cfe.gob.mx. Abstract. T. he objective of this article is to put in economic perspective the expenditure in health within the pattern of family expenditure of the Mexican households. Information of the National Survey on Income Expenditure of Households (ENIGH) of Mexico of 2004 is analyzed on: structure of the expenditure of the households, expenditure in health and income-expenditure elasticities in health; by quintiles of income and to the condition of insurance in health. It is revealed that the poorest households in Mexico do not rely on their structure of expenditure to support out of the pocket expenses in health, reason why an unexpected event of disease places the families at risk of impoverishment, sale of assets or indebtedness. Other results are the elasticities that were obtained by condition of insurance, quintile of income and type of expenditure; and that there are basic services in health that the Mexican population perceives as if they were luxury goods, among them the orthopedic, dental care and hospitalization. It is emphasized that the income elasticities found can serve as baseline measurement of the effectiveness of the Popular Insurance of Health just orchestrated on the modification of the pattern of family expenditure on health for the first quintiles of income. Key words: health expenditure, insurance, catastrophic expenditure, income elasticities. Classification JEL: A12, C13, C51, I19.. 47.
(4) CATASTROPHIC EXPENDITURE IN HEALTH AND INCOME ELASTICITIES BY ITEM OF EXPENDITURE IN HEALTH SERVICES IN MEXICO. Introduction. M. exico is the tenth more important economy of the world in relation to the economic weight of its Gross Domestic Product (GDP), but in this same indicator at per capita level it’s located as the second poorer country of the Organization for the Economic Co-operation and Development (OECD, 2005). This is a country that lives a double transition: on one hand, the demographic characterized by an aging phenomena, smaller proportions of infantile population and a fall in the fertility rate; and secondly an epidemiological transition, where transmissible diseases related to epidemiological lags coexist with emergent and chronic degenerative illnesses and injuries. Mexico displayed in 2001 an uneven distribution of income, with a Gini Coefficient of 54.6; where 10% of the poorest population took as much as 1% of the income, whereas 10% of the richest population monopolized 43% (World Bank, 2005). In 2002 Mexico destined 6.1% of its GDP to health and the public financing corresponded only to 44.9% of the total, this percentage is the lowest in the OECD countries. Also, Mexico has the highest participation of out-of-pocket expenditures to finance health, with more than 50% (OECD, 2005). So the main source to finance health services in Mexico are out-of-pocket expenses, which are highly unfair and place families in a highly impoverishment risk, due to the following characteristics: 1) unexpected expenditure can catch unaware families and sometimes they don’t have economic sufficiency to face it; 2) health expenditure is often unavoidable; 3) the expenditure sometimes is foreseeable but unavoidable (i.e. expenditure by pregnancy and childbirth); 4) it could occur a permanent expenditure, when chronic sufferings are involved; 5) expenditure in the private sector could take place due to dissatisfaction with the services received from public agencies; and finally, 6) can be due to abuses in a market of health services slightly or badly regulated. Given that Mexico does not count with a universal coverage insurance for health, in which half of the population must finance health services out-of-pocket; in addition, insured population can be dissatisfied with the quality of services and choose the private sector , being forced to pay directly for these services; and finally in many occasions due to information asymmetries, induction of the demand and the development of a non-regulated market, abuses appear systematically and the population pays much more than a fair rate. Likewise, Mexico occupied in 2000 the place number 144 of 191 countries in an index of “Justice and Fairness in the Financial Contribution”. This indicator measures the excessive contributions of the household for the financing of the health which place households in permanent risk of impoverishment (WHO, 2000). The private expenditure in health has been identified as a factor of impoverishment for the households that are excluded from the health system; be it for not having access to social security or for not having economic means to pay out-of-pocket for health services in case of disease. Thus, this reveals a health system in which the most economically vulnerable individuals, that is to say, those that aren’t health insured for not having stable labour condition, are forced to pay of their own pocket the expenditures for health services, restricting the access to those who can pay them and excluding the poorest members of the society, otherwise the necessity to. 48.
(5) WELL-BEING AND SOCIAL POLICY VOL 2, NUM. 1, pp. 47-69. access them will cause them to become indebted or impoverished with the sale of the few assets they possess. It must be recognized that indeed the lower deciles of income, receive the lowest benefits from advanced payment systems, associated to formal employment (social security), in addition to the limited access to the subsidized services that are located in zones with high concentration of public services. However, it’s worth to clarifying that this situation has began correction with the Social Protection in Health System and the Popular Health Insurance that began operations in 2004 (Diario Oficial de la Federación, 2003). Given the problematic just exposed, the study object of the present document is to point out the importance of the private expenditure in health that becomes catastrophic expenditure, as well as identifying its main determinants taking into account not only economic and demographic characteristic of the households but the different health services that are demanded; also the income elasticities by diverse health services and quintiles of income in Mexico, its characteristics and possible repercussions are open to exploration. The relevance of this document is that discusses the catastrophic expenditure in Mexico in a more detailed way than most papers in this kind of topics (Parker and Wong, 1997; Torres and Knaul, 2002; Arreola et al, 2004) which considered studying the total population, instead this paper takes account of the population that didn’t reported expenditure in health due to a lack of access or good health. In this document denominators are changed using as sample only those households that made effective demand of health services or drugs, which will derive interesting implications, because it will clarify that the health care related expenses are a main cause of poverty. In Mexico, other works that calculates the elasticities for health services, aren’t generally acknowledged. Only a previous work considered total elasticities but it didn’t differentiate services (Parker and Wong, 1997), and in a second case, elasticities of the non-demand for health services was considered (Arreola et al, 2004). So, a suitable knowledge of the income elasticity of the different health services would make it possible to implement actions to take care of necessities in health that are not served yet, and to clarify the view of the effects of generating a social protection system which guards population against the risk of falling in catastrophic expenses due to health reasons; pointing out measures that would positively affect the indices of poverty and inequality, problems that concern so much Mexican population. The document is organized as follows: in first instance a general description of the economic, demographic and health context is offered, as well as a theoretical frame with the purpose of explaining the relevance of catastrophic expenditures and income elasticities. Secondly, an econometric analysis proceeds by presenting descriptive data on the structure of households expenditure by income level and use of health services, calculated on the Mexican National Survey on Households Income-Expenditure (ENIGH) 2004, as well as econometric criteria for sampling and modeling this data. Finally, the most relevant results and conclusions in terms of public policies are presented.. 49.
(6) CATASTROPHIC EXPENDITURE IN HEALTH AND INCOME ELASTICITIES BY ITEM OF EXPENDITURE IN HEALTH SERVICES IN MEXICO. 1. Background and Socioeconomic Context Mexico has a territorial extension of 1’964,375square kilometers (INEGI 2006), with a population over 100 million inhabitants; it was in 2003 the 10th economy of the world in terms of Gross National Income with more than 637 billion dollars and an annual Gross National Income per capita of 8,980 dollars (World Bank, 2005). This last number is a signal, since Mexcio occupied in 2003 intenationally the place number 80, that allows two reflections: first, the economy as a whole enjoys a good position due to the size of itspopulation, than because its productivity and competitiveness levels and second, the deficient opportunities for human capital development in the economy is remarkable; this can be observed in position 53 (0.802*) in the “Human Development Index”, that undertakes elements relative to education, health and income simultaneously (UNDP, 2004). Mexico is a large economy with financial and fiscal contradictions that only deteriorate the human capital in the economy; Mexico collects in taxes just 15.4% of the GDP which still below economies with similar characteristics like Brazil (21.2%), Argentina (18.1%) or Chile (17.9%) (Banco de México, 2003). This situation, produces that the public financing for health services in Mexico be insufficient, unfair and inefficient, since the total expenditure in health as percentage of the GDP is 6.1%, of which only 44.9% are public resources and the rest is private expenditure, fundamentally out-of-pocket (WHO, 2005), which can represent a catastrophic expenditure1 becoming a cause of impoverishment (Murray and Frenk, 2000). Another aspect of the Mexican economy that stands out is that in 2004 almost 18 million people lived with less than two dollars per day, that is to say, 17.3% of the population in Mexico lived in conditions of “Nourishing Poverty” (insufficient income to cover the necessities of feeding). Moreover, 24.6% of the population (25,653,956 people) lived in situation of “Capacities Poverty” (insufficient income to cover the necessities of feeding, education and health) and 47% in situation of “Patrimonial Poverty” (insufficient income to cover the necessities of feeding, education, health, dress, footwear, housing and public transport) 2. The high level of poverty has important repercussions in the field of health, because in many occasions the only asset that the poor have is their body and if it’s deteriorated, the individual sinks in a poverty trap, of which it’s very difficult to escape from (Sachs, 2002). Consequently, it is important to remember that an increase in the life quality of the poor must imply an improvement in determinants of health and the enhancement of life styles, self-care and health care provided by the system.. * The HDI captures 3 dimensions to measure human development: life expectancy when being born, weighted education and GDP per capita. High levels of HDI are equal or above 0.8; medium levels HDI between 0,5 and 0.799; low levels of HDI, smaller than 0.499. 1 Catastrophic Expenditure refers to the expenditure that households have to make and sets them in a situation of risk of impoverishment, when the unplanned expenditure in health exceeds 30%, after discounting the expenditure in foods and housing. 2 See “Medición de la Pobreza 2002 – 2004. Comité Técnico para la Medición de la Pobreza en México.” June 14, 2005.. 50.
(7) WELL-BEING AND SOCIAL POLICY VOL 2, NUM. 1, pp. 47-69. Then, it is important to remember that health must be considered a merit public good, so that the demand considerations that emerge are dealt and analyzed with a clear differentiation from “the conventional” demand concept. Since the demand for health services is a derivation from the health demand of the individual, the consumer not only passively acquires health in the market, but produces it (Folland et al, 2000), which means that the deficiency of health, or the presence of disease, is what determines the demand for health services (Torres and Knaul, 2002). This leads to the idea that individual health care demand is irregular and unpredictable, because it is impossible to determine when will the disease appear, so this leads to the idea tha uncertainty is a characteristic of the demand for health services (Cárcamo, 1990). Out-of-pocket expenditure is the only alternative to finance medical care demands for non-insured population, and also is the only option that’s left to the population with public insurance unsatisfied with the services received; this means catastrophic effects when households doesn’t count with enough resources and must resort the sale of assets or to indebtedness. Unfortunately these situations are difficult to quantify because loans are often informal, the usury and second hand markets, are also events that are not sufficiently documented nor quantified in representative surveys. In order to understand the context in which catastrophic expenditure in health occurs, it’s relevant to review results of the World Health Organization in 1999, in which Mexico had its worst indicator in the fairness of the financial contribution, occupying place 144. The financial contribution of the households (FCH) is an indicator that measures the percentage of the capacity of payment destined to the expenditure in health. The percentage of households with catastrophic expenses measures the proportion of households in risk of impoverishment as a result of not planned health expenses. When the FCH exceeds 30% (FCH=.30), then households incur in which has been called catastrophic expenses in health (Murray and Frenk, 2000). The form to make the pertinent calculation is: CFH i =. Health exp enditure Ability to pay. That is calculated in the following way3:. Catastrophic expenditure=monthly expenditures in health services disposable expenditure. where: disposable expenditure=total expenditures-(food+housing). 3 From the original equation proposed by Murray and Frenk, only taxes were not taken into account to calculate the payment capacity, this is to avoid the possible double accountability of them, in which it is possible to incur given the way they are reported at the ENIGH; differently from the paper of Knaul (2005) who only took into account the total income minus food.. 51.
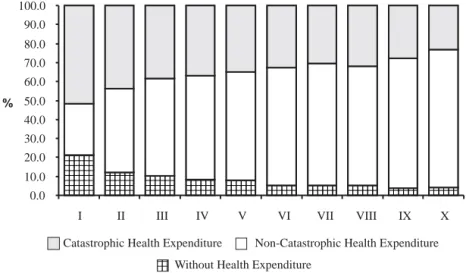
(8) CATASTROPHIC EXPENDITURE IN HEALTH AND INCOME ELASTICITIES BY ITEM OF EXPENDITURE IN HEALTH SERVICES IN MEXICO. So the financial situation of the Mexican households in 2004, has changed recently because in 2004 the Popular Health Insurance and the Social Health Protection System began operations. Before explaining in detail health expenditure and catastrophic expenditure, it is worth saying that there is a great proportion of population that reports zero out-of-pocket expenditure in health, and this presents a new paradox as presented in Figure 1: the first quintiles of income, in which the most important part of disease weigh falls on those that have greater “non expenditure in health”. This evidence reflects that the poorest households excluded themselves from the health system in the function of an economic barrier, and not because they have a good state of health. This reflects the constant postponement of medical attention that sooner or later will reach them and will generate a catastrophic expenditure. Figure 1 Percentage of Households with Health Expenditure, Catastrophic Health Expenditure and without Health Expenditure, by Decile of Income (ENIGH, 2004) 100.0 90.0 80.0 70.0 60.0. % 50.0 40.0 30.0 20.0 10.0 0.0. aaaaaa aaaaaa aaaaaa aaaaaa aaaaaa aaaaaa aaaaaa aaaaaa aaaaaa. aaaaaa aaaaaa aaaaaa aaaaaa aaaaaa. aaaaaa aaaaaa aaaaaa aaaaaa. aaaaaa aaaaaa aaaaaa aaaaaa. aaaaaa aaaaaa aaaaaa aaaaaa. aaaaaa aaaaaa aaaaaa. aaaaaa aaaaaa aaaaaa. I. II. III. IV. V. VI. VII. Catastrophic Health Expenditure aaa aaa Without aaa. aaaaaa aaaaaa aaaaaa. VIII. aaaaaa aaaaaa. aaaaaa aaaaaa. IX. X. Non-Catastrophic Health Expenditure. Health Expenditure. Source: INEGI, National Survey of Income and Expenses of the Households (ENIGH), 2004. Own elaboration.. Figure 2 describes by income level for 2004, what was the percentage of households that presented catastrophic expenses taking as denominator the total of Mexican households (regardless of whether they have reported expenditure in health in the ENIGH), independently of their condition of insurance, locality size or any other type of variable (Cruz et al, 2006a). It is observed that in 2004 for the first income decile, the national risk for a household to incur a catastrophic expense was 11%. The national risk average 5.3% and generally the risk of incurring catastrophic expenditures for health reasons increased as the household was poorer.. 52.
(9) WELL-BEING AND SOCIAL POLICY VOL 2, NUM. 1, pp. 47-69. If catastrophic expenditure in health for the total of the Mexican households is analyzed, the indicator obtained gives account of the “National Impoverishment Risk for Medical Attention” and it states the situation of economic risk at a national level, as well as the percentage of households that in order to access health care had to become indebted, selling patrimony or in extreme cases to steal, situations which can make them fall in a “poverty trap”. An alternative way to analyze the problem, is when a different denominator is used. Instead of considering total Mexican households, let us only consider those households that reported heath expenditures; that is to say, the catastrophic expenses only for the households that reported health expenditure at the time of ENIGH’s surveying (Figure 3). Under this perspective, the percentage of households with patients who required attention that registered catastrophic expenditure was 21.5% for the first income decile; this means that at least one of every three of the poorest households with patients declared in 2004, had a health expenditure implying impoverishing repercussions. The situation for second decile is also dramatic since 12.3% of the households with expenditure in health had a catastrophic expenditure. The national average of households that were forced to spend in health and incurred in a catastrophic expenditure, independently of their income level was of 7.9%, then a highly contrasting is seen in the difference of the proportion of households with catastrophic expenditure, between the first decile (21.5%) and tenth decile (4%). Given this evidence, it becomes particularly relevant to look for the determinants of catastrophic expenditure and probability of its incidence. The estimations of the present document differ, from official numbers, since calculation denominators change. Here we calculate the percentage of households with catastrophic expenditure from households that report some type of expenditure in health. This excludes from the analysis the households that didn’t report health expenditures. The goal is to clear that the approach to services related to health as a factor of impoverishment of the families. Figure 2 Percentage of Households at National Level with Catastrophic Health Expenditure by Decile of Income (ENIGH, 2004) (denominator: total mexican households) 12.0 10.0 8.0 % 6.0 4.0 2.0 0.0. 11.0. 6.9. 6.7 5.2. I. II. III. IV. 5.3. 5.3. V. 3.6. 3.9. 4.0. VI. VII. V III. 2.9. IX. 3.2. X National Average. Decile of Income Note: Impoverishment National Risk by Medical Attention Measures the Economic Risk situation at National Level of falling in or “Poverty Trap”, loss of wealth caused by out of pocket expenditure in health that mexican households face.. 53.
(10) CATASTROPHIC EXPENDITURE IN HEALTH AND INCOME ELASTICITIES BY ITEM OF EXPENDITURE IN HEALTH SERVICES IN MEXICO. Figure 3 Percentage of Households with Health Expenditure that Suffered Catastrophic Health Expenditure by Decile of Income (ENIGH, 2004) (denominator: total of mexican households with health expenditure) 30 25 20. 21.5. % 15 12.3. 10. 10.4. 8.3. 7.9. 7.9. 5. 5.2. 5.3. 5.5 3.90. 4.0. VII VIII IX. X. 0 I. II. III. IV. V. VI. Total. Decile. Note: Indicator: Impoverishment National Risk of Households with declared or pregnant members Measures the Economic Risk situation at National Level of falling in or “Poverty Trap”, loss of wealth caused by out of pocket expenditure in health that mexican households face.. The elasticity measures reaction of the demand with respect to the change in prices or income. That is to say, given a change of a 1% in prices or income, the elasticity measures in what percentage is the demand affected (Parkin, 2005). Given the definition of price demand elasticity, the change in the price not only affects the demand of a specific good, but also the demand for other goods that have some type of relation as complements or substitutes. There are then direct influences, but also cross-effects via prices and via income. The price effects are determined by the complementariness and the substitution possibility that exist between the goods, and the income effect, as how the variation of prices affects disposable income. In other words, if the price of a good raises and if the household insists on consuming it, there is a reduction of the income available for the consumption of other goods. For example, the payment of health services forces the families with lower income to quit consuming other fundamental goods, like education and foods. It is recognized that health expenditure has particular characteristics, this arises that health alterations are unexpected and accessing to the health system could be unaffordable in spite of all the costs that an unexpected demand brings. In addition, it must be recognized that given the low prevention culture in Mexico, the most vulnerable households access health services when the disease is in advanced phases and cost of the treatment is higher.. 54.
(11) WELL-BEING AND SOCIAL POLICY VOL 2, NUM. 1, pp. 47-69. In order to measure the sensitivity of the demand by goods as opposed to variations in the income of the individuals, the elasticity income concept is used (η Y ): percentage in which the demanded amount of a good varies when the income of the consumer varies in one percent. This definition, following Folland (2000) allows us to categorize the goods in the following way: • In inferior goods, η Y is negative ( η Y <0) since the increase of income causes a contraction of its demand. • Luxury goods have a high (η Y >1) since the variations in the income cause great variations in the demanded amount. • The goods of first necessity, unlike the inferior goods, have a positive , but smaller than one (0<η Y <1), that is to say, its demand is inelastic with respect to the income. • The normal goods will show a unitary income elasticity (η Y =1), that is to say their demand will increase approximately in the same proportion than the income of the individuals. Calculation of price elasticities for health services have a special feature, in countries as Mexico whose system of health has a very important component of public services, it’s complicated to calculate price elasticities, since there is an important part of the services for which a unitary price cannot be assigned. Thus we cannot have an explicit measurement of the cross effects of demand after changes in prices, because it’s complicated to find substitutes and sufficient theoretical arguments to justify measurements of complementary services in health. For this reason income elasticities have to be calculated, this is of special relevance because this will allow to identify whether the Mexican population perceives health services as a luxury, a necessity or a normal good (Getzen, 2000), through different income levels and elasticities for the different health services. When the behavior of a population that have insurance is observed, income elasticities approaches zero, whereas in countries in which the out-of-pocket health expenditure is high, the income elasticity is larger than one; this way the perception of health as a luxury good has spurred an ethical debate (Getzen, 2000). In this work income elasticity estimations take househols as unit of analysis, and this type of “individual” elasticities are characteristically smaller than the expenditure in medical attention elasticities at national aggregated level (Rossi and Triunfo, 2004). General characteristics of health services demand, already exposed, supports the idea that a greater consumption (and production) of health offers higher utility to individuals (Grossman, 1972). Two theoretical affirmations exist that would be desirable to verify empirically: • Health services demand is inelastic in relation to prices. There are certain states of disease, that force individuals to consume health services independently of the price that they have (Torres and Knaul, 2002); when the price of health services is zero (financed totality via taxes), then the disposition to pay is pronounced like willingness to wait to receive attention, and for this reason the price that would affect the demand health services is the cost of time (Williams, 1978). • Health has to be considered as a normal good. Nevertheless, it is recognized that change percentage in the demanded amount given a change percentage in population’s income can be variable. A complete compilation of works where income elasticity calculations are made was carried out. 55.
(12) CATASTROPHIC EXPENDITURE IN HEALTH AND INCOME ELASTICITIES BY ITEM OF EXPENDITURE IN HEALTH SERVICES IN MEXICO. 2. Material and Methods The data base that is used in the present work is the National Survey of Income and Expenditure of Households (ENIGH) 2004, which is representative at national level and by zone of residence. The survey includes social, demographic, and labor indicators (condition of employment and income) of each one of the members of the household, as well as the characteristics of the house and the expenditure at household level. The ENIGH has a multi-stage and stratified design, for that reason the results samples can be projected to all the population of the country. It is possible to emphasize that we take solely the population that has expenditure in health, those households that report zero expenditure in health were not considered in the sample throughout the study. In the survey a total of 72 types of expenditure in health is detailed, and those are grouped in 10 categories: medical insurance, medical services, dental services, drugs prescribed and not prescribed, hospital attention, medical attention during the pregnancy and childbirth, orthopedic devices, and alternative medicine. The variables that are used to make the empirical analysis throughout the document are: • Expenditure in Health: Dependent variable that incorporates the total expenditure in health made by the households; in this variable, ten categories of expenditure are grouped. • Condition of Insurance: Dichotomizing explanatory variable that take the value of 1 if the head of the household have some type of insurance 4 (public or private) and zero other wise. This variable is used to differentiate the potential impacts that a change in the income has, mainly between the households that do not have insurance. • Quintile: Discrete multi-valued independent variable. The quintiles of income, calculated on quarterly income of the household (transformed to monthly income), are obtained when ordering the population, from the household with lower income to the one than has the highest income. After having this ordering, it divides the population in five equal groups.5 20% of the poorest households represent the first quintile6 (Q1), and the 20% richer belong to the last quintile or Q5. The following variables are used solely for the model of estimation of the catastrophic expenditure. • Catastrophic expenditure: Dichotomizing dependent variable that takes the value of one if the proportion of expenditure in health is greater to 0.3 or zero otherwise. • Under two years: Independent variable that takes values between zero and one, because is constructed dividing the number of under two years in the household over the number of members that form the household. This is an index variable.. 4. The insurance is provided by: IMSS, ISSSTE, PEMEX, University Insurance or Private Insurance. Estimated on family income, given that health expenditure are also calculated at household level and it is supposed that is not the family head the only one who has an income, but each household is controlled by number of older than 65 years old and under 2 years old. This methodology is like Torres and Knaul, except that in this document the quarterly income is converted to monthly income in order to soft income curve. 6 To estimate the model this quintile is eliminated since it will be the one of reference. 5. 56.
(13) WELL-BEING AND SOCIAL POLICY VOL 2, NUM. 1, pp. 47-69. • Elderly: Independent variable that takes values between zero and one, and that is constructed dividing the number of members of the family older than 65 years in the household over the total members of the household. • Number of disabled: Independent variable that divides the number of disabled by the number of members of the household. • Schooling: It is a continuous independent variable that measures the years of schooling of the head of the household. • Insurance: Dichotomizing independent variable that takes the value of one if the household head has some type of insurance (public or private) and zero otherwise. • Place of residence: Dichotomizing independent variable that denotes the location of the residence of the household, takes the value from 1 if it is in an urban zone and zero if it is in the countryside.. 2.1 Model of probability of incurring catastrophic expenditure The catastrophic expenditure is an event that happens when the expenditure in health as proportion of the total expenditure of the household is greater to 0.3 (WHO, 2005). The occurrence of this event implies a trade-off between the items of expenditure and the expenditure in health, modifying its pattern of consumption. The problem worsens when the households do not have some type of insurance; this causes that they themselves finance the events of disease and in some occasions this expenditure leads them to lose part of their patrimony or to become indebted. Thus, the probability of incurring catastrophic expenditure is based on a series of own characteristics of the households like: proportion of children and older adults, because the state of health of these is more delicate than the one of other groups of age; other very important factors are the wealth of the household; the place of residence and the condition of insurance. In order to model the probability of occurrence of the catastrophic expenditure the method of Ordinary Least Squares is inefficient because the probabilities anticipated by this model, are in some cases, below zero or above one, violating one of the axioms of the probability theory. In order to avoid that situation the Probit model is used (Collin and Pravin, 1998), since the dependent variable is discrete. The probit model is based on a regression that contains a latent variable y* whose relation can be expressed of the following way:. yi* = x ' i β + u i. (1). The latent variable is a continuous variable but unobservable. From this exposition the variable is observed under the following condition:. yi = x ' i β + ui. with. yi = 1. with. yi = 0. 57. if. y *i > a. if. y ≤a * i. (2).
(14) CATASTROPHIC EXPENDITURE IN HEALTH AND INCOME ELASTICITIES BY ITEM OF EXPENDITURE IN HEALTH SERVICES IN MEXICO. In this models the probability that the household incurs (or does not incur) in catastrophic expenditure is distributed as an accumulated normal, reason why the expected value of y given x is:. E [ y x ] = 0 [1 − Φ ( β ′x ) ] + 1[Φ ( β ′x ) ] = Φ ( β ′x ). (3). Given this nonlinear relation, the best method of estimation is Maximum Likelihood and the marginal effects are not the coefficients of regression, but the discreet change in the dependent variable due to a change in the explanatory variable, evaluated generally in average or the other point sample. The equation is the following7:. ∂E [ y x ] ⎧ dF ( β ′x ) ⎫ =⎨ ⎬ β = φ ( β ′x ) β ∂x ⎩ d ( β ′x ) ⎭. (4). In the present work, the dependent variable is a dichotomic variable that shows if the household incurred or not in catastrophic expenditure. The value a for the equation (2) is 0.3 and the latent variable is the expenditure in health like proportion of the total expenditure of the household (variable continuous in rank zero and one). In order to specify the functional form and to describe the relation between the expenditure, or in this case the demand for health service and the income of the households, we decided to use a double-log function where the logarithm of G is the total expenditure in health by the families and Y is the quarterly income measured as monthly average. The resulting elasticity if the condition of insurance is considered or not is (Pereyra et al, 2003).. 2.2 Specification of the model of income elasticities in health services The composition of the basket of consumer goods depends on the income level of the households, in such a way that the demand of goods is a function of the income level, the prices and the preferences. In this document a strong assumption with respect to demand is that the demand of health services is established through the use of these services (provided by the public or private sector) being shaped in the expenditure that these make, and it is considered as an approximation to the consumption of this good. Only effective demand is considered, the one that is realized in the market, after the individual access the health system according to its budgetary restriction tariff at the point of service and the infrastructure available and according to its degree of necessity and degree of aversion (this category is the analogous one to use). Potential demand nor to the repressed demand are not considered (Madueño, 2002). For that reason the sample is limited to take 57% or 14,625 households (Cruz et al, 2006a) that reported expenditure in health during the period and is formulated an equation of the expenditure. 7. Models of dichotomy dependant variable are treated in an adecuate and extensive way in Greene (2003) and Wooldridge(2002).. 58.
(15) WELL-BEING AND SOCIAL POLICY VOL 2, NUM. 1, pp. 47-69. in health, having adopted the logarithmic of the expenses and the income to avoid a possible nonlinearity in the parameters:8. log GSTi = α + β 2 log Q1i + β 3 logQ2i + β 4 logQ4i + β 5 log Q5 i + Aseg + ε i Where, log GST is the logarithm of the total expenditure in health, Q is each one of the quintiles of income, Aseg is the condition of insurance of the family heads andis the error term. The data can be used to make estimations of the different items, for example, the elasticity income in medical services during the pregnancy, in general medical services, in prescribed drugs, etc.. log GMR i = α + β 2 log Q1i + β 3 log Q2 i + β 4 logQ4i + β 5 log Q5i + Aseg + ε i For this case the dependent variable is expenditure in prescribed drugs.. 3. Results 3.1 Composition of family expenditure by deciles (2004) The analysis of the composition of the family expenditure by deciles, according to data of ENIGH 2004, identifies the structure that governs the patterns of expenditure-consumption in the Mexican households; through the main items of expenditure, such as: transport (public and private), cleaning, communication, personal care, education, culture and recreation, housing, clothes, footwear, accessories, health, equipment, arts and relaxation, transport, food and others. This allows to have a descriptive monograph of the distribution of the economic resources in the activities of the Mexican households, for each one of the deciles of income, which allows to have evidence of the severe budgetary restriction that the Mexican families face and the null slack that they have to have expenses in health care, always unexpected. It is observed for the ENIGH of 2004, in the Table 1, that by decile of income, the monthly item of expenditure of the households that has greater impact is food, that has a participation in the total monthly expenditure of more of 40%; in fact for the first decile in more than 59%, whereas for the tenth decile it is located in 22%; it is shown then that the food item plays a preponderant role within the structure of family expenditure. The expenditure in housing has the second place in the percentage composition of the total expenditure of the households, with a participation that oscillates between 7.6 and 10.8%. The. l og Y i = l og β 1 + β 2 l og X i + μ i , where log is the natural logarithm of variable X and the variable y. When the assumptions of the model of linear regression are met, the parameters of the model can be obtained through ordinary least squares (OLS) considering Y i* = α + β 2* X *i + μ i where Y i* = log Y i y X *i = log X i and the estimators obtained by OLS, α ˆ and βˆ 2 will be the best linear unbiased estimators of α and β 2 respectively. 8. 59.
(16) CATASTROPHIC EXPENDITURE IN HEALTH AND INCOME ELASTICITIES BY ITEM OF EXPENDITURE IN HEALTH SERVICES IN MEXICO Table 1 Percentage Composition of Average Household Montly Expenditure, ENIGH- Mexico 2004 Decile. Quintile Concept. I. II. III. IV. V. I. X. Health. 5.4. 4.5. 4.2. 4.5. 4.7. 5.7. 4.9. 4.6. Foods. 41.5. 35.8. 26.0. 59.4. 22.2. 40.0. Average. 55.5. 46.6. Public transport. 4.8. 6.9. 6.8. 6.2. 3.1. 4.0. 1.8. 5.5. Personal care. 5.1. 5.7. 5.6. 5.3. 4.3. 4.8. 3.9. 5.2. Cleaning. 4.6. 3.9. 3.6. 3.5. 4.4. 4.9. 5.2. 4.0. Education, Cult. Rec. Communications. 3.3 3.0. 5.6 5.0. 6.6 7.0. 8.6 9.2. 12.2 11.5. 2.9 2.1. 13.8 11.6. 7.6 7.5. Housing Clothes. 8.8 5.1. 10.3 5.7. 10.8 6.1. 10.4 6.6. 9.3 6.5. 7.6 5.0. 8.9 6.4. 9.9 6.1. Glasswork. 0.6. 0.7. 0.7. 0.6. 0.8. 0.6. 0.6. 0.6. Domestic appliances. 1.1. 1.6. 2.1. 2.4. 3.2. 0.9. 3.3. 2.2. Articles of relaxation. 0.3. 0.6. 0.6. 0.9. 1.2. 0.2. 1.3. 0.7. Transport. 1.1. 1.2. 1.6. 2.3. 5.7. 1.0. 7.0. 2.5. Other expenses. 1.3. 1.9. 2.8. 3.7. 7.3. 0.9. 8.9. 3.6. 100.0. 100.0. 100.0. 100.0. 100.0 100.0. 100.0. 100.0. Source: INEGI, National Survey of Income and Expenditure of Households (ENIGH) 2004 and Cruz et al (2006). *Prices of 2002.. same happens with the expenditure destined to cloth, footwear and accessories, that oscillates between 5 and 6.5%. It is worth mentioning that the greater percentage of expenditure in clothes, footwear and accessories is reported in the last deciles of income. In the items of education, culture and recreation appears one of the greatest differences by decile of income since while in first decile it represented 2.9%, in the tenth decile it was 13.8%. This makes evident the necessity to fortify the policies that have as objective the investment in human capital, since the poor do not count on the possibility of destining more resources to its improvement. Finally, the percentage destined to the expenditure in health care is between 4.2 and 5.7%; these percentages will be detailed in following paragraphs. From the composition of the family expenditure in Mexico is concluded that: the poor households live to eat, to pay the rent and to resolve inescapable expenses and they do not can afford other type of additional expenditure, much less a expenditure with high impoverishing and catastrophic potentialities like the expenditure in health; whereas the rich households present a. 60.
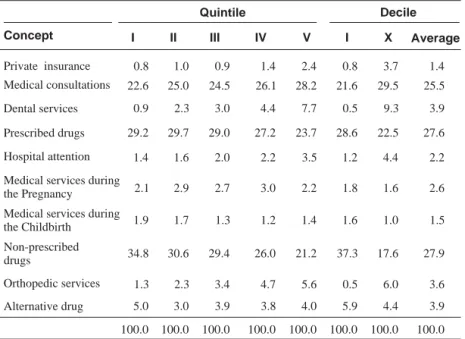
(17) WELL-BEING AND SOCIAL POLICY VOL 2, NUM. 1, pp. 47-69. structure of expenditure much more balanced and they can afford additional expenses to improve human capital through education or health. If the structure of the expenditure in health is detailed it is possible to observe which of the items of expenditure in health care affect the current expenditure of the families more. Table 2 illustrates three items of out-of-pocket expenditure in health care that almost represent the totality of the expenditure in health: “non-prescribed drugs”, “prescribed drugs” and “medical consultations” whereas other items like “hospital attention”, “services”, “medical services during the pregnancy and childbirth”, “private insurance”, “alternative medicine”, “orthopedic devices” and “dental services” had a minor percentage participation in the out-ofpocket expenditure in health. For the first four deciles the expenditure in “prescribed drugs” did not represent in 2004 more of 30%; whereas the expenditure in “prescribed drugs” oscillated around 30%. The expenditure in “ambulatory consultation” represented between 21.6 and 39.5% of the monthly average expenditure in health.. Table 2 Percentage Composition of Average Montly Expenditure by items of Health Expenditure Decile. Quintile Concept Private insurance. I. II. III. IV. V. I. X. Average. 0.8. 1.0. 0.9. 1.4. 2.4. 0.8. 3.7. 1.4. 22.6. 25.0. 24.5. 26.1. 28.2. 21.6. 29.5. 25.5. Dental services. 0.9. 2.3. 3.0. 4.4. 7.7. 0.5. 9.3. 3.9. Prescribed drugs. 29.2. 29.7. 29.0. 27.2. 23.7. 28.6. 22.5. 27.6. Hospital attention. 1.4. 1.6. 2.0. 2.2. 3.5. 1.2. 4.4. 2.2. Medical services during the Pregnancy. 2.1. 2.9. 2.7. 3.0. 2.2. 1.8. 1.6. 2.6. Medical services during the Childbirth. 1.9. 1.7. 1.3. 1.2. 1.4. 1.6. 1.0. 1.5. 34.8. 30.6. 29.4. 26.0. 21.2. 37.3. 17.6. 27.9. Medical consultations. Non-prescribed drugs Orthopedic services. 1.3. 2.3. 3.4. 4.7. 5.6. 0.5. 6.0. 3.6. Alternative drug. 5.0. 3.0. 3.9. 3.8. 4.0. 5.9. 4.4. 3.9. 100.0. 100.0. 100.0. 100.0. 100.0. 100.0. 100.0. 100.0. Source: INEGI, National Survey of Income and Expenditure of Households (ENIGH) 2004 and Cruz, et al (2006). *Prices of 2002.. 61.
(18) CATASTROPHIC EXPENDITURE IN HEALTH AND INCOME ELASTICITIES BY ITEM OF EXPENDITURE IN HEALTH SERVICES IN MEXICO. It is also observed that the expenditure in “orthopedic devices” is smaller than 0.6% for the first decile, whereas as we advance in the deciles the expenditure destined to this item increases. The expenditure in “dental services” presented a similar behavior in its participation to the total expenditure in health, because it is not a priority of the households of the first deciles and it has a greater weight or importance for the last deciles.. 3.2 Estimation of catastrophic expenditure In Table 3 the results of the estimation of the standard probit model used conventionally to estimate the catastrophic expenditure are showed (Murria et al, 2000). The marginal coefficients of regression and effects are reported, calculated in the average samples of the variables. In the first column appear the names of the explanatory variables of the model, in the second column appear the regression results for all the households; columns 3 and 4 contain the regression results for the households with and without some type of insurance, respectively. In the results of the regression all the households are considered. It is observed that for an increase of 1% in the proportion of older adults, and 1% in the proportion of children under two years old in the household, the probability of incurring catastrophic expenditure increases respectively in 6% and 11%. This is justified because both children and older adults register the greater incidence of diseases and higher mortality rates, in addition, these age groups do not belong to the economically active population. For those reasons the probability of incurring catastrophic expenditure is greater for households with children and older adults. For the same variables it is observed that households without insurance face much higher than risk of incurring catastrophic expenditure households with insurance: 4% in insured households and 7% of not insured for the proportion of older adults; and 0.02% and 15% for the proportion of children. This allows us to verify that insurance is a factor of protection as far as the probability of incurring catastrophic expenditure for the households that have among their members children and older adults is reduced. In relation to the catastrophic expenditure by zone of residence, we found that people who live in urban zones have a smaller probability of incurring catastrophic expenditure that people who live in the countryside. The rural localities, are at a disadvantage with respect to the urban zones, with a 2% higher probability of incurring catastrophic expenditure, explained in part because, they are typically far from of health centers, which implies a expenditure in transport or expenses on private health services. In relation to probability of incurring catastrophic expenditure and the number of disabled in the household, it is possible to observe that a positive relation between these variables exists: the probability of incurring catastrophic expenditure by each additional disabled in the household, increases in 3%, when distinguishing by condition of insurance, and it is also observed that the uninsured have a 4% probability of incurring catastrophic expenditure, in comparison with 1.4% of the insured. These results can be considered underestimations for this variable, if taken into account that the ENIGH only considers as disabled persons older than 12 years, specifically in the question on the causes of non-work.. 62.
(19) WELL-BEING AND SOCIAL POLICY VOL 2, NUM. 1, pp. 47-69 Table 3 Probability of Incurring Catastrophic Expenditure in Mexico Dependent variable: With Catastrophic Expenditure = 1 All the Households. Insured. Uninsured. Proportion of older than 65 years. 0.7183***. 0.9083***. 0.7038***. Marginal effects. 0.0597631. 0.0411381. 0.074424. 1.4044***. 1.4764***. 1.3815***. 0.1168475. -0.0024038. 0.146083. 0.3916***. -0.3208. 0.4202***. Proportion of minors of 2 years Marginal effects Number of Disabled Marginal effects. 0.0325822. -0.0145296. 0.0444289. Years of Schooling. -0.0144***. -0.0001. -0.0176***. Marginal effects. -0.0011995. -2.79e-06. -0.0153607. It has some type of Insurance. -0.3025***. -0.0510. -0.1384***. Marginal effects. -0.0118904. Countryside. -0.1341***. Marginal effects. -0.0229142. 0.06687. -0.0018624. Constant. -1.6150***. -2.1328***. -1.5927***. 22,198. 6,915. 15,283. Number of observations. *significant to 90%; ** significant to 95%; *** significant to 99%. The relation between the probability of catastrophic expenditure and the years of schooling is negative because the risk of incurring catastrophic expenditure diminishes with every additional year of schooling: the probability is higher for the uninsured with 1.5%, against the 0.3% of the insured. This is explained because a person with education is more conscious of the risk of not taking care of her health and in addition she has greater probabilities of obtaining higher income, in agreement with the theory of human capital. With respect to the probability of incurring catastrophic expenditure and the condition of insurance it is observed that the insured households have a smaller probability of 1.2% of incurring catastrophic expenditure that the households without insurance. This is explained because the insurance allows to partially cover the expenditures for health services, which represents an advantage with respect to the uninsured households; nevertheless this percentage is not as high as it would be expected since the population has a bad perception of the health services offered by the IMSS, ISSSTE, etc. and prefers to go to private services and to buy drugs in private pharmacies; for that reason it is needed to improve the public provided services to avoid the out-of-pocket expenditure.. 63.
(20) CATASTROPHIC EXPENDITURE IN HEALTH AND INCOME ELASTICITIES BY ITEM OF EXPENDITURE IN HEALTH SERVICES IN MEXICO. 3.3 Income elasticities by item of health As it was already explained, to measure how much the consumption of a good is modified given an increase in income resorts to the calculation of the elasticity, that is defined as the percentage change of the amount demanded divided by the percentage change of the income; and the values obtained of this estimation will help to classify the health services in: inferior, inelastic (of first necessity), normal and luxury goods; according to the behavior of demand on the part of the population, that is to say, the population perception of them. In Table 4 the results of the estimation appear using a double logarithmic model, similar to the one used by Parker and Wong (1997) with the purpose of considering the income elasticities of the demand for diverse health services. The coefficients of regression and the value of the statistical t are reported to verify the significance of the variables. In the columns are the quintiles of income grouped by condition of insurance and in the rows the different regressions for each of the items of health care. It is worth mentioning that to obtain this estimation, the sample is strictly that one that made some type of expenditure in health. In the first line it is shown the general estimation of health services, that is to say, households that spent in any service related to health. When the coefficient of the total income elasticity (0.73) is compared with the estimation of Parker and Wong (1997), the number is found to be very similar to what they obtained for low income insured people (0.79); it is possible to infer from this data that health is considered a good of first necessity, for that reason it is inelastic. This first result uses general data that does not give much information to enrich the analysis; however if the totals by quintile of income are compared, depending on the condition of insurance, this is consistent with the behavior that they obtained since the health services for the first two quintiles is perceived as a basic one, for the wealthier quintiles it is perceived as a luxury, because after positive variations in income they will demand more and improve services. The elasticities for the uninsured population are lower. The “condition of insurance” has effects on the structure and the type of out-of-pocket expenditure in health. For example, the first quintile of the insured population, does not perceive the medical services during childbirth as an inferior one (-0.103), that is to say, if its income increases 1% this would reduce its expenditure in this type of services nearly 10%, whereas for this same quintile but with insurance the attention during the childbirth is a basic one (0.28). Although none of these results is significant, the sign is relevant to predict differences in its behavior, since the third quintile is the one of reference. The attention to childbirth behaves like a necessary service registering elasticities between zero and one, all of them statistically significant; in general higher for the population that does not have insurance. In “dental services” the coefficient is not statistical significant for the first quintile since in these levels of income almost no expenses are registered; the most vulnerable economically delay indefinitely issues of dental health, whereas in higher quintiles of income this is perceived as a good of luxury (growth in income means more and better care is taken), but in greater magnitude for the population noninsured, for the Q5 with insurance has an elasticity of 1.45 elasticity for the uninsured it increases to 2.07.. 64.
(21) WELL-BEING AND SOCIAL POLICY VOL 2, NUM. 1, pp. 47-69 Table 4 Income Elasticities by Type of Expenditure in Health Services, Condition of Insurance, Quintile of Income Insured Elasticities. Total. Q1. Q2. Q4. Uninsured Q5. Total. Q1. Q2. Q4. Q5. Total. Total expenditure. 0.730*** 0.330*** 0.598*** 1.473 *** 2.257*** 0.913*** 0.219*** 0.78 2*** 1.44 3*** 2.141*** 0.680*** (-4.52) (-8.65) (-21.55) (-43.23) (-52.69) (-5.88) (-5.35) (-7.28) (-20.03) (-31.13) (-17.05). External consults. 0.648*** 0.529*** 0.589*** 1.541*** 2.264*** 0.874*** 0.470*** 0.782 *** 1.424*** 2.097 *** 0.58 2*** (-4.13) (-7.71) (-19.48) (-32.34) (-41.49) (-3.52) (-18.4) (-27.83) (-10.17) 4.78 (-7.44). Dental services. 0.547*** (-12.82). Prescribed drugs Hospital attention Medical services during pregnancy Medical services during childbirth. 0.40 (-29.36) 0.584 (-7.81). 0 (.). 0.316** (-2.41). 1.163 (-0.84). 1.451** 0.394*** (-2.56) (-5.4). 0.656 (-1.61). 0.757 (-1.39). 1.319 ** 2.079*** 0.614 *** (-2.05) (-7.36) (-11.6). 0.705** 0.735*** 1.270*** 1.728*** 0.508*** 0.668*** 0.881*** 1.284 *** 1.721 *** 0.372*** (-2.51) (-3.53) (-4.26) (-12.06) (-18) (-7.37) (-2.59) (-5.92) (-14.59) (-23.74) 0.244 (-0.45). 0.34 (-0.95). 0.472***. 1.273. 0.952. (-9.09). (-0.7). (-0.18). 0.926***. 0.280. 0.726. (-11.01). (-1). (-0.46). 0.944 (-0.2). 1.021 (-0.07). 1.462** 1.954*** 0.494*** 0.289***. 0.687**. 1.101 (-0.22). (-2.14). 1.44 0.463*** (-1.06) (-2.61). (-4.41). (-4.9). (-4.46). (-2.02). 1.569** 2.32 1*** 0.608*** (-2.2) (-5.37) (-7.35) 1.313 * 1.331** 0.464*** (-1.93). 1.337 2.694*** 0.014***. -0.103. 0.577. 1.339. (-3.49). (-4.39). (-1.62). (-1.14). (-0.65). (-5.3). (-2.02). (-7.66). 2.09 4 0.898*** (-3.7). (-9.68). Non-prescribed 0.415*** 0.567*** 0.716*** 1.189*** 1.576*** 0.463*** 0.555*** 0.818*** 1.232*** 1.671 *** 0.401*** drugs (-3.4) (-4.09) (-11.38) (-22.74) (-27.12) (-3.65) (-2.83) (-8.82) (-14.81) (-8.83) 3.64 Orthopedic sevices. 0.500***. 0.572. 0.802. (-11.54). (-0.89). (-0.91). Alternative drug. 0.398*** (-10.51). 0.134*. 0.806. (-1.81). (-0.76). 1.078 1.724***. 0.525. 0.37. 0.633 **. (-4.8). (-7.41). (-3.05). (-2.13). 1.305 1.702*** 0.473***. 0.643**. 0.871. (-2.5). (-0.83). (-0.47). (-1.62). (-3.99). (-5.63). 1.27 4* 1.472*** 0.489*** (-1.76). (-3.12). (-8.86). 1.187 1.801 *** 0.381 *** (-1.21). (-5.48). (-8.9). Absolute value of t-statistic in parenthesis. * significant to 90%; ** significant to 95%; *** significant to 99% The Q3 is taken as the quintile of reference.. The behavior of the elasticity income of the “external consultation” also shows very low elasticities in the order of 0.5 for the first quintile with insurance behaving like either a necessary one, whereas for 4th and 5th quintile with insurance the elasticities are of 1.5 and 2.2 respectively, behaving like a luxury; the same pattern is observed for not insured. This situation shows that the poor delay as much as they can the attention, by lack of economic means and take care of their demands only when they become inescapable. Wealthier people invest more in them because they perceive expenditure as a greater opportunity to maintain the quality of life. Another explanatory factor could be that the rich ones are willing to pay more and go to private services because of the valuation of the expenditures associated to times of delay, transfer and treatment. The elasticities calculated for drugs prescribed seemed not to have differences with respect to condition of insurance. Both first quintiles treat this expenditure as necessity (between 0.6 and 0.8), whereas the high quintiles perceive them like luxury goods (between 1.2 and 1.73), which also 65.
(22) CATASTROPHIC EXPENDITURE IN HEALTH AND INCOME ELASTICITIES BY ITEM OF EXPENDITURE IN HEALTH SERVICES IN MEXICO. brings the explanation that the poor consume essential drugs or when pains forces them, whereas the population with greater economic possibilities buys complex and expensive drugs for more and integral treatments that cure, rehabilitate and relieves the patients. The expenditure in “hospital attention” is the one that more reflects the differentiation by condition of insurance since while for the insured population no estimator is significant, for the uninsured population we distinguish two behaviors. For the poor this is not significant since they do not access these services in the private medicine, whereas for the two highest quintiles this is perceived as a luxury good, with the implications explained before. With respect to expenses in “orthopedic devices” the elasticity for the quintile of upper income is only significant since this is the only one that demands this type of goods. Those of low income are excluded more from his consumption, explained more by the price than by the lacking of need. However, even for the Q5 these behave like luxury goods. Finally in the “Expenditure of alternative medicine”, the only significant elasticities appear for the extreme quintiles, being a service of luxury for the fifth quintile, independently of condition of insurance. For example, demanding services of chiropractors or homeopaths; whereas it can be a basic service for the first quintile that will go to remedies and herb treatments.. 4. Conclusions The analysis made in this document emphasizes that for Mexican households there is no slack in the family budget. The expenditure in foods and housing leaves restricted the household surplus of expenditure , so that doesn’t leave allowance for another type of additional expenses, specially expenses with explosive and unexpected potential like the ones required for medical attention; and given the extreme budgetary restriction, when inescapable medical attention demands arise, families consume their savings, sell assets or acquire debt, with a high risk of falling in a poverty trap due to catastrophic expenses in health services. The analysis of out-of-pocket expenditure not only highlights the very well known financial inequality, but it is aimed the identification of mechanisms through which it is possible to protect the most economically vulnerable, given that, possible alterations in their state of health require a minimum of financial protection is guaranteed. It must be recognized that the lowest quintiles of income receive less real benefits from advanced payment systems, associated to the use (social security). The out-of-pocket expenditures, are essentially curative and of low effectiveness and quality, this expenditures are not destined to prevention and they contribute to the impoverishment of the families. Unfortunately in Mexico, this situation not only appears in households excluded from the social security in health, because the insured also carry out-of-pocket expenses due to dissatisfaction with health services demanded or a bad perception of public services. A result that is indicative of the poor operation of the Mexican Health System is that for many health services its behavior is perceived like a luxury good, when health must be considered a basic element for the development of countries and the keystone for the accumulation of human capital. In this subject there is much to do in terms of public policy, because it is clear that health necessities are underserved for nearly 60% of the population. It is necessary to reframe the question. 66.
(23) WELL-BEING AND SOCIAL POLICY VOL 2, NUM. 1, pp. 47-69. of whether the more effective intervention expenditure is to increase the expenditure per capita in health or to equalize visits to the doctor of the poor against the richest quintile, since they can be spending in excess or overmedicating themselves. Perhaps the greater impact in the perception of health like a normal good will come from educative campaigns, expansion of childbirth care, improvements in feeding, etc. It shall be considered that to have a change in the financing scheme of health services, where the public insurance of the poorest was extended, would significantly contribute to modify income elasticities of the observed health services. The income elasticities presented in this study are for 2004, date when the Social Protection Health System and the Popular Insurance started operations, and considering that these paradigmatic changes in the National Health System will display their effects in the medium term, the obtained income elasticities could be considered as a baseline values from which it would be possible to monitor advances. In order to attack the problem financial fairness, catastrophic expenses and alterations of the income elasticities for medical services in Mexico, it would be recommended to act in two fronts: First, to focus interventions in order to generate indispensable citizen rights for all Mexicans regarding universal primary health attention, guaranteeing a package of benefits and effective expenditure financed by the social quota of the State, so that families would not have to resort to out-of-pocket expenditure to access the more effective and high externality interventions, as well as guaranteeing free portability of access to family medicine between institutions. As well, a social pact should take place, in order to finance with public and social funds the Health System and to expand the Popular Health Insurance, in order to cover integrally with primary attention and specialized attention more than 25 million of Mexican that lived in 2004 in conditions of capacities poverty. The social pact in health would also have to cover integrally the vulnerable groups, giving priority to the adults older than 65 years and to 10 million people who live with some level of disability. Strategies as the universal coverage of the elderly and the disabled would have to be included as priorities of public policy. Finally, it is necessary to add to the strategies of health access opportunities equality services of effective quality and equality of trajectories, in order to attack problems of bad quality or bad perception of public services directed to the insured, so they don’t have to spend from their pockets in the private sector.. 67.
(24) CATASTROPHIC EXPENDITURE IN HEALTH AND INCOME ELASTICITIES BY ITEM OF EXPENDITURE IN HEALTH SERVICES IN MEXICO. References. INEGI. Numeralia. Mexico: Instituto Nacional de Estadística, Geografía e Informática . Available online at: www.inegi.gob.mx (consulted on March 27, 2006).. Arreola, Héctor, Herman Soto and Juan Garduño. “Los Determinantes de la No Demanda de Atención a la Salud en México.” In Caleidoscopio de la salud. Mexico City: Fundación Mexicana para la Salud, 2003.. Knaul, Felicia and Héctor Arreola-Ornelas. “Protección Financiera en Salud: México, 1992-2004.” Salud Pública de México 47, (2005): 430-439.. Banco de México. “Un Comparativo Internacional de la Recaudación Tributaria.” Presentation of Banco de México, México City, May 21, 2003.. Madueño, Miguel. “Perú: Estudio de Demanda de Servicios de Salud.” Working Paper 1. Lima: Socios para la reforma del sector salud, Abt Associates, Inc., 2002.. Cárcamo, Juan Manuel. La Intervención del Estado en el Mercado de Servicios de Atención Médica en México. Su Problemática y Perspectivas. Thesis Advisor: Juan Carlos Belausteguigoitia. Mexico City: Department of Economics, ITAM, 1990.. Murray, Cristopher and Julio Frenk. “Encuesta Nacional de Evaluación del Desempeño. Protección Financiera.” Mexico City: Dirección General de Evaluación del Desempeño-SSA, 2000.. Colin, Cameron and Trivedi Pravin. Regression Analysis of Count Data. First edition. Cambridge: Cambridge University Press, 1998.. OECD. Estudios de la OCDE sobre los Sistemas de Salud México. Paris: Organisation for Economic Cooperation and Development, 2005.. Cruz, Carlos, Gabriela Luna, Omar Stabridis, Carlo Coello, Cristina Mexicano and Raquel Morales. “Políticas Públicas Sectoriales e Intersectoriales para Mejorar los Niveles de Salud: El Financiamiento Público, las Políticas Intersectoriales y la Salud.” Department of Economics Working Paper. Mexico City: Universidad Iberoamericana, 2006. In press.. Parker, Susan and Rebeca Wong. “Household Income and Health Care Expenditures in Mexico.” Health Policy 40, no. 3 (1997): 237-255. Parkin, Michael. Principios de Economía. México: Pearson, 2005. Pereyra, Andrés, Máximo Rossi and Patricia Triunfo. “El Gasto en Cuidados Médicos de las Familias Uruguayas.” Trimestre Económico 70, no. 1 (2003).. Diario Oficial de la Federación. Decreto por el que se Reforma y Adicional la Ley General de Salud en Materia de Protección Social en Salud. Mexico City: Diario Oficial de la Federación, May 15, 2003.. PNUD. Informe del Desarrollo Humano 2003. Washington, D.C.: Programa de Naciones Unidas para el Desarrollo, 2004.. Folland, Sherman, Allen Goodman and Miron Stand. The Economics of Health and Health Care. Third edition. Pearson-Prentice Hall, 2000.. Rossi, Máximo and Patricia Triunfo. “Gastar en Cuidados Médicos: ¿Es un Lujo para los Montevideanos?.” Working Paper 06/04. Montevideo: Facultad de Ciencias Sociales, Departamento de Economía, Universidad de la República, 2004.. Getzen, Thomas E. “Health Care is an Individual Necessity and a National Luxury: Applying Multilevel Decision Models to the Analysis of Health Care Expenditures.” Journal of Health Economics 19. (2000): 259-270.. Sachs, Jeffrey. Improving Health Outcomes of the Poor. Geneva: Commission on Macroeconomics and Health, World Health Organization, 2002.. Greene, William. Econometric Analysis. Fifth edition. New York: Prentice-Hall, 2003.. Torres, Ana Cristina. Análisis del Gasto de Bolsillo en Salud en México. Thesis Advisor: Dra. Felicia Knaul. Mexico City: Department of Economics, ITAM, 2002.. Grossman, Michael. “A Stock Approach to the Demand for Health” In The Demand For Health: A Theoretical and Empirical Investigation. Edited by M. Grossman. New York and London: NBER, Columbia University Press, 1972.. 68.
(25) WELL-BEING AND SOCIAL POLICY VOL 2, NUM. 1, pp. 47-69 WHO. The World Health Report 2000. Geneva: World Health Organization, 2000. WHO. The World Health Report 2004. Geneva: World Health Organization, 2004. WHO. The World Health Report 2005. Geneva: World Health Organization, 2005. Williams, Alan. “Need: an Economic Exegesis”. In Economic Aspects Of Health Services. Edited by A.J. Culyer and K.G. Wright. London: Martin Robertson Editors, 1978. Wooldridge, John. Introducción a la Econometría: Un Enfoque Moderno. Thomson, 2001. World Bank. World Development Indicators 2005. Washington D.C.: World Bank, 2005.. 69.
(26)
Figure
Documento similar
The horizontal axis shows total expenditure in % of GDP, the vertical axis reflects economic performance as measured by real output growth, per capital GDP (PPP)
The coefficients of the proxy for household income are negative for kerosene, solar and others implying that with an increase in income, households are less likely to
The expansionary monetary policy measures have had a negative impact on net interest margins both via the reduction in interest rates and –less powerfully- the flattening of the
Jointly estimate this entry game with several outcome equations (fees/rates, credit limits) for bank accounts, credit cards and lines of credit. Use simulation methods to
In our sample, 2890 deals were issued by less reputable underwriters (i.e. a weighted syndication underwriting reputation share below the share of the 7 th largest underwriter
In the “big picture” perspective of the recent years that we have described in Brazil, Spain, Portugal and Puerto Rico there are some similarities and important differences,
• GPs do not usually uniformly communicate the progression of the community infectious diseases, mainly in respiratory tract infections.. • GPs are in the best position to
In this paper we measure the degree of income related inequality in mental health as measured by the GHQ instrument and general health as measured by the EQOL-5D instrument for
