Assessing soil water repellency of a sandy field
with visible near infrared spectroscopy
Article
in
Journal of Near Infrared Spectroscopy · December 2015
DOI: 10.1255/jnirs.1188
CITATIONS
3
READS
97
6 authors, including:
Some of the authors of this publication are also working on these related projects:
WEBSOC
View project
Soil architecture and its role in colloid transport
View project
Maria Knadel
Aarhus University
42PUBLICATIONS
302CITATIONS
SEE PROFILE
Federico Masis Melendez
Costa Rican Institute of Technology (ITCR)
8PUBLICATIONS
16CITATIONS
SEE PROFILE
Lis Wollesen de Jonge
Aarhus University
223PUBLICATIONS
3,606CITATIONS
SEE PROFILE
Emmanuel Arthur
Aarhus University
75PUBLICATIONS
401CITATIONS
SEE PROFILE
All content following this page was uploaded by
Maria Knadel
on 08 August 2016.
JOURNAL OF NEAR INFRARED SPECTROSCOPY
215
ISSN: 0967-0335 © IM Publications LLP 2015
doi: 10.1255/jnirs.1188 All rights reserved
Assessing soil water repellency of a sandy
field with visible near infrared spectroscopy
Maria Knadel,
a* Federico Masís-Meléndez,
bLis Wollesen de Jonge,
aPer Moldrup,
cEmmanuel Arthur
aand
Mogens Humlekrog Greve
aaDepartment of Agroecology, Faculty of Science and Technology, Aarhus University, Blichers Allé 20, PO Box 50, DK-8830 Tjele, Denmark.
E-mail: [email protected]
bCosta Rica Institute of Technology (Instituto Tecnologico de Costa Rica, TEC), Cartago 30101, Costa Rica cDepartment of Civil Engineering, Aalborg University, Sofiendalsvej 11, DK-9200 Aalborg SV, Denmark
Soil water repellency (WR) is a widespread phenomenon caused by aggregated organic matter (OM) and layers of hydrophobic organic substances coating the surface of soil particles. These substances have a very low surface free energy, reducing a soil’s water attraction. There is focus on WR due to its effects on germination, root growth, liquid–vapour dynamics, surface erosion and leaching of chemi-cals through fingered flow paths. However, common techniques for measuring WR are time-consuming and expensive. Meanwhile, it is well established that visible near infrared (vis-NIR) spectroscopy is a reliable method for determining soil OM. Potentially it could therefore provide fast measurements of WR through autocorrelation with OM. The aim of this study was to test the feasibility of vis-NIR spectroscopy for estimating the WR of soils with a small gradient in soil organic carbon (SOC) and texture, and to evaluate the effect of soil pretreatment on the predictive ability of WR models. A total of 87 soil samples from an agricultural coarse sandy field in Denmark were analysed for SOC, particle size fractions, water content and WR. Soil samples were scanned with a vis-NIR sensor (350–2500 nm) after air- and oven-drying at 60°C and 105°C. WR, expressed as liquid surface tension (mN m−1), was determined using the molarity of
ethanol droplet test. Partial least squares regression models of SOC, texture and water content showed no predictive ability (r2 values
between 0.10 and 0.51). However, successful models (r2 = 0.85) were generated for WR. The majority of bands important in the vis-NIR
region of WR models were related to different components of OM indicating that, across the investigated field, WR was related to specific hydrophobic components of soil OM rather than to the total amount of carbon. A lower prediction error of the WR model for soils dried at 105°C (1.93 mN m−1) than at 60°C (2.52 mN m−1) can be explained by a lower range of WR values for the soils dried at 105°C. Moreover, a
higher temperature reduced the number of absorption bands related to OM, indicating a degradation of hydrocarbon groups and a more hydrophobic character of the soil.
Keywords: vis-NIR spectroscopy, PLSR, soil WR, liquid surface tensions
Introduction
Soil water repellency (WR) or hydrophobicity is a global phenomenon with a huge impact on soil hydraulic proper-ties such as infiltration, evaporation, erosion and preferential flow.1 WR occurs on low-energy surfaces with weak attrac-tions between water molecules of the solid–liquid interface.2 Coating of mineral surfaces by organic substances (e.g. root exudates, microbial by-products and decomposed organic
matter) and the presence of aggregate organic matter are the primary causes of WR.3–5
In most cases, strong correlations between soil organic matter (OM) and WR have been reported.6,7 In some cases, no correlation was found at all,8,9 indicating that both quantity and quality (composition) of OM determines the degree of WR. For instance, a high diversity of different organic components such M. Knadel et al., J. Near Infrared Spectrosc. 24, 215–224 (2016)
Received: 7 May 2015 n Revised: 25 November 2015 n Accepted: 10 December 2015 n Publication: 15 December 2015
as humic, aliphatic and fatty acid structures or plant debris is associated with a pronounced WR.10,11
Further, the effect of soil drying temperature on potential WR is far from being understood.12 However, it is clear that oven-drying results in an increased hydrophobic character of soils,13,14 thus emphasising the importance of temperature pretreatment for WR determination.12 Moreover, studies on the effect of soil burning reported not only OM but also clay fractions as responsible for developing the hydrophobicity in soil.15,16
Soil WR can be determined with techniques such as the water drop penetration time test, molarity of ethanol droplet (MED) test, intrinsic sorptivity method, capillary rise method (CRM), sessile drop method (SDM) or sessile drop contact angle and Wilhelmy plate method (WPM).12,17 Most of these techniques are either difficult to use (intrinsic sorptivity), time-consuming (SDM and WPM), overestimate WR (CRM) or do not allow subcritical WR (MED) to be quantified.12,17,18 Additionally, most of the techniques are challenged by both the chem-ical heterogeneity and surface roughness of the soil, which strongly limit their effectiveness.
Because of these challenges, an alternative technique for rapid determination of WR will be beneficial for various research disciplines. The new method should provide fast and reliable estimates of WR, facilitating the acquisition of highly dense data necessary for a better understanding of the causes and the consequences of this phenomenon in different soil types and across different scales.
Diffuse reflectance spectroscopy in the visible near infrared (vis-NIR) range (350–2500 nm) is an alternative technique to conventional wet chemistry analyses of soil. The applica-tion of vis-NIR spectroscopy is wide ranging and relevant for many soil properties, including chemical, physical and biological properties.19 This technique is faster than tradi-tional soil analysis since it requires very little sample prepa-ration. It does not involve chemicals and it is non-destructive. Moreover, several soil properties such as soil OM, texture and water content can be analysed simultaneously using spectroscopy.19 The application of vis-NIR spectroscopy to soil analyses is possible because spectra contain infor-mation on the organic and inorganic composition of soil. Molecules containing chemical bonds such as C–N, N–H and O–H are related to OM and predominate in this absorption region.20 For instance, accurate estimation of soil organic carbon (SOC) from NIR spectroscopy has been achieved in several studies.21–24 Information on the inorganic matter can be held for example by different types of metal oxides or minerals. Since SOC is present in the soil in the form of OM and is more commonly measured than OM, SOC is what we will be using for quantitative analysis with vis-NIR spec-troscopy. However, for qualitative analysis and assignment of the important absorption bands in calibration models we will refer to the different chemical bonds related to OM. Even though WR is not a spectrally active soil component, the degree of WR is determined by the amount and type of OM.25–27 Thus, WR may potentially be determined using
vis-NIR spectroscopy through its co-variation with spectrally active OM components .
To the best of the authors’ knowledge, only two studies6,28 have combined vis-NIR spectroscopy with WR analysis. Knadel
et al.28 used WR as a proxy for OM quality to supplement the characterisation of surface functionality of four Danish soils in a study on soil moisture effects on vis-NIR spectra. They reported that changes in WR curve types (WR as a function of water content) indicated and reflected a clear difference in OM quantity and possibly quality among the investigated soils. The study by Kim et al.6 used vis-NIR spectroscopy to predict WR for 288 soil samples from a soil survey in New Zealand across different soil types with a wide range in SOC and texture. They investigated soil samples covering 10 soil orders with five sampling sites per order and five samples per sampling site. Moderately accurate predictions of WR (R2 = 0.61, root mean square error of prediction = 0.59%) for air-dried soils were obtained and were explained by a correlation between WR and SOC.
The aim of the present study was to investigate the feasi-bility of using vis-NIR spectroscopy to determine WR for soil samples originating from a field with a low variability in soil properties. This study explored additionally the effect of differing drying temperatures (60°C and 105°C) on the ability of vis-NIR spectroscopy partial least squares (PLS) regression models to predict WR. A range of soil properties including SOC, clay, silt, fine sand, coarse sand, total sand and water contents were also predicted in order to verify the role of various soil properties in vis-NIR spectroscopy models of WR.
Materials and methods
Study area
Bulk soil samples used in this study originated from the work by Masis-Meléndez et al.29 The study field of 1.6 ha is located in Jyndevad, southern Denmark (Figure 1), and represents a site with a small gradient in SOC and texture. The soil is clas-sified as a Typic Haplohumod. A total of 87 topsoil samples (0–20 cm) were collected on a 15 m grid. Soil particle size fractions were determined using wet-sieving and hydrom-eter methods.30 Clay was defined as particles smaller than 0.002 mm, silt from 0.002 mm to 0.05 mm, fine sand from 0.05 mm to 0.1 mm, coarse sand from 0.1 mm to 0.2 mm and total sand from 0.05 mm to 0.2 mm. SOC was analysed at 950°C with a FLASH 2000 organic elemental analyser coupled to a thermal conductivity detector (Thermo Fisher Scientific, Waltham, MA, USA). Prior to the measurements, samples were ground. Approximately 50 mg of each soil sample was used for the SOC analysis.
Water repellency measurements
M. Knadel et al., J. Near Infrared Spectrosc. 24, 215–224 (2016) 217
plastic container (410 mm diameter by 5 mm deep) and the soil surface made uniform by placing a 120 g weight over the sample surface for 2 min. The degree of WR was determined at 20°C for the pretreated samples using the MED test16,31 and given as the maximum percentage ethanol of a 60 µL aqueous ethanol droplet that can stay on the plane soil surface for at least 5 s. Aqueous ethanol solutions from 0.01 m3 m−3 to 0.60 m3 m−3 in 0.01 m3 m−3 steps were used to reduce the surface tension of deionised water (72.1 mN m−1). When a droplet of water infiltrates within 5 s, the soil is assumed to be non-water repellent and the resultant contact angle is specified to be equivalent to 90°. High ethanol concentrations (i.e. low surface tension) suggest a more pronounced WR. For the repellent soils the maximum ethanol concentration (M, mol L−1) required for complete infiltration of the droplet after 5 s was converted to liquid surface tension (g) by means of g = 61.05 – 14.75ln(M + 0.5).2
Spectroscopic measurements
A benchtop vis-NIR spectrophotometer (LabSpec®5100) equipped with a high-intensity Muglight probe (ASD Inc., Boulder, CO, USA) was used to obtain soil spectra within the spectral range 350–2500 nm. In the first step soil samples were scanned after air-drying and sieving (<2 mm). In order to test the effect of temperature on vis-NIR predictions of WR, soils were additionally scanned after oven-drying (for 48 h) at 60°C and 105°C. For all temperature treatments two subsam-ples of each sample were scanned and an average of the two scans per sample was used in the further analysis. Details of the scanning protocol and instrumentation can be found in Knadel et al.32
Principal component analysis (PCA)
PCA was applied to the entire dataset including spectra of air-dried and oven-dried soils in order to illustrate the effects of sample drying on soil spectra and properties. Principal component (PC) scores were calculated to describe relation-ships and patterns in the samples and were related to the variables with high loadings located on the same PC. Loadings were used to indicate the contribution of individual variables (wavelengths) along the PC.
Multivariate data analysis
PLS regression was carried out using Unscrambler X 10.1 software (Camo ASA, Oslo, Norway) to correlate soil spectra with the soil properties of interest. Soil properties were deter-mined from apparent absorbance (A = log(1/R), where A is absorbance and R is reflectance). Despite a wide range of available modelling methods, PLS regression was chosen since it has produced satisfactory results for NIR calibrations on Danish soils.24,32 Segmented cross-validation was used in the analysis with two geographically neighbouring samples per segment. Thus, segments were left out of the dataset one at a time and the model was calibrated on the remaining samples, so that each segment was omitted from the analysis once. The validation residual variance was then computed from the prediction residual.33
To improve calibration results, different spectral pretreat-ments including derivatives (first and second Savitzky– Golay derivatives with a second-order polynomial, over 30 smoothing points) and scatter corrections (standard normal variate and multiplicative scatter correction) were tested.32 The best treatment was considered to be the one resulting in a model with the lowest root mean square error of cross-vali-dation (RMSECV) and the highest r2 for the validation dataset (adjusted R-squared showing the goodness of fit expected for future predictions), and a ratio of performance to interquar-tile range (RPIQ) was additionally calculated as the differ-ence between the third interquartile and the first interquar-tile divided by RMSECV, as proposed by Bellon-Maurel and McBratney.34
Results and discussion
The study site is a relatively homogeneous field dominated by sandy soils with an average total sand fraction of 90%, with a low SOC range (1.4–2.5%) and an average water content of 0.006 g g−1 (Table 1).
with Kawamoto et al.,36 who reported higher WR for soil samples oven-dried at 105°C than at 60°C or air-dried at 20°C. In order to be able to predict WR from vis-NIR spectra it is important that WR is correlated to other spectrally active soil properties. Table 2 presents a correlation matrix for all inves-tigated soil properties and WR. Soil WR for samples dried at 60°C (WR60) and 105°C (WR105) were both negatively corre-lated with the fine sand fraction (r = −0.66). There was a posi-tive correlation between WR and clay content (r = 0.52), a low negative correlation with SOC (r = −0.31 to −0.33) and no corre-lations with water content (r ≤ −0.10). The correlation between WR and SOC was lower than expected, even though higher OM contents in sandy soils were found to induce severe WR. Thus, the possible correlation between WR and vis-NIR spectra may be mainly explained by the autocorrelation between WR and clay.
Principal component analysis
PCA was performed on absorption spectra without any addi-tional spectral pretreatments. The first three PCs of the PCA explained 67%, 23% and 9% of the variation, respectively,
amounting to 99% of the total variation for the entire dataset of air- and oven-dried soil samples. Figure 2(a) illustrates the PC1 versus PC3 score plot, with the scores grouped according to the sample treatment (air-dried and oven-dried at 60°C and 105°C). PC3 distinguishes between the temperature treat-ments. Drying the soils at 105°C clearly altered the spec-trally active components of the soil, resulting in a distinct and more separate group along the negative values of PC3 [Figure 2(a)]. Oven-drying the soils at 60°C apparently did not change their properties significantly compared with air-drying since all results after the two temperature treatments were located on the positive side of the PC3 axes, overlapping in spectral space, thus indicating similarities The corresponding loading plot reveals the important wavebands responsible for sample grouping along PC3 [Figure 2(b)]. The highest loadings were located around 1930 nm and can be assigned to different OM constituents such as C=O bonds,19 cellulose, lignin or pectin.37 The O–H bond in water can be detected in the region between 1900 nm and 1930 nm37 and can be a good indicator of changes related to the heating and drying of the samples. Another significant loading around 820 nm is related to C–H Table 1. Summary statistics of soil organic carbon, particle size distribution and water content measured for air-dried soils and water repellency for the 87 samples.a
SOC
Mean 1.82 4.35 4.84 4.03 86.78 90.81 0.006 59.44 48.40
Max. 2.49 5.22 5.95 7.33 88.84 91.88 0.009 71.27 56.55
Min. 1.38 3.65 4.04 2.37 83.39 89.78 0.003 48.24 41.54
SD 0.21 0.40 0.39 1.10 1.23 0.50 0.001 7.16 4.62
Q1 1.67 4.00 4.30 3.31 86.05 90.37 0.005 53.23 44.51
Q3 1.95 4.50 4.80 4.45 87.74 91.11 0.006 63.58 53.23
aSOC, soil organic carbon; WC, water content; WR60, water repellency (expressed as surface tension) after drying at 60°C; WR105, water repellency
(expressed as surface tension) after drying at 105°C; SD, standard deviation; Q1, first interquartile; Q3, third interquartile.
Table 2. Correlation matrix of the soil properties for the 87 samples.a
SOC Clay Silt Fine
sand
Fine sand 0.52 −0.26 0.33 1.00
Coarse sand −0.58 −0.03 −0.55 −0.91 1.00
Total sand −0.29 −0.64 −0.62 −0.05 0.45 1.00
WC 0.46 0.11 0.17 0.13 −0.20 −0.23 1.00
WR60 −0.33 0.52 −0.26 −0.66 0.50 −0.21 −0.10 1.00
WR105 −0.31 0.53 −0.21 −0.63 0.46 −0.26 −0.05 0.92 1.00
aSOC, soil organic carbon; WC, water content; WR60, water repellency (expressed as surface tension) after drying at 60°C; WR105, water repellency
M. Knadel et al., J. Near Infrared Spectrosc. 24, 215–224 (2016) 219
bonds in aromatics,19 implying possible changes to OM caused by temperature changes. Less pronounced loadings in PC3 around 1400 nm and 2200 nm can be attributed to water. The absorption feature around 1400 nm could either be for bound water incorporated in the mineral lattice or be for free water occupying soil pores.37 However, since soil samples used in this study were not moist, higher loading at 1400 nm indicates changes in water content within the mineral lattice as a result of sample drying. Hygroscopic or adsorbed water which exists on the surface areas of clay minerals in the form of a thin layer shows a typical absorption band near 2200 nm37 and is also present in the PC3 loading, confirming again that PCA captures the effect of drying on the amount of water present in the soils.
Qualitative analysis of soil spectra
The effect of the drying temperature on the vis-NIR spectrum for one selected soil sample is shown in Figure 3. The spectra of no other samples are shown since the remainder exhib-ited a similar trend. In order to highlight the important infor-mation in the spectra and ease the comparison, absorption
spectra were transformed to the first Savitzky–Golay deriva-tive (second-order polynomial with 15 smoothing points). As also indicated by the score plots, there was very little visible difference between the spectra of soils that were air-dried or oven-dried at 60°C.
The most significant decrease in absorbance with increase in temperature occurred after oven-drying at 105°C in the spectral region near 1900 nm. Absorption in this waveband can be assigned to molecular water,38 and, as expected, its value decreased with increasing temperature. A pronounced decrease in absorbance after drying the soils at 105°C can be seen in the region between 1950 nm and 2114 nm. Multiple wavelengths in this range relate to different OM compo-nents such as sugar, starch, cellulose, lignin and protein at 1950, 2068 and 2111 nm,37 phenolics at 1961 nm,19 CO(NH
2)2 at 2030 nm and 2070 nm,39 amides at 2033 nm and amine at 2060 nm.19 Higher drying temperatures resulted in lower absorbance values in this region, possibly due to selective degradation of the listed OM components.
A less pronounced reduction of absorbance values with drying can be observed in the visible part of the spectrum at 517 nm and 665 nm (corresponding to the absorption of iron oxides). OM has also been reported to be spectrally active in the region between 570 nm and 700 nm.40 Other regions altered by temperature can be seen at 1400 nm (corresponding to the absorption of free water) and between 2340 and 2447 nm (related to OH stretch in clay minerals and various OM compo-nents such as aliphatic C–H, cellulose and lignin).37
Multivariate data analysis
Prediction results
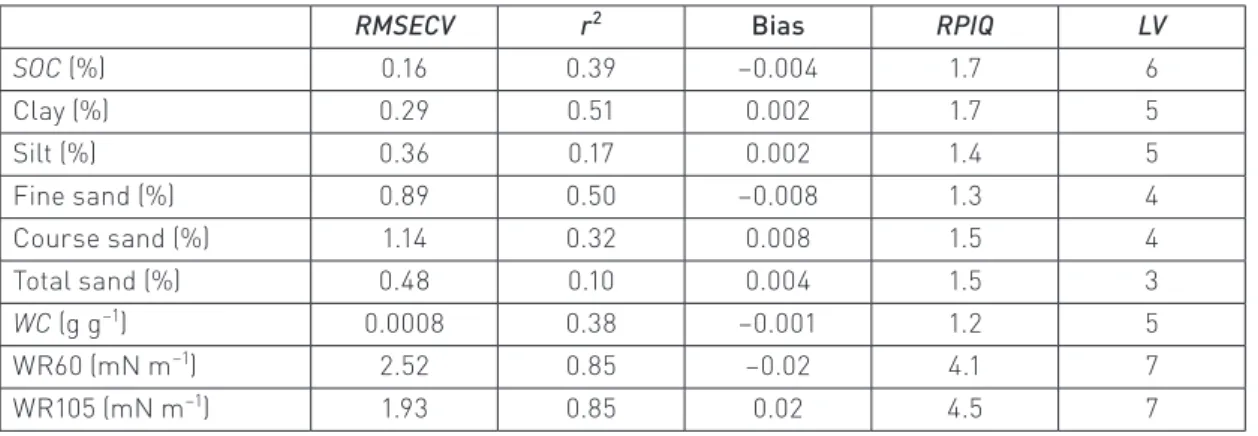
PLS regression models for SOC, particle size fractions and water content were generated using spectra of air-dried soils [Figure 4(a)–(g)]. Models for SOC, sand fractions and water content were generated using absorption spectra without additional pretreatments, whereas models for silt and clay used multiplicative scatter correction and first derivative spectra, respectively. None of these models showed predictive Figure 2. (a) Principal components score plot (PC1 versus PC3 of absorption spectra) marked according to temperature treatment and (b) the corresponding loading plot for the three temperature treatments with the most important bands indicated.
abilities, with r2 values below 0.51 (Table 3). The poor perfor-mance of the vis-NIR models was a consequence of the low variation in the investigated soils. The standard deviation (SD) values of the soil properties were relatively small (Table 1), and, as reported by Stenberg et al.,19 the overall variation affects the prediction performance of calibration models. A range of studies have found that the lower the SD the lower the R2 values for SOC and texture models.19 Despite a large number of absorption bands related to organic and mineral matter in soil, the signals in the vis-NIR region are often weak since they represent the combinations and overtones of the fundamental vibrations in the mid-infrared region. The signals are especially weak when only small amounts of these soil constituents are present. Moreover, this dataset had a very high mean sand content of 90.8% (Table 1). The scattering effect caused by sandy soils may mask the signals from OM, which can further lead to a low predictive ability of vis-NIR spectroscopy models for SOC content. Stenberg et al.19 also
reported on the differences in the vis-NIR spectroscopy cali-bration performance for the SOC content of different textural classes. Those authors showed that datasets containing sandy soils had the lowest r2 values for SOC predictions with values as low as 0.40, which is in line with our findings.
Models for WR (using absorption spectra with no pretreat-ments) were generated from spectra of oven-dried soils at 60°C and 105°C [Figure 4(h) and (i), respectively]. Successful results were obtained for both WR models (Table 3). The model based on spectra of soils dried at 60°C resulted in
RMSECV = 2.52 mN m−1, r2 = 0.85 and RPIQ = 4.1. Further drying the soils at 105°C improved WR prediction with
RMSECV = 1.93 mN m−1, r2 = 0.85 and RPIQ = 4.5 (Table 3). The higher precision of the WR prediction models obtained can be attributed partly to WR having a wider range and variation than any of the other soil properties investigated (Table 1).
M. Knadel et al., J. Near Infrared Spectrosc. 24, 215–224 (2016) 221
that the successful determination of WR was possible due to its autocorrelation with other spectrally active soil properties or components present in the soil, but not investigated here.
As indicated by other studies, even though WR is related to the soil OM content, it is more its quality than its quantity that is responsible for the hydrophobic character of soil.10,11 Not all soil carbon compounds are hydrophobic and WR can thus be related to one or a few particular types of carbon rather than to the total carbon content.7 The PLS results from our study confirm that it is not the total amount of SOC that is the driving factor for WR. However, since no detailed data on the quality of the OM or type of SOC are available in this study, we can only draw a conclusion on the basis of the qualitative analysis of regression coefficients from prediction models to find spectrally active functional groups of soil OM components that explain the variation in WR.
Qualitative analysis of regression coefficients
Normalised regression coefficients from prediction models of WR60 and WR105 are presented in Figure 5. As explained above, the best models for WR were generated using absorp-tion spectra with no spectral pretreatments and seven factors. Because of poor prediction results for other soil properties, their regression coefficients will not be discussed.
The shapes of the WR regression coefficient curves are for the most part similar (Figure 5). Nevertheless, distinct differences in the regions that can be assigned mainly to OM can be observed for both coefficients. Signals related to iron oxides are present in the visible part of the spectrum (around 620 nm), with a higher intensity for the soils dried at 105°C. A broad band near 853 nm related to C–H bonds is also visible. Lower values of the regression coefficient in this region for the soils dried at 105°C indicate a lower content of molecules containing C–H bonds. The wide band in the region 1000– 1490 nm is also present in the coefficients from both models, with more pronounced intensities for the soils dried at 60°C. This region reflects the presence of multiple OM compo-nents such as macromolecules of cellulose, wax, lignin and
protein,37 containing primary amine groups (N–H), aromatics (C–H), alkyl (C–H)19 and carbonyl (C=O).39 A pronounced peak around 1950–2000 nm can be observed for the soils dried at 60°C and can be assigned to OM components and OH in clay minerals. After drying at higher temperatures, this band shifted to lower wavelengths at around 1930 nm and could be assigned to carboxylic acid.19 Two more features related to OM can be found in the regression coefficient of the WR model based on soils dried at 60°C. Close to 2279 nm a band related to hydrocarbon groups (C–H, CH2, CH3) can be observed and a less pronounced band near 2330 nm related to CH2 and COO– of cellulose and lignin.37 The presence of aliphatic C–H groups has been reported to cause WR in soils.7 After drying the soils at 105°C a new feature can be observed at 2193 nm which was in an earlier study37 assigned to amide II (C–N, N–H) and protein. After drying at the higher temperature only one broad band between 2309 nm and 2348 nm is visible in the regres-sion coefficient instead of the two features near 2297 nm and 2330 nm after drying at 60°C. In this region several bands have previously been reported to be related to OM,41 but also to clay minerals (illite).19
Table 3. Partial least squares regression (cross-validation) results.a
RMSECV r2 Bias RPIQ LV
SOC (%) 0.16 0.39 −0.004 1.7 6
Clay (%) 0.29 0.51 0.002 1.7 5
Silt (%) 0.36 0.17 0.002 1.4 5
Fine sand (%) 0.89 0.50 −0.008 1.3 4
Course sand (%) 1.14 0.32 0.008 1.5 4
Total sand (%) 0.48 0.10 0.004 1.5 3
WC (g g−1) 0.0008 0.38 −0.001 1.2 5
WR60 (mN m−1) 2.52 0.85 −0.02 4.1 7
WR105 (mN m−1) 1.93 0.85 0.02 4.5 7
aSOC, soil organic carbon; WC, water content; WR60, water repellency (expressed as surface tension) after drying at 60°C; WR105,
water repellency (expressed as surface tension) after drying at 105°C; RMSECV, root mean square error of cross-validation; RPIQ, ratio of interquartile range (Q3 − Q1) to RMSECV; LV, latent variables.
Conclusions
WR is caused by the presence of hydrophobic agents on grain surfaces of minerals. It is often developed in sandy soils due to their small specific surface areas which are easily coated by hydrophobic substances. Even though WR is not an active soil component in the vis-NIR spectral region, the degree of WR can be related to the amount and type of soil OM and also clay fractions. Thus, we hypothesised that WR can be determined using vis-NIR spectroscopy through its co-variation with spec-trally active carbon or/and clay.
The investigated dataset comprised soil samples originating from a sandy-textured field with a low variability in soil prop-erties. Sandy fields can generally be simplified as homoge-neous media; however, they may be subject to field-scale variation induced by changes in both the quantity and the quality of soil OM, resulting in pronounced variations in WR. Thus, field-based studies can provide a valuable input to a better understanding of the processes responsible for WR development.
Despite low variability in the investigated soil proper-ties (SOC, clay, silt, sand and water content), a pronounced gradient in WR was reported. Moreover, the PLS calibra-tion models of WR outperformed significantly those of the remaining soil properties. The good predictive ability of the WR models could not be attributed to total organic carbon or clay since their vis-NIR calibration models showed no predictive ability. Successful predictions of WR can be party explained by its wider range and variation compared with other soil properties. Additional detailed analyses of regres-sion coefficients indicated that multiple bands assigned to hydrocarbon groups, including aliphatic C–H, and related to different components of OM were located along the entire vis-NIR spectrum of WR calibration models. The results indi-cate that across the investigated field WR was related to specific hydrophobic components of soil OM rather than to the total amount of carbon.
Vis-NIR spectroscopy proved to be a fast and reliable method for WR determination at a field scale. The ability to measure and predict many samples in a short time enables detailed analyses of the extent of WR across fields and will further enable more comprehensive studies to better understand its causes and consequences. Further studies will include a wider range of soil types sampled across various scales of geographic regions. Additionally, detailed information on the quality of SOC will be necessary in order to distinguish the contribution from the total SOC content and its hydro-phobic components when determining WR using vis-NIR spectroscopy .
Acknowledgements
Financial support for this work came from the soil-spec project funded by the GUDP programme (Grønt Udviklings- og Demonstrationsprogram) under the Danish Ministry of
Food, Agriculture, and Fisheries and by the Danish Pesticide Leaching Assessment Programme (www.pesticidvarsling.dk).
References
1. N. Jarvis, A. Etana and F. Stagnitti, “Water repellency , near-saturated infiltration and preferential solute transport in a macroporous clay soil”, Geoderma
143, 223 (2008). doi: http://dx.doi.org/10.1016/j. geoderma .2007.11.015
2. J.L. Roy and W.B. McGill, “Assessing soil water repellency using the molarity of ethanol droplet (MED) test”, Soil Sci.167, 83 (2002). doi: http://dx.doi. org/10.1097/00010694-200202000-00001
3. I. Atanassova and S.H. Doerr, “Organic compounds of different extractability in total solvent extracts from soils of contrasting water repellency”, Eur. J. Soil Sci.
61, 298 (2010). doi: http://dx.doi.org/10.1111/j.1365-2389.2009.01224.x
4. L.F. DeBano, “Water repellent soils: a state-of-the-art”, Pacific Southwest Forest and Range Experiment Station, Berkley, CA, US Department of Agriculture, Forest Service (1981).
5. L.W. Dekker, C.J. Ritsema, K. Oostindie, D. Moore and J.G. Wesseling, “Methods for determining soil water repellency on field-moist samples”, Water Resour. Res.45, W00D33 (2009). doi: http://dx.doi. org/10.1029/2008WR007070
6. I. Kim, R.R. Pullanagari, M. Deurer, R. Singh, K.Y. Huh and B.E. Clothier, “The use of visible and near-infrared spectroscopy for the analysis of soil water repellency ”,
Eur. J. Soil Sci.65, 360 (2014). doi: http://dx.doi. org/10.1111/ejss.12138
7. I. McKissock, R.J. Gilkes, R.J. Harper and D.J. Carter, “Relationships of water repellency to soil properties for
different spatial scales of study”, Aust. J. Soil Res.36, 495 (1998). doi: http://dx.doi.org/10.1071/S97071
8. M.G. Wallis, D.J. Horne and A.S. Palmer, “Water-repellency in a New Zealand development sequence of yellow-brown sands”, Aust. J. Soil Res.31, 641 (1993). doi:
http://dx.doi.org/10.1071/SR9930641
9. G. Wessolek, H. Stoffregen and K. Täumer, “Persistency of flow patterns in a water repellent sandy soil: conclu-sions of TDR readings and a time-delayed double tracer experiment”, J. Hydrology375, 524 (2009). doi: http:// dx.doi.org/10.1016/j.jhydrol.2009.07.003
10. N. Jiménez-Morillo, J.A. González-Perez, A. Jordán, L.M. Zavala, J.M. de la Rosa, M.A. Jiménez-González and F.J. González-Vila, “Organic matter fractions controlling soil water repellency in sandy soils from the Doñana National Park (southwestern Spain)”, Land Degrad. Develop. 27, 1413 (2014). doi: http://dx.doi.org/10.1002/ ldr.2314
M. Knadel et al., J. Near Infrared Spectrosc. 24, 215–224 (2016) 223
stability”, Soil Sci. Soc. Am. J.64, 1479 (2000). doi: http:// dx.doi.org/10.2136/sssaj2000.6441479x
12. D. Diehl, “Soil water repellency: dynamics of heteroge-neous surfaces”, Colloids Surf. A432, 8 (2013). doi: http:// dx.doi.org/10.1016/j.colsurfa.2013.05.011
13. S.H. Doerr and A.D. Thomas, “The role of soil mois-ture in controlling water repellency: new evidence from forest soils in Portugal”, J. Hydrology231–232, 134 (2000). doi: http://dx.doi.org/10.1016/S0022-1694(00)00190-6
14. E. Gimeno-García, J.A. Pascual and J. Llovet, “Water repellency and moisture content spatial variations under Rosmarinus officinalis and Quercus coccifera in a Mediterranean burned soil”, Catena85, 48 (2011). doi:
http://dx.doi.org/10.1016/j.catena.2010.12.001
15. J. Mataix-Solera, V. Arcenegui, C. Guerrero, M.M. Jordán, P. Dlapa, N. Tessler and L. Wittenberg, “Can terra rossa become water repellent by burning? A laboratory approach”, Geoderma147, 178 (2008). doi: http://dx.doi. org/10.1016/j.geoderma.2008.08.013
16. J. Mataix-Solera, V. Arcenegui, N. Tessler, R. Zornoza, L. Wittenberg, C. Martínez, P. Caselles, A. Pérez-Bejarano, D. Malkinson and M.M. Jordán, “Soil properties as key factors controlling water repellency in fire-affected areas: evidences from burned sites in Spain and Israel”,
Catena108, 6 (2013). doi: http://dx.doi.org/10.1016/j.cat-ena.2011.12.006
17. P.D. Hallett, “An introduction to soil water repellency”, in Proceedings of the 8th International Symposium on Adjuvants for Agrochemicals (ISAA2007), Ed by R.E. Gaskin. International Society for Agrochemical Adjuvants, Wageningen (2007).
18. C. Watson and J. Letey, “Indices for characterizing soil-water repellency based upon contact angle– surface tension relationships”, Soil Sci. Soc. Am. J.34, 841 (1970). doi: http://dx.doi.org/10.2136/
sssaj1970.03615995003400060011x
19. B. Stenberg, R.A.V. Rossel, A.M. Mouazen and J. Wetterlind, “Visible and near infrared spectroscopy in soil science”, Adv. Agron.107, 163 (2010). doi: http:// dx.doi.org/10.1016/S0065-2113(10)07005-7
20. C. Pasquini, “Near infrared spectroscopy: fundamentals, practical aspects and analytical applications”, J. Braz. Chem. Soc.14, 198 (2003). doi: http://dx.doi.org/10.1590/ S0103-50532003000200006
21. L. Kooistra, R. Wehrens, R.S.E.W. Leuven and L.C. Buydens, “Possibilities of visible–near-infrared spec-troscopy for the assessment of soil contamination in river floodplains”, Anal. Chim. Acta446, 97 (2001). doi:
http://dx.doi.org/10.1016/S0003-2670(01)01265-X
22. P.H. Fidencio, R.J. Poppi, J.C. de Andrade and H. Cantarella, “Determination of organic matter in soil using near-infrared spectroscopy and partial least squares regression”, Commun. Soil Sci. Plant Anal.
33, 1607 (2002). doi: http://dx.doi.org/10.1081/CSS-120004302
23. F. Deng, M. Knadel, Y. Peng, G. Heckrath, M. Greve and B. Minasny, “Soil profile organic carbon prediction with visible–near infrared reflectance spectroscopy based on a national database”, in Digital Soil Assessments and Beyond. CRC Press, Boca Raton, FL, p. 409 (2012).
24. M. Knadel, F. Deng, A. Thomsen and M.H. Greve, “Development of a Danish national vis-NIR soil
spectral library for SOC determination”, in Digital Soil
Assessments and Beyond. CRC Press, Boca Raton, FL,
p. 403 (2012).
25. E.B.A. Bisdom, L.W. Dekker and J.F.T. Schoute, “Water repellency of sieve fractions from sandy soils
and relationships with organic material and soil structure ”, Geoderma56, 105 (1993). doi: http://dx.doi. org/10.1016/0016-7061(93)90103-R
26. L.W. de Jonge, P. Moldrup and O.H. Jacobsen, “Soil-water content dependency of “Soil-water repellency in soils: effect of crop type, soil management, and physi-cal–chemical parameters”, Soil Sci.172, 577 (2007). doi:
http://dx.doi.org/10.1097/SS.0b013e318065c090
27. M. Kajiura, T. Tokida and K. Seki, “Effects of moisture conditions on potential soil water repellency in a tropical forest regenerated after fire”, Geoderma181, 30 (2012). doi: http://dx.doi.org/10.1016/j.geoderma.2012.02.028
28. M. Knadel, F. Deng, A. Alinejadian, L.W. de Jonge, P. Moldrup and M.H. Greve, “The effects of moisture condi-tions – from wet to hyper dry – on visible near-infrared soil spectra of Danish reference soils”, Soil Sci. Soc. Am. J.78, 422 (2014). doi: http://dx.doi.org/10.2136/ sssaj2012.0401
29. F. Masis-Meléndez, T.K.K. Chamindu Deepagoda, L.W. de Jonge, M. Tuller and P. Moldrup, “Gas diffusion-derived tortuosity governs saturated hydraulic conduc-tivity in sandy soils”, J. Hydrology512, 388 (2014). doi:
http://dx.doi.org/10.1016/j.jhydrol.2014.02.063
30. G.W. Gee and J.W. Bauder, “Particle-size analysis”, in
Methods of Soil Analysis: Part 1. Physical and Mineralogical Methods, Ed by A. Klute. Soil Science Society of America and American Society of Agronomy, Madison, WI, p. 383 (1986).
31. P.M. King, “Comparison of methods for measuring severity of water repellence of sandy soils and assess-ment of some factors that affect its measureassess-ment”, Aust. J. Soil Res.19, 275 (1981). doi: http://dx.doi.org/10.1071/
SR9810275
32. M. Knadel, B. Stenberg, F. Deng, A. Thomsen and M.H. Greve, “Comparing predictive abilities of three visible-near infrared spectrophotometers for soil organic carbon and clay determination”, J. Near Infrared Spectrosc.21, 67 (2013). doi: http://dx.doi.org/10.1255/ jnirs.1035
33. H. Martens and T. Næs, Multivariate Calibration. John Wiley, Chichester (1989).
critical review and research perspectives”, Soil Biol. Biochem.43, 1398 (2011). doi: http://dx.doi.org/10.1016/j. soilbio.2011.02.019
35. J. Bachmann, M. Deurer and G. Arye, “Modeling water movement in heterogeneous water-repellent soil: 1. Development of a contact angle-dependent water-retention model”, Vadose Zone J.6, 436 (2007). doi: http://dx.doi.org/10.2136/vzj2006.0060
36. K. Kawamoto, P. Moldrup, T. Komatsu, L.W. de Jonge and M. Oda, “Water repellency of aggregate size frac-tions of a volcanic ash soil”, Soil Sci. Soc. Am. J.71, 1658 (2007). doi: http://dx.doi.org/10.2136/sssaj2006.0284
37. E. Ben-Dor and A. Banin, “Near-infrared analysis as a rapid method to simultaneously evaluate several soil properties”, Soil Sci. Soc. Am. J.59, 364 (1995). doi: http:// dx.doi.org/10.2136/sssaj1995.03615995005900020014x
38. G.R. Hunt, “Spectral signatures of particulate minerals in the visible and near infrared”, Geophysics42, 501 (1977). doi: http://dx.doi.org/10.1190/1.1440721
39. J.L. Shonk, L.D. Gaultney, D.G. Schulze and G.E. Van Scoyoc, “Spectroscopic sensing of soil organic matter content”, Trans. ASAE34, 1978 (1991). doi: http://dx.doi. org/10.13031/2013.31826
40. L.S. Galvão and I. Vitorello, “Variability of laboratory measured soil lines of soils from southeastern Brazil”,
Remote Sens. Environ.63, 166 (1998). doi: http://dx.doi. org/10.1016/S0034-4257(97)00135-1
41. E. Ben-Dor “Quantitative remote sensing of soil prop-erties”, Adv. Agron.75, 173 (2002). doi: http://dx.doi. org/10.1016/S0065-2113(02)75005-0