TítuloEffects of environmental changes during the quaternary on the distribution of extant species :|bthe case of the butterflies "Erebia triaria" and "E palarica"
144
0
0
Texto completo
(2) ^ s the mtDNA sequence. divergence of 2.3i. per My from Arthropoda ^ #. suitable at subfamily leve ^. Dating. hylogenetic. even ^s in butterflies.. No queda más que bati^se Arturo Pérez-Reverte.
(3)
(4) (e.g. 9= 2µNe). This 2.3 % estimate is frequently assumed for the cytochrome-oxidaseI gene (COI) in insects (Sandoval et al., 1999 in Phasmatoptera; Knowles, 2000 in Orthoptera; Martin et al., 2002 in Lepidoptera), although aware of the lack of accuracy in time estimates based on DNA sequence divergence.. ill. Although still controversial, analytical methods for timing of phylogenetic events have very much improved, so that even rate heterogeneity may be currently incorporated into the estimation of divergence times (reviewed by Arbogast et al. 2002). We show in this paper how the use of (i) calibrated molecular rates, obtained either other taxa, (ii) calculated for the case-study by a simple but frequently used approach, and (iii) phylogenetic dating-methods not based on substitution rates, may all result in very different time estimates. We argue that the use of m from substitution rates appears very problematic for common analyses as the timing of splitting events and estimating demographic parameters. Some studies in insects calibrated their own mitochondrial rates. For instance, a divergence rate of 2.3 % PLMY was obtained by Venanzetti et al. (1993) for Orthoptera based in mtDNA RFLPs, which would correspond to a 4.6 % SDMY. Cognato et al. (1999) also assumed such estimate for Coleoptera, but pointed out that the rate at which mtDNA genome evolves in different taxa may be quite variable. Sperling et al. (1997) found a slower 0.8 to 0.9 % COI rate in their model organism (Hemiptera). Accordingly, Andersen et al. (2000) suggested that the most probable explanation for the discordance in their Hemiptera dataset is that the COI evolved at a slower rate (0.8-0.9 %). Caccone & Sbordoni (2001) empirically derived COI rates as L2-1.3 PLMY for two Coleoptera, calibrating them with a well-dated geological event. Segraves & Pellmyr (2001) estimated the approximate divergence times of three lineages of Lepidoptera. Given the percentage of seauence divergence (1.37-1.67) among them and their time estimates (9.1-9.9 My), the COI rate would be approximately 0.15 % SDMY. Priiser & Mossakowski (1998) calibrated the NADH-I mtDNA sequence rate for carabid Coleoptera by using geological events assumed to have caused the splitting of taxa. Rates as percentage of pairwise mtDNA SDMY ranged between 0.39-0.98, approximating an underlying constant mutation rate of 0.24-0.49 %/Myr. Outside Insecta, but still within Arthropoda and using COI sequences, Ketmaier et al. (2003) obtained rates similar to Caccone & Sbordoni (2001) in an Isopod (Crustacea). However, Rivera et al. (2002) found higher rates (3.9^.2 % in < 1 Myr) in another Isopod, and Wares (2001) found higher rates in barnacles (Crustacea: Cirripeda) with a 4.9 % SDMY. Soto-Adames (2002) accounted for the possible biogeographic scenarios by applying different published molecular rates (1.2-4.9 %) to his Collembola (Hexapoda). Gaunt & Miles (2002) calibrated a molecular clock at deep phylogenetic level for the COI dataset from five insect orders and two classes of Crustacea. Analyses resulted in. r ;Ci:1^v^ ^i i^5*. . _ .. ,. "^^^ i„ ^atv^,r.a^ ^. _. -. 111.
(5) 0.022 % second-codon nucleotide substitutions/My. The observed variation in mitochondrial rates might be due to difference at the taxonomic level. Brower ( 1994) clearly stated that the predictable rate of mtDNA divergence in arthropods was among closely related taxa with low absolute amounts of sequence divergence. We emphasize, based on our literature review, that the indiscriminate use of the 2.3 % SDMY may be highly inaccurate. In order to illustrate this, we have used the simplest approach to calculate a specific mtDNA COI rate for the Satyrinae group i.e. we estimated a minimum COI substitution rate for this clade by calibrating the percentage of sequence divergence with the first fossil reference available for that particular group. Then, we compare it with the commonly used 2.3 % SDMY after Brower ( 1994). In addition, to show the uncertainty in the dating process using DNA sequences, we calculated rates based on the COI nucleotide changes along the branches of a tree as inferred from character optimization in a parsimony analysis including Satyrinae and other Nymphalidae. Then, we dated a same given event, i.e. radiation of the genus Erebia, and compared the ages obtained by three approaches (i) using the 2.3 % SDMY, (ii) using our minimum COI rate calculation, and (iii) using the branch-length-based rate.. Results The best-fit model of nucleotide substitution for the whole dataset (1,152 bp of the mtDNA cytochrome-oxidase-I (COI), from 36 Nymphalidae, Table 1) was the General Time Reversible (GTR) including a proportion of invariable sites (I) of 0.4663 and gamma shape parameter (a) of 0.4069. Unequal branch lengths indicated that unequal rates might have been present. The molecular clock was rejected for the whole dataset having Greta as outgroup (LRT, x2 = 74, d.f. = 34, P < 0.001) and also for Nymphalinae alone having Greta (LRT, x2 = 38, d.f. = 18, 0.001 < P< 0.01) or Heliconius as outgroup (LRT, x2 = 48, d.f. = 8, P < 0.001). The Satyrinae always appeared as monophyletic, showing constant topology both under Maximum Parsimony (MP) or Neighbour joining (NJ) (Figure 1). The molecular clock was not rejected for the Satyrinae with any of the following outgroups: Greta (Danainae), Heliconius (Heliconiinae), Apatura or ^anessa (Nymphalinae) (LRT, x^ = 12, 10, 14 and 10 respectively, d.f. = 1 l, P> 0.05). The GTR model was used in all (I = 0.5, a= 0.7). The average distance between each outgroup and the Satyrinae is shown in Table 2. Distance matrices are available on request. The (0.8941.25) interval for minimum percentage SDMY was obtained by dividing the genetic distance by the Lower Oligocene age limits (33.7-28.5 Mya) i.e. when the first Satyrinae appears in the fossil record. To properly compare with the widespread 2.3 % SDMY (Brower 1994) we also calculated uncorrected p- distances for the same clades, obtaining 112 ^^^^..
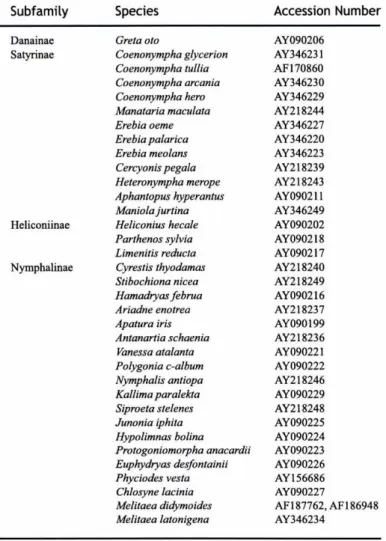
(6) ^l'd( ^ ^. Subfamily. Species. Accession Number. Danainae Satyrinae. Greta oto Coenonympha glycerion Coenonympha tullia Coenonympha arcania Coenonympha hero Manataria maculata Erebia oeme Erebia palarica Erebia meolans Cercyonis pegala Heteronympha merope Aphantopus hyperantus Maniola jurtina Heliconius hecale Parthenos sylvia Limenitis reducta Cyrestis thyodamas Stibochiona nicea Hamadryas februa Ariadne enotrea Apatura iris Antanartia schaenia Yanessa atalanta Polygonia c-album Nymphalis antiopa Kallima paralekta Siproeta stelenes Junonia iphita Hypolimnas bolina Protogoniomorpha anacardii Euphydryas desfontainii Phyciodes vesta Chlosyne lacinia Melitaea didymoides Melitaea latonigena. AY090206 AY346231 AF170860 AY346230 AY346229 AY218244 AY346227 AY346220 AY346223 AY218239 AY218243 AY090211 AY346249 AY090202 AY090218 AY090217 AY218240 AY218249 AY090216 AY218237 AY090199 AY218236 AY090221 AY090222 AY218246 AY090229 AY218248 AY090225 AY090224 AY090223 AY090226 AY156686 AY090227 AF 187762, AF 186948 AY346234. Heliconiinae. Nymphalinae. n. Table 1. Species included in this study (Lepidoptera: Nymphalidae) and COl Genbank accession numbers. Outgroup. GTR distance. Divergence/My N(•10 -3). p- distance(*). Diverg./My (*). N(*)(•10 -3). Greta Heliconius .4patura Yanessa. 0.3292 (0.027) 0.3013 (0.0395) 0.3571 (0.0492) 0.3283 (0.0324). 0.0098-0.0115 0.0089-0.0106 0.0106-O.O125 0.0097-O.O115. 0.1340 (0.005) 0.1272 (0.006) 0.1373 (0.006) 0.1364 (0.006). 0.0040-0.0047 0.0038-0.0045 0.0041-0.0048 0.0040-0.0048. 2.4-2 2.2-1.9 2.4-2 2.4-2. 4.88-5.75 4.47-53 5.30-0.25 4.87-5.75. Table 2. Average distances (standard deviation, in brackets, obtained from standard errors of average distances), minimum sequence divergence per million years (My) and minimum rate per lineage per My (µ) between the outgroup and the members of the Satyrinae clade, under GTR model and (*) uncorrected p- distances. Transitions and transversions included in analyses. „^LV;v^=, ^^_i^^ti^^^tic^^, -. ^+-,s. ^ ^.. _. ^.,^ }-^_ ^. 113.
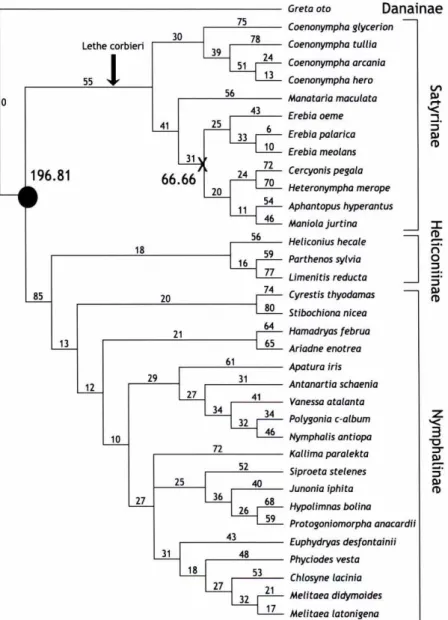
(7) Greta oto 75 30. 78. Lethe corbieri. 39. Coenonympha tullia 24. 51 55. 13. ^. 25 6 10. 33 31. 72 24 70 20 54 11 46. 56 18. Aphantopus hyperantus Moniola jurtina. Limenitis reducta Cyrestis thyodamas. 80. Stibochiona niceo. 61. Hamadryas februa Ariadne enotrea Apatura iris. 31 27. Antanartia schaenia 41. 34. Vanessa atalonta 34. Polygonia c-album. 46. Nymphalis antiopa. 32 10 72. Ka((ima paralekta 52. 25. Siproeta ste(enes 40. 36. Junonia iphita 68. Hypo(imnas bo(ina. 59. Protogoniomorpha anacardii. 26 43. 31. Cercyonis pegala Heteronympha merope. 74. 65. 27. ^ ^. Erebia meo(ans. Parthenos sylvia. 21. 12. Erebia pa(arica. 77. 64. 29. ^. Heliconius hecale. 20. 13. ^ r-r. Erebia oeme. 59 16. 85. Coenonympha hero Manataria macu(ata. 43. 66.66. Coenonympha arcania N. 56. 41. Danainae. Coenonympha glycerion. Euphydryas desfontainii. 48 18. Phyciodes vesta. 53 27. Chlosyne lacinia 21. Melitaea didymoides. 17. Melitaea lotonigena. 32. Figure 1. Phylogenetic tree for 36 Nymphalidae species. Branch lengths obtained by optimisation of COI data on the topology from Wahlberg et al. (2003). Dating of nodes in the phylogeny performed by mean branch length approach ( Bremer and Gustafsson 1997). The arrow indicates the position of the first Satyrinae fossiL Mean distance in branch length at node X results from (25+43)+(25+33+6)+(25+33+10) = 200/3 = 66.67. This calculation resulted in 196.81 for the Satyrinae splitting ( black circle), which divided by the fossil age (28.5-33.7 My), yielded a mean change rate of ( 6.9-5.84/My). This rate may be used to date other nodes e.g. X as occurring 9.6711.42 Mya.. 114 ^^-^^^ !!^.
(8) ^("t? V;^•'^. a even lower divergence ( 0.4-0.48) % SDMY (Table 2). The percentage of pairwise sequence divergence of the Erebia species included in this study is 5.69 %. The dating of the Erebia radiation, as represented in this dataset, would. u. have occurred ( i) 2.47 Mya if using Brower's 2.3 % SDMY, (ii) at least 4.55-6.36 Mya if using our (0.894-1.25) % of SDMY for the Satyrinae group, or (iii) 9.67-11.42 Mya if using the mean change rate (6.9-5.84/My) from the branch-length approach (see Experimental Procedures and Figure 1). One might argue that the difference is due to poor sampling of the genus. Nevertheless, when using COI sequences of ten species of Erebia (Vila & Bjbrklund, 2004) the difference is still notorious, as the percentage of pairwise sequence divergence is about 6.88. This leads those lineages to converge about 2.99 Mya under 2.3 % SDMY and 5.5-7.69 Mya under our rough estimate (0.894-1.25) %.. Discussion The aim of this study was to warn about a widespread way of assuming molecular rates (further recalculated as m and commonly used in e.g. demographic studies based on genetic data), rather than the calibration of the mitochondrial COI rate for Satyrinae butterflies. By timing the radiation of the genus Erebia with simple but commonly used methods, we illustrated the magnitude of error on such approaches. For this, we selected a lineage that conforms to a molecular clock with a locus demonstrated as suitable for this kind of analysis (Gaunt & Miles 2002), and then we showed how both the methodological approach and the extrapolation of a sequence divergence (obtained for distantly related groups or estimated from more closely related taxa) do severely bias calculations that will later affect crucial parameters as m. The molecular clock was consistent within the Satyrinae clade as from the LRT test. We did not used relative rates testing as the performance would become problematic with our dataset (Bromham et al. 2000). We first calibrated a rate of evolution for the mitochondrial COI, which is commonly used in phylogenetic studies from population to family level and a proper marker for molecular clock in insects (Gaunt & Miles 2002). The obtained rate was approximately half of the commonly used in evolutionary studies on entomology. We acknowledge that fossil calibrations only result in a minimum rate. In the branch-length analysis on the Satyrinae, the rate of change was obtained from nucleotide changes along the branches of a tree inferred from character optimisation in parsimony analysis. Such a rate must not be taken as an estimate of the real substitution rate (Bremer 2000)o We calculated it because we wanted to illustrate the magnitude of error in dating a particular event using the same dataset, with alternative approaches. Depending on the method used, the age of the Erebia radiation ranges from 2.5 to 11.2. !. 1lÍ.,ii'V,ó, S. ^ _} _ _^v^'^ i dl^ç. ^;^ ^_ tv^ ^íit^^ I^ °r -^_:{^. .. ^^.
(9) Mya. Such a long time interval may make biogeographic scenarios difficult to deduce. We conclude that the use of estimates as % SDMY and ,u must be carefully assessed for each particular case.. Experimental procedures Cytochrome Oxidase I(COI) sequences of 36 butterflies (Lepidoptera: Nymphalidae) were obtained from GenBank: nine Nymphalinae, three Heliconiinae, thirteen Satyrinae and a Danainae. (Table 1. Fragment length: 1152 bp starting at position 2236 of the mitochondrial genome of Drosophila yakuba). Alignments were unambiguous and made by eye. In order to calculate sequence divergences, the best-fit model of nucleotide substitution was evaluated with the software Modeltest 3.0 (Posada & Crandall, 1998) and used to investigate the phylogenetic relationships of the mtDNA haplotypes through Neighbour-joining (NJ) analysis, also surveyed by maximum Parsimony (MP, heuristic searches with random stepwise addition and TBR branch swapping options). The robustness of the consensus tree was examined with after 1,000 bootstrap replicates (data not shown). The molecular clock was tested with a likelihood ratio test (LRT) upon the estimated tree (NJ) and best-fit model. Phylogenetic analyses were performed in PAUP* (Swofford, 1998). The group Satyrinae, a Nymphalidae subfamily (Wahlberg et al., 2003), is found for first time in the fossil record as Lethe corbieri in the Lower Oligocene, 33.7-28.5 Mya (Nel et al., 1993; Pfretzschner 1998). The tribe Nymphalini is known from the Upper Miocene (11-5 Mya), although fossils attributed to llanessa are known from the Lower Eocene (54-49 Mya) (Hammond & Poinar, 1998). The latter could not be taken into account due to unclocklike behaviour of the Nymphalinae and Nymphalidae clades. Calibration of a clock based on estimates of genetic distance between Satyrinae taxa was performed for each combination Satyrinae+outgroup separately. We used the General Time Reversible (GTR) model of evolution with proportion of invariable sites (I) and gamma distribution shape paramter (a) as from Modeltest 3.0 as well as p- uncorrected distances, the latter for proper comparison to Brower's (1994) estimates. A general outline of the phylogeny of Nymphalidae (Wahlberg et al., 2003) provided strong support for the major clades. A Maximum Parsimony (MP) analysis was performed including the Coenonympha sequences with major clades constrained if supported also by the other data (Figure 1). Branch lengths were obtained by optimisation of the COI data on the tree. To date the nodes in the phylogeny, we used the mean branch length approach (Bremer & Gustafsson, 1997) whereby mean branch lengths from the terminals to the basal node of the tree are calculated. Unequal rates in the lineages are apparent, as the distance from the root to the terminals is different among taxa. The procedure of calculating mean branch lengths reduces the problem of these unequal rates towards the 116 ='^^^r.
(10) base of the tree. To convert the relative ages obtained in the analyses into real ages, a fossil of a known age is needed. By dividing the mean distance in branch length from the node to the terminals with the minimum age, we get a mean change rate. By dividing then the mean distance from the node to its terminals with the mean change rate, we obtain an approximate dating of all the nodes in the phylogeny.. u. Acknowledgements Mats Bj^rklund and Bengt Oxelman improved earlier versions of this manuscript. Matthew Webster corrected the language. This work, funded by a scholarship from University of A Coruña, is part of MV's Ph.D. thesis.. References Andersen, N.M., Cheng, L., Damgaard, J. and Sperling, F.A.H. (2000) Mitochondrial DNA sequence variation and phylogeography of oceanic insects (Hemiptera: Gerridae: Halobates spp.). Mar Biol 136: 421-430. Arbogast, B.S., Edwards, S.V., Wakeley, J., Beerli, P. & Slowisnki, J.B. (2002) Estimating divergence times from molecular data on phylogenetic and population genetic timescales. Annu Rev Ecol Syst 33: 707-740. Bremer, K. (2000) Early Cretaceous lineage of monocot flowering plants. Proc Natl Acad Sci USA 97: 4707-471 l. Bremer, K. and Gustafsson, M.H.G. (1997) East Gondwana ancestry of the sunflower alliance of families. Proc Natl Acad Sci USA 94: 9188-9190. Bromham, L., Penny, D., Rambaut, A. & Hendy, M.D. (2000) The power of relative rate tests depend on the data. J Mol Evol 50: 296-301. Brower, A. V.Z. (1994) Rapid morphological radiation and convergence among races of the butterfly Heliconius erato inferred from patterns of mitochondrial DNA evolution. Proc Natl Acad Sci USA 91: 6491-6495. Caccone, A. and Sbordoni, V. (2001) Molecular biogeography of cave life: a study using mitochondrial DNA from Bathysciine beetles. Evolution 55: 122-130. Cognato, A.I., Seybold, S.J. and Sperling, F.A.H. (1999) Incomplete barriers to mitochondrial gene flow between pheromone races of the North American pine engraver, lps pini (Say) (Coleoptera: Scolytidae). Proc R Soc Lond B 266: 1843-1850. Gaunt, M.W. and Miles, M.A. (2002) An insect molecular clock dates the origin of the insects and accords with palaeontological and biogeographic landmarks. Mol Biol. ^^^t^^!:" ^..^u^, L i^^^_iz,. }-_. .. ^^.^Vr,^,a^ '. :^^^,N«. 117.
(11) Evol 19: 748-761. Hammond, P.C. and Poinar Jr, G. (1998) A larval brush-footed butterfly (Lepidoptera: Nymphalidae) in Dominican amber, with a summary of fossil Nymphalidae. Entomologica scandinavica 29: 275-279. Keitmaier, V., Argano, R. and Caccone, A. (2003) Phylogeography and molecular rates of subterranean aquatic Stenasellid Isopods with a peri-Tyrrhenian distribution. Mol Ecol 12: 547-555. Knowles, L.L. (2000) Tests of Pleistocene speciation in montane grasshoppers (Genus Melanoplus) from the sky islands of Western North America. Evolution 54: 13371348. Martin, J.-F., Gilles, A. and Descimon, H. (2000) Molecular phylogeny and evolutionary patterns of the European Satyrids (Lepidoptera: Satyridae) as revealed by mitochondrial gene sequences. Mol Phylogenet Evol 15: 70-82. Martin, J.-F., Gilles, A., L^rtscher, M. and Descimon, H. (2002) Phylogenetics and differentiation among the western taxa of the Erebia ryndarus group (Lepidoptera: Nymphalidae). Biol J Linn Soc 75: 319-332. Nel, A., Nel, J. and Balme, C. (1993) Un nouveau Lépidoptére Satyrinae fossile de 1'Oligocéne du Sud-Est de la France (Insecta, Lepidoptera, Nymphalidae). Linneana Belgica 14: 20-36. Posada, D. and Crandall, K.A. (1998) Modeltest: testing the model of DNA substitution. Bioinformatics 14: 817-818. Pfretzschner, H.U. (1998) Ein weiteres Exemplar von Lethe ? corbieri NEL 1993 (Lepidoptera, Satyridae) aus dem Unter-Oligoz^n von Céreste (Siid-Frnakreich). Paldontologische Zeitschrift 72: 59-64. Priiser, F. and Mossakowski, D. (1998) Low substitution rates in mitochondrial DNA in Mediterranean carabid beetles. Insect Mol Biol 7: 121-128. Rivera, M.A.J., Howarth, F.G., Taiti, S. and Roderick, G.K. (2002) Evolution in Hawaiian cave-adapted isopods (Oniscidea: Philosciidae): vicariant speciation or adaptative shifts?. Mol Phylogenet Evol 25: 1-9. Sandoval, C., Carmean, D.A. and Crespi, B.J. (1998) Molecular phylogenetics of sexual and parthenogenetic Timema walking-sticks. Proc R Soc Lond B 265: 589-595. Segraves, K.A. and Pellmyr, O. (2001) Phylogeography of the yucca moth Tegeticula maculata: the role of historical biogeography in reconciling high genetic structure with limited speciation. Mol Ecol 10: 1247-1253. Soto-Adames, F.N. (2002) Molecular phylogeny of the Puerto Rican Lepidocyrtus and Pseudosinella (Hexapoda: Collembola), a validation of Yoshii's "color pattern species". Mol Phylogenet Evol 25: 27-42.. 118 ^^^Qr.
(12) Sperling, F.A.H., Spence, J.R. and Andersen, N.M. (1997) Mitochondrial DNA, allozymes, morphology, and hybrid compatibility in Limnoporus water striders (Heteroptera: Gerridae): do they all track species phylogenies? Ann Entomol Soc Am 90: 401-415.. u. Swofford DL (1998) PAUP*: Phylogenetic analysis using parsimony (and other methods) v. 4.Ob. Sunderland: Sinauer. Venanzetti, F., Cesaroni, D., Mariottini, P. and Sbordoni, V. (1993) Molecular phyologenies in Dolichopoda cave crickets and mtDNA rate calibration. Mol Phylogenet Evol 2: 275-280. Vila, M. and Bjórklund (2004)The utility of the neglected mitochondrial control region for evolutionary studies in Lepidoptera (Insecta). J Mol Evol. 58: 1-11. Wares, J.P. (2001) Patterns of speciation inferred from mitochondrial DNA in North American Chthamalus (Cirripeda: Balanomorpha: Chthamaloidea). Mol Phylogenet Evol 18: 104-116. Wahlberg, N., Weingartner, E. and Nylin, S. (2003) Towards a better understanding of the higher systematics of Nymphalidae (Lepidoptera: Papilionoidea). Mol Phylogenet Evol 28: 473-484.. ^ ^ ^^á^^ ir^ ^^t^p^ .^^. --_. 119.
(13)
(14) T est;n^ biennialism in the butterfly. Erebia palarica (Nymphalidae: Satyrinae). by mtDNA sequencing. Pe^o, ^po^ qué?... pe^o, ^po^ qué la maldad? David "Chapín" Monterroso.
(15) Testing biennialism in the butterfly Erebia palarica (Nymphalidae: Satyrinae) by mtDNA sequencing Short Note M. Vila 1^2 and M. Bjórklund1^3 1. Department of Animal Ecology, Evolutionary Biology Centre, Uppsala University, Norbyv^gen 18-D, SE-752 36 Uppsala, Sweden 2. IUX-Edificio de Servicios Centrais de Investigación, University of A Coruña, Campus de Elviña, E-15071, A Coruña, Galicia, Spain 3. Corresponding author: mats.bjorklund@ebc.uu.se Key words: Erebia, biennial cycle, postglacial history, control region, cytochrome oxidase I.. Abstract The montane butterfly Erebia palarica has an unconfirmed life cycle length. The genus Erebia shows variability in length of diapause depending on latitude and altitude, which may lead to allochronic differentiation. To test for biennialism and possible asynchronous differentiation we sequenced the most variable fragments of the mitochondrial control region and the cytochrome-oxidase-I in forty individuals from the same population, from two consecutive years. No differentiation between cohorts could be detected and therefore the idea of a current annual cycle is supported. We conclude that a biennial cycle may never have been important in this population and we further discuss adaptive strategies this species may have used to confront colder climates.. Introduction The frequency or number of annual broods, defined by voltinism, varies considerably in butterfly species according to geographical location and altitude. Erebia butterflies are considered plastic with respect to their life-cycle length (Wipking & Mengelkoch, 1994) but never multivoltine. Warren (1936) revealed that the same species can appear in every second year in some localities, whereas they can be seen every year in others. On the other hand, some Erebia found in colder climates are clearly biennial (Douwes, 1980). The main concern of this paper is the possibility that even- and odd-year cohorts may be 122 '=-^^e,.
(16) reproductively isolated from each other. This issue arose from prior literature showing that some sympatric biennial but asynchronous populations of species of Erebia (Warren, 1936) and other Satyrinae butterflies (Nice & Shapiro, 2001) have adults emerging every year but the even- and odd-year cohorts are reproductively isolated. Changes in the timing of life cycles may even produce new species by allochronic differentiation (Ritchie, 2001), as demonstrated in cicadas (Cooley et al., 2001). It is reasonable to expect a certain amount of differentiation between even and odd year cohorts in biennial species (semivoltinism) if asynchronous generations have been alternating for sufficient time. If a significant structure between even- and odd- year cohorts from the same locality is detected, this may indicate either (i) a current asynchronous biennial cycle with even and odd year demes reproductively isolated, or (ii) traces of a past biennial cycle evolved to cope with a historical harsh environment, which has since evolved into a current annual cycle. In addition, given a sufficiently long timespan, we would expect rate heterogeneity in the sequence dataset as a result of a shift in generation time (Martin & Palumbi, 1993) i.e. if the population was biennial with nonoverlapping generations in time, and it changed to annual at a certain point in time. However, we are aware that such a rate change would require a time-span of, at least, a million years to be detected with markers such as mitochondrial DNA (mtDNA). Nevertheless, basic analyses of genetic differences between years can shed some light on the current and past life history of a species. To our knowledge, the only genetic studies on Lepidopteran voltinism finding allochronic differentiation were Nice & Shapiro's (2001) using allozymes. In other studies allozymes did not result in significant differentiation between even/odd-year demes in the biennial Erebia embla (Douwes & Stille, 1988), nor in Aglais urticae (Vandewoestijne et al., 1999), which is known for its voltinism plasticity. Mitochondrial DNA was used over a very recent time scale in order to distinguish among voltine ecotypes in moths; Ozaki & Ohbayashi (2001) found no sequence variation in a cytochrome-oxidase-I (COI) fragment and neither did Marçon et al. (1999) with other mitochondrial fragments, rDNA, ND1 and ND4. As differences in life cycle length can be detected through genetic studies (Nice & Shapiro, 2001), the aim of this study was to elucidate the length of life cycle of Erebia palarica Chapman 1905 through genetic markers. This species is endemic to the NW of the Iberian Peninsula. It has an unconfirmed life cycle length (Tolman & Lewington, 1997) and restricted dispersal. It is a species generalist with regard to host plant, it lives in altitudes above 1000 m, and its populations are currently isolated from each other in different mountain ranges. To test for significant differences between even/odd year demes, we sequenced the mitochondrial control region (CR) and the second half of the cytochrome-oxidase-I (COI) in twenty individuals collected in 1998 and twenty from 1999 at the same locality. We had previously screened the studied samples for nuclear microsatellite markers. -^. •^. ^ ^^-. ^. ^Í^^`i^1 ^ ^ ^l1 ^ ^i ^.^^ Cai^il^i^t.i^á^^i^^,^ i;3^ ^:)^^i^ E^^ á. - 123. PI.
(17) (Cassel 2002), but all loci resulted monomorphic for Erebia palarica. Then, we sequenced mtDNA because, (i) its maternal inheritance reduces the effective population size to 1/4 of nuclear loci, thus increasing the diversifying power of genetic drift acting on mtDNA, (ii) the selected markers were proven to be useful at both the inter- and intrapopulation level (Vila & Bjijrklund, 2004), and (iii) mtDNA is a marker frequently used at the time scale of the studied scenario, i.e. the last ice-age.. Results Sixteen different haplotypes were identified in forty individuals when combining the 356 bp of the CR and 786 bp from the COI (Table 1). CR sequences yielded three indels and five substitutions (four transitions, one transversion). Each indel occurred as either a TA or AT dinucleotide-repeat coded as a single character, since they occur in a dinucleotide-microsatellite section. Indels did not pose any ambiguity when aligning the sequences. In the COI fragment, six of the nine transitions were third codon positions, and three not i.e. COI-gene-positions 811 (2nd position, non-synonymous amino acid change), 975 (1 st position, non-synonymous change) and 1059 (1 st position, synonymous change). Standard indices of genetic diversity for the whole sample (h = 0.887 ^ 0.031, p= 0.0016 ^ 0.0002) did not differ when calculated for each cohort.. Position R Acc. no.. OI Acc. no.. Domain. AY350484 AY350484 AY350481 AY346236 AY346236 AY480015 AY350481 AY350484 AY480016 AY480017 AY480018 AY350480 AY480019 AY350481 AY346236 AY350484 AY350481. AY350464 AY346220 AY346220 AY346220 AY350465 AY346220 AY346220 AY480013 AY346220 AY346220 AY346220 AY346220 AY346220 AY350466 AY350464 AY350463 AY480014. I II III IV V VI VII VIII IX X XI XII XIII XIV XV XVI XVII. 1 2 8 8 2 8 6 7 9 A D D D. 1 3 0 D. 1 1 1 1 2 5 7 8 9 5 9 9 0 1 9 D D D D?. 3 2 0 F. 3 8 8 9 4 1 3 2 3 1 9 6 F 13 M7 M 8. T-- T A A-- A A C T . . . . .. . . . . .. . . . T . C . . . . . . .. . . . . .. . . . .. . G A T . . . A T . . . . A T . . . . A T T N . G A T N .. . . . G A A . . G A . . . G A . . . . . . . . A . . . G A . . . . A. T T T . T T T. G A T. . . . . . . . C . .. . . T . . . . T . . . . . T . . . . . . .. . . . . . . .. G . . . . . . A .. A . . . G . . G . .. 9 7 5 I4. 1 0 5 9 M9. 1 1 1 1 1 2 2 3 9 8 9 2 ount 3 0 8 2 IS M 11 M11 E6 19981999 N. . . . . . ... T G C C . . . . . . . . . . . . . . . . . . . . . . . . . . . . . . . . . . . . . . . . .. T. C T T T T T T T T T T T T T. A . . . G . . G . . . . . .. T . . . . . . . . . . . . C. • . .. • • • ^ C. T. . T. .. • T T. • . .. • . .. • .. 2 2 1 7 0 0 0 2 1 0 1 I 1 0 0 2 0. 1 3 2 3 1 1 1 1 0 1 0 0 0 2 1 2 1. 3 5 3 10 1 1 1 3 1 1 1 1 1 2 1 4 1. Table 1. Variable sites for 16 unambiguous haplotypes defined by 3^2-356 bp of the control region (CR) and 786 bp of the cytochrome-oxidase-I (COI). N= 40. All COI substitutions correspond to 3rd codon positions, except those in bold. Structural domains following Vila & B_jórklund (2004) and Lunt et al. (1996).. 124.
(18) The hypothesis of the molecular clock was not rejected (LRT x2 = 15.74, d.f. = 14, P > 0.05). An AMOVA indicated that, regardless of marker, all variation was due to within cohort diversity rather than differentiation between demes and this was confirmed by the exact test of sample differentiation (COI: P= 0.709; CR: P= 0.275; Combined: P= 0.658). Pairwise Fs.i. values calculated from COI, CR and COI+CR were in all cases not different from zero and far from significant (COL• -0.032, P= 0.928; CR: -0.003, P=. PI ❑ Ancares 1998 ❑ Ancares 1999. ^ VI. XIII. Figure 1. Haplotype cladogram for even-oddyear demes of Ancares population as from the combined dataset of mitochondrial sequences (COI + CR). Haplotypes labelled as in table 1. Ci rc l e s i ze re fl ects t h e frequency of each haplotype and solid lines connecting each haplotype (regardless of their length) a single represent mutational event. Small black circles represent missing or theoretical haplotypes. Ambiguous haplotype VII is attributed to haplotype III. Arrows indicate indel mutational steps.. 0.324; Combined: -0.015, P= 0.694), The haplotype genealogy did not show any sign of differentiation between the cohorts (Figure 1). The model of sudden expansion was not rejected in any case (P > 0.05). The parameter of demographic expansion (i) was not informative, as it had large confidence limits (e.g. 0.24 - 4.73). Both cohorts showed signs of bottleneck, as the observed variance in the frequencies of CR and COI haplotypes were in all cases larger (2.6 to 6 times) than the expected upper 95 % limit assuming a stable population.. -^.^^'^^ ^^^;^.^nc^s ^ ^r _.. ^ :^^^-,^; (^te ^. ^ z^„^. 125.
(19) V, ] i ^é^^ ;. Discussion We found no trace of allochronic differentiation in the Ancares population of Erebia palarica, which currently supports an annual cycle for this population. Regarding past history, we propose three feasible scenarios. Firstly, a biennial cycle was never a lifehistory trait in this population. Secondly, a biennial phase existed in this population in the past, when cold climatic conditions were present in the area ( Santos et al., 2000), but later became annual. This change may have occurred a sufficient number of generations ago, which has resulted in diluting the initial genetic differentiation. Thirdly, the biennial cycle existed in the past, but bottlenecks found in both demes have masked its genetic signal. We argue that the biennial cycle was never an important life history trait as the most parsimonious explanation for the results obtained. This is supported by the fact that Wipking & Mengelkoch ( 1994) rejected the biennial cycle for two alpine populations of Erebia meolans and E. palarica is phylogenetically very close to E. meolans following both morphological (Warren, 1936) and genetic criteria (1.6 % COI genetic divergence, from Vila & Bj^rklund, 2004). Out data revealed signals of past bottlenecks in both cohorts. They are expected to have randomly changed the haplotype frequencies, making any putative differentiation prior to the bottleneck more apparent, rather than erasing the genetic differentiation between demes. The low genetic diversity as from mtDNA data (Tables 1 and 2) and the lack of variability in nuclear microsatellite loci (Cassel, 2002) was congruent with data from other narrowly distributed endemic taxa (Frankham, 1996). Low levels of mitochondrial and nuclear variation were also a handicap for Kankare et al. (2002) to establish the degree of genetic isolation between alternate-year cohorts of another Lepidoptera. In our dataset, the molecular clock hypothesis was not rejected by the likelihood ratio test. The time scale of this study is highly likely too short to expect rate heterogeneity differentiation caused either by shifts in generation time, or by different substitution rates in the two mitochondrial fragments. In summary, if a biennial stage had occurred in the past, but either bottlenecks or subsequent annual development have diluted the putative genetic differentiation, more resolution would be required to detect the differentiation of both cohorts. The adaptive strategies for Erebia butterflies to cope with cold climatic conditions are the adoption of a biennial cycle, and/or by lowering their altitude locality. While we cannot rule out both possibilities occurring simultaneously in the studied system, we suggest that the lack of biennialism in Erebia palarica indicates that its adaptive strategy was to move lower in altitude during cold periods of the past glacial cycles. To conclude, the observed pattern from our data implies that Erebia palarica is annual. Studies on more generations and rearing experiments are needed to definitely assert so.. 126 ^^^^; ^'^.
(20) ^r 4^ = : _--. There was no genetic indication of a biennial cycle. We interpret this as support for the species to have coped with the past ice-age harsh and stochastic environmental conditions by performing altitudinal changes. Such changes would have followed those in the associated plant community, also caused by climatic oscillations (Bennett et al., 1991 e.g. Gutiérrez Larena et al., 2002).. Experimental procedures. PI. Specimens Specimens of Erebia palarica were hand-netted in the same loca(ity in the Ancares mountain range (Galicia, NW of Spain, coordinates 42°50'N, 7°55'W, altitude 1400 m a.s.l.) during July of 1998 (n = 20) and July of 1999 (n = 20) and preserved in 95 % ethanol. To reduce the impact on the populations only males were caught. No difference in population density between the years was apparent. For this paper we have sequenced twenty individuals. Analyses also include sequences from the twenty other specimens already published elsewhere (Vila & Bj^rklund, 2004) (Accession Numbers in Table 1).. DNA extraction, amplification and sequencing DNA was extracted from adult thorax tissue using the DNAeasy-Tissue-Kit (Qiagen). We amplified and sequenced the CR and the most variable part of the COI in twenty individuals of E. palaYica following procedures and primers described in Vila & Bjórklund (2004). The 1142 bp fragment ranges 356 bp of the CR plus 786 bp of the COI, starting the latter at position 717 in the COI of Coenonympha tullia Lepidoptera: Satyrinae, GenBank Accession Number AF 170860). Both were sequenced bidirectionally with an ABI-310 automated sequencer. Sequences were deposited in GenBank (Accession numbers from AY480013 to AY480019).. Sequence analysis Alignments were performed by eye. Haplotypes and their frequencies were obtained with COLLAPSE 1.1 (software by D. Posada at http://darwin.uvigo.es). Haplotype (h) and gene (n) diversities were calculated in DNAsp 3(Rozas & Rozas, 1999). As intraspecific haplotype trees do not necessarily reflect population history and may be misleading with regard to shallow genealogies (Posada & Crandall, 2001) we assessed the haplotype relationships with an unrooted network using a statistical parsimony criterion with the TCS 1.13 software (Clement et al., 2000). The best-fit model of nucleotide substitution was evaluated with MODELTEST (Posada & Crandall, 1998) and the molecular clock hypothesis was tested with a likelihood ratio test (LRT) upon the estimated tree (Neighbor joining) and the best-fit model, HKY. R .^,^E_^^. q^^ ta^^=^^ ^;^ ^ in^3 _ , :^^^ ^if^^. ' ^en-_ - 1 7 az^.
(21) We performed an Analysis of Molecular Variance (AMOVA) as implemented in ARLEQUIN ( Schneider et al., 2000) to partition genetic variation into components attributable to differences between even and odd years. Significance-levels were determined by 1,000 permutations. Pairwise FST values and exact test of differentiation (Raymond & Rousset, 1995) were also calculated in ARLEQUIN. We investigated the demographic signature of the mitochondrial population samples by using a pairwise mismatch distribution to test for population expansion ( Rogers & Harpending, 1992) as implemented in ARLEQUIN. We also used the Variance of Haplotype Frequencies (Var(S)) test (Bj^rklund, 2003). This test compares the frequency distribution of haplotypes in the sample with that from a large stable population using coalescent simulations (null distribution). The results are shown as mean simulated variance with 95 % intervals and observed variance. If the observed variance is outside the 95% interval, the result was treated as significant.. Acknowledgements We thank C. Vilá, J.R. Vidal-Romaní, N. Ryrholm, M. Carlsson and J. Hóglund for discussing earlier drafts. Two anonymous referees improved the manuscript with their comments. C.C. Nice kindly let us read and discuss his manuscript. S. Robinson improved the writing. J.L. Vila, D. Romero and S. Uceira voluntarily assisted in sampling. This work is a part of MV's Ph.D. thesis, and was funded by the IUX at University of A Coruña. MV was funded by scholarships from the Spanish Ministry of Education and University of A Coruña. MB was funded by grants from the Swedish Science Council.. References Bennett, K.D., Tzedakis, P.C. and Willis, K.J. (1991) Quaternary refugia of north European trees. J Biogeogr 18: 103-115. Bjórklund, M. (2003) A test for a population expansion after a drastic reduction in populations size using DNA sequence data. Herediry 91: 481-486. Cassel, A. (2002) Characterization of microsatellite loci in Coenonympha hero (Lepidoptera: Nymphalidae). Mol Ecol Notes 2: 566-568. Clement, M., Posada, D. and Crandall, K.A. (2000) TCS: a computer program to estimate gene genealogies. Mol Ecol 9: 1657-1660. Cooley, J.R., Simon, C., Marshall, D.C., Slon, K. and Ehrhardt, C. (2001) Allochronic speciation, secondary contact, and reproductive character displacement in periodical cicadas (Hemiptera: Magicicada spp.): genetic, morphological, and behavioural evidence. Mol Ecol 10: 661-671. 128 _---,^r ;=^.
(22) -->-_ 4 ^fj.^ i4'.k_ -_- _ ^ ^^. Douwes, P. (1980) Periodical appearance of species of the butterfly genera Oeneis and Erebia in Fennoscandia (Lepidoptera: Satyridae). Ent Gen 6: 151-157. Douwes, P. and Stille, B. (1988) Selective versus stochastic processes in the genetic differentiation of populations of the butterfly Erebia embla (Thnbg) (Lepidoptera, Satyridae). Hereditas 109: 37-43. Frankham, R. (1996) Relationship of genetic variation to popultion size in wild-life. Conserv Biol 10: 1500-1508. Gutiérrez Larena, B., Fuertes Aguilar, J. and Nieto Feliner, G. (2002) Glacial-induced altitudinal migrations in Armeria (Plumbaginaceae) inferred from patterns of chloroplast DNA haplotype sharing. Mol Ecol 11: 1965-1974. Kankare, M., Varkonyi, G. and Saccheri, I. (2002) Genetic differentiation between alternate-year cohorts of Xestia tecta (Lepidoptera, Noctuidae) in Finnish Lapland. Hereditas 136: 169-176. Lunt, D.H., Zhang, D-X., Szymura, J.M. and Hewitt, G.M. (1996) The insect cytochrome oxidase I gene: evolutionary patterns, and conserved primers for phylogenetic studies. Insect Mol Biol 5: 153-165. Marçon, P.C.R.G., Taylor, D.B., Mason, C.E., Hellmich, R.L. and Siegfried, B.D. (1999) Genetic similarity among pheromone and voltinism races of Ostrinia nubilalis (Huebner) (Lepidoptera: Crambidae). Insect Mol Biol 8: 213-221. Martin, A.P. and Palumbi, S.R (1993) Body size, metabolic rate, generation time, and the molecular clock. Pro Natl Acad Sci USA 90: 4087-4091. Nice, C.C. and Shapiro, A.M. (2001) Patterns of morphological, biochemical, and molecular evolution in the Oeneis chryxus complex (Lepidoptera: Satyridae): a test of historical biogeographical hypotheses. Mol Phylogenet Evol 20: 111-123.. Ozaki, K. and Ohbayashi, T. (2001) DNA comparison of Japanese populations of Hyphantria cunea with divergent life cycles. Ent Sci 4: 47-52. Posada, D. and Crandall, K.A. (1998) Modeltest: testing the model of DNA substitution. Bioinformatics 14: 817-818. Posada, D. and Crandall, K.A. (2001) Ir ^traspecific gene genealogies: trees grafting into networks. Trends Ecol Evol 16: 37-45. Raymond, M. and Rousset, F. (1995) An exact text for population differentiation. Evolution 49: 1280-1283. Ritchie, M.G. (2001) Chronic speciation in periodical cicadas. Trends Ecol Evol 16: 5961. Rogers, A.R. and Harpending, H. (1992) Population growth makes waves in the distribution of pairwise genetic differences. Mol Biol Evol 9: 552-569.. ,;^^^^ s^^-.^^^^^^ ^,^t^ ^^^=^^,n^ ii;^ ^, _^ ^er^^ : 129. PI.
(23) ^^es;s. Rozas, J. and Rozas, R. (1999) DnaSP version 3: an integrated program for molecular population genetics and molecular evolution analysis. Bioinformatics 15: 174-175. Santos, L., Vidal Romaní, J.R. and Jalut, G. (2000) History of vegetation during the Holocene in the Courel and Queixa Sierras, Galicia, northwest Iberian Peninsula. J Quaternary Sci 15: 621-632. Schneider, S., Roessli, D. and Excoffier, L. (2000) Arlequin ver. 2000: A software for population genetics data analysis. Genetics and Biometry Laboratory, University of Geneva, Switzerland. Tolman, T. and Lewington, R(1997) Butterflies of Britain and Europe. Harper Collins Publishers, London, UK Vandewoestijne, S., Néve, G. and Baguette, M. (1999) Spatial and temporal population genetic structure of the butterfly Aglais urticae L. (Lepidoptera, Nymphalidae). Mol Ecol 8: 1539-1543. Vila, M. and Bj^rklund, M. (2004) The utility of the neglected mitochondrial control region for evolutionary studies in Lepidoptera (Insecta). J Mol Evol 58: 1-11. Warren, B.C.S. (1936) Monograph of the genus Erebra, pp: 32-33. British Museum Natural History, London, UK. Wipking, W. and Mengelkoch, C. (1994) Control of alternate-year flight activities in highalpine Ringlet butterflies (Erebia, Satyridae) and Burnet moths (Zygaena, Zygaenidae) from temperate environments. In: Insect Life-cycle polymorphism: theory, evolution and ecological consequences for seasonality and diapause control, (H.V. Danks, ed.), pp: 313-347. Kluwer Academic Publishers, The Netherlands.. 130 ^^^.
(24)
(25)
(26) How mu ch does the 111 te fdCt1011 between. ^. dllCl e llt and fECC'11 t. ^ demo^raphic events affect phylogeographic ? inference • The case of the butterfly. Erebia palarica. (Nymphalidae: Satyrinae). Anubía e anubía... e aínda que anubía non chove. Traditional Galician song. 133.
(27) How much does the interaction between ancient and recent demographic events affect phylogeographic inference? The case of the butterfly Erebia palarica (Nymphalidae: Satyrinae) M. Vila ^^^° 3, J.R. Vidal-Romaní ^, N. Ryrholmi & M. Bj^rklund i 1. Department of Animal Ecology, Evolutionary Biology Centre, Uppsala University, Norbyv^gen 18-D, SE-752 36 Uppsala, Sweden 2. IUX-Servicios Centrais de Investigación, University of A Coruña, Campus de Elviña, E-15071, A Coruña, Spain 3. Corresponding author: xemarta@mail2.udc.es. Key words: phylogeography, Erebia, NCA, postglacial history, bottleneck, MIGRATE. Abstract To stress the impact of recent demographic events on the resolution of the inference from genetic structure obtained by different tools commonly used in phylogeographic studies, we tested if the occurrence of bottlenecks can mask phylogenetic structuring and distort both coalescence-based estimation of historic migration directions and intensities as well as inferences from Nested Clade Analysis. Mitochondrial sequences of three geographically close but isolated NW Iberian populations of the endemic montane butterfly Erebia palarica were significantly differentiated, as revealed by AMOVA and FST tests. Nevertheless, none of the three populations formed a monophyletic clade. Late Quaternary climatic oscillations are thought to have originally shaped the high altitude distribution of this species. At such a fine geographical scale, the gradient of genetic diversity, highest in the northernmost population and lowest in the southernmost one, could simply be explained by a gradual loss of variation in the direction of the post-glacial colonization. However, bottlenecks have been detected in the three populations and could have reversed the pattern. We propose that the three populations sought refuge in the lowlands, from where they rose in altitude up to their current locations when climate conditions were warm enough. Once isolated, a first stage of differentiation was caused by genetic drift in the separate populations. The occurrence of independent bottlenecks in more recent times may have been responsible for both the current low degree of variation and the lack of reciprocal monophyly. Bottlenecks also seem to distort (i) the inference. 134 =^^.
(28) from Nested Clade Analysis at total cladogram level and (ii) the coalescence-based estimates of migration routes and intensities.. Introduction The search for phylogeographic patterns has been largely successful and resulted in an increased knowledge of the effect of Pleistocene glaciations on the distribution, diversity, patterns of refuges and migration routes of taxa at a continental scale (reviewed in Hewitt 1999; Hewitt 2000). One issue that is lacking from most studies is the consideration of recent demographic events, such as bottlenecks, which might act to obscure the inference of historical gene flow. Bottlenecks commonly change the haplotype frequencies in a population in an unpredictable way, reducing the haplotype diversity and changing relative frequencies (Nei et al., 1975; Bjdrklund 2003). For example, assume that we have three locations organised in a linear fashion (A - B- C), and that the species immigrated into the area and formed population A, then B and last C, under a stepping-stone modeL Most commonly, this would lead to a reduction of haplotype diversity from A to C unless the number of founders of each population had been very large. Now, if recent bottlenecks have occurred in populations A and B but not in C, the pattern will likely change and even might be reversed with regard to haplotype diversity and the inference would be that the species immigrated from the opposite direction, with population C as the ancestral population. This simple example clearly shows that we must take recent demographic events into account when trying to infer past historical movements of species. This paper aims at distinguishing the relative importance of ancient and recent demographic processes (e.g. postglacial range expansion versus more recent bottlenecks) involved in shaping the current pattern of genetic variation in an organism with low dispersal and a discontinuous distribution. Another goal of this work is to assess whether tools commonly used in phylogeography, such as Nested Clade Analysis (NCA) and coalescence-based estimates of migration directions and rates, are affected by such oscillations in population size. For this study, we chose three geographically close populations of the butterfly Erebia palarica Chapman 1905, sequenced mitochondrial DNA (mtDNA) fragments and reviewed the palaeoenvironmental reconstructions for the sampled area. Er-ebia palarica is endemic to the NW Iberian Peninsula (Fig. 1). It lives above 1 000 m a.s.l. Its populations are currently isolated from each other in different mountains blocks (García-Barros et al. in press).. Palaeoenvironment evolution The available reconstructions of vegetation for the studied areas cover the last glacialinterglacial transition (Muñoz Sobrino et al. 2001) and the Holocene (Santos et al. 2000; ^-^^^ ^hv^^^en^r^^^y ^t ^^ _ ^_^, ^=^,:A^ t-^.^.: --- 135 - v.
(29) Leira & Santos 2002). The three locations show geomorphological evidence of having been glaciated (Vidal Romaní & Santos 1994; Gómez Ortiz et al. 2001). It is not possible to accurately time the colonization of the species in those formerly glaciated areas, because Erebia fossils have not been found and E. palarica is not a specialist in living on any particular plant species that could be tracked in pollen records. E. palarica has been classified as cold-tolerant (Gutiérrez 1997) and usually appears in mountain swards avoiding forests, as other congeneric species do (e.g. Schmitt et al. 2000). Pollen spectra from the area (Courel) showed dominance of cryophilous taxa and indications of open woodlands in the lowlands at 17 500 yBP (Muñoz Sobrino et al. 2001). Consequently, we may assume that at that time the populations were still a panmictic aggregation at low altitude. Around 15 500 - 13 300 yBP the tree line (Pinus, Betula, Quercus, Alnus, Fraxinus) was located around 1 375 m a.s.L (Muñoz Sobrino et al. 2001). This could have been the first high-altitude colonization, meaning a first isolation of the populations in meadows above the tree line. Once warmer conditions forced the butterfly to colonise high areas, subsequent climatic coolings might have been responsible for the populations descent in altitude, facilitating the exchange of individuals. The period 13 500 - 10 300 yBP is characterised by herbaceous vegetation indicative of moist conditions and a maximum abundance of Poaceae (11 000 - 10 000 yBP approx.) followed by a climatic warming that led again to great tree coverage in the area (Muñoz Sobrino et al. 2001). Another cooling is registered between 8 600 and 8 000 yBP in Courel (Leira & Santos 2002). After this series of altitudinal displacements (following the vegetation successions conditioned by successive cold and warm stages), this cold period might have been the last time when the populations were panmictic or exchanged significant number of individuals. An increase in forest biomass is recorded after 8,000 yBP, indicating the development of more stable conditions (Santos et al. 2000). This date would to 8,000 generations of the studied organism, assuming a constant annual life cycle (Vila & Bjdrklund, paper IV). The three populations we investigated are highly likely to be isolated at present since the last deglaciation. We tested for possible bottlenecks and expansions. If such were found, we investigated whether these events have acted to obscure the historical patterns of gene flow.. Materials ^t Methods Populations Eighty individuals from Erebia palarica were hand-netted in three Galician mountain ranges (NW Spain) during July 1998 and July 1999. The average distance between the three locations (Ancares n= 40, Courel n = 20, Queixa n= 20, Fig. 1) was 46 km. Ancares is located 1 400 m asl at 42°50'N, 7°55'W; Courel is located at 1,200 m, 42°24'N 7°56'W and Queixa is located at 1 750 m, 42° 16'N 7° 14' W.. 136 "^^^^.
(30) Altitude. ^ > 2000 m 1500-2000 m 1000-1500 m 500-1000 m 0-500 m. \Q/. M. E. palarica. ^• N N• p^^•i• • • M••M• M. Figure L(A) Distribution area of Erebia palarica (dashed line), endemic to the NW Iberian Peninsula. (B) Sampling locations and sample sizes. (C) Detailed distribution of E. palarica (after García-Barros et czl. In press).. _ ^_. ;.^: ,^^^^ ^^ :^ ,^^ ^. v^-^: ^^. - 137.
(31)
(32) .^ici: ;.^ 1^11^. expansion (Rogers & Harpending 1992). The parameter time of demographic expansion (ti = 2 µ t, where µ is mutation rate, and t is time since expansion) was estimated and approximate confidence intervals were obtained with 1 000 parametric bootstrap replicates in ARLEQUIN (Schneider et al. 2000). We evaluated CR and COI separately, because their different selective constraints might lead to different rates of evolution. In that case, these markers would reflect different temporal stages.. Test forBottlenecks We checked the occurrence of population expansion after drastic reductions in population size using the mtDNA sequences, by analysing the variance of haplotype frequencies (Var(S)) (Bjdrklund, 2003). This test compares the frequency distribution of haplotypes in the sample with that from a large stable population using coalescent simulations (null distribution). If a bottleneck has occurred then this is shown as a larger or much smaller variance in haplotype frequencies than expected given the sample size. We created 10 000 samples from the null distribution using the 0(= 2 Ne µ)-value estimated from the data and compared the variance in these samples with that observed. The results are shown as mean simulated variance with 95 % confidence intervals and observed variance. If the observed variance was outside the 95 % interval, the result was treated as significant.. Nested Clade Analysis (NCA) The parsimonious haplotype networks mentioned above were the starting point for applying NCA as implemented in the software GEODIS 2.0 (Posada et al. 2000); this was performed to survey the phylogeographical pattern and possible processes causing it (Templeton 1998) by using 1 000 permutations and the most-updated inference key at http://InBio.bvu.edu/Facultx/kac/crandall_lab/dposada/documents/NCAkey_(240ct01 ^pdf. In the light of the results that we obtained, we used the correction of this key developed by Masta et al. (2003). Ambiguities were resolved following Pfenninger & Posada (2002), although the geographical criterion was not considered due to the small geographical scale of the system studied.. Migration rates The software MIGRATE (Beerli 1997-2002; Beerli & Felsenstein 1999, 2001) was used to calculate maximum likelihood estimates for migration rates and effective population sizes of the three geographical populations. The estimation process uses an expansion of the coalescent theory, so that Monte Carlo Markov Chains (MCMC) samplings of gene trees is used to estimate (i) 0= 2Neµ for each sampled subpopulation. ^!^,^s^^^-^^r^^hv c^^ Erer^itr pat^^^-.^= 139 ^^ ^. ^.
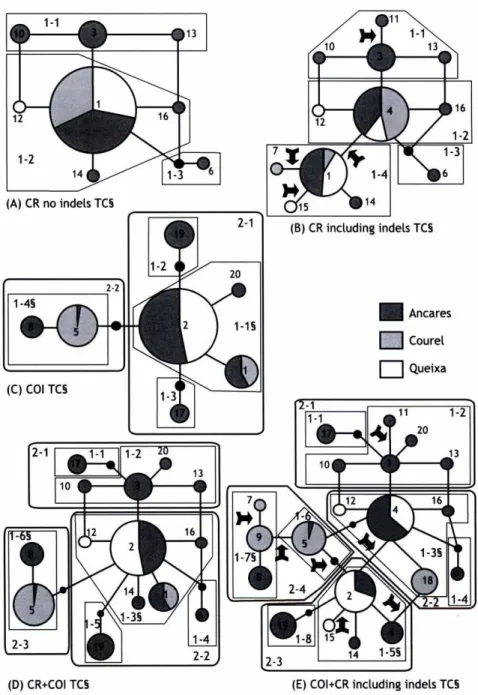
(33) and (ii) pairwise migration rates among subpopulations are scaled as M= Nem. We calculated the likelihood of different biologically plausible migration models defined a priori: (i) an unconstrained gene flow among the three populations; (ii) a stepping-stone model, where only neighbouring populations exchanged migrants; and (iii) a source-sink model, where only the northernmost populations (Ancares) provided the other two with migrants. The program used an FST -based-measure for the estimation of 0 and M, using the FST calculation only to generate starting values for the MCMC runs. We ran 10 short chains, each with a total of 10 000 genealogies and three long chains, each with 100 000 genealogies. We used 20 replicates and calculated the average from these. The first 10 000 genealogies in each chain were discarded. The transition/transversion ratios were set according to the results from MODELTEST (i.e. CR = 5.39, COI = 8.02, CR + COI = 4.87).. Results Twenty different haplotypes (Appendix) were identified when combining the 356 bp of the CR and 786 bp from the COL CR sequences yielded three indel and five substitution (four transitions, one transversion) polymorphisms. Each indel occurred as either a TA or a AT dinucleotide-repeat, and was coded as a single character. Indels did not pose any ambiguity when aligning the sequences. Exclusion of indel variation reduced the overall number of haplotypes to fourteen. In the COI part, all the nine transitions were recorded as third codon positions, except gene positions 811 (second position, nonsynonymous amino-acid change from Ser to Asn), 975 (first position, non-synonymous change from Ala to Ser) and 1059 (first position, synonymous change). Overall, ten substitution sites were informative for parsimony analysis.. Three haplotypes were defined by first and second codon position substitutions (COI), resulting in two amino acid changes. Those three haplotypes (8, 19 and 20) occurred only in the northernmost population, Ancares, in which haplotype 17, the closest to the root (Erebia meolans) was also located. Figure 2 displays the frequency of haplotypes in each population, whereas Figure 3 depicts the statistical parsimony network and Figure 4 the phylogenetic relationships of the haplotypes through a NJ tree. Within-population diversity values (Table 1) were greater for the northernmost population, Ancares, decreasing progressively southwards. The higher diversity for Ancares is not due to larger sample size, as shown by Vila & Bjdrklund (2004). Some haplotypes were defined by indels, which were not taken into account for haplotype nor nucleotide diversity estimates.. Networks The networks differed depending on whether the CR was included in the dataset (with and without indels; Fig. 3). The parsimonious cladogram was only fully resolved for the 140 ^--.
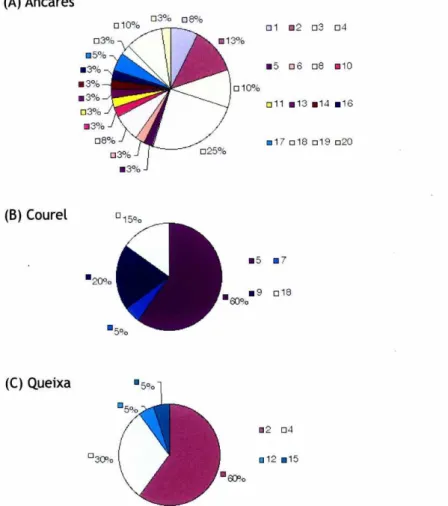
(34) (A)Ancares ❑ 10°0. ❑ ^°ó. ❑ 8°0. ❑1. ■ ^_. ❑3. ❑4. ■5. ❑b. ❑8. ■ 10. ❑ 3°ó ■ 5°ó ■ .^i°'ó ■ .^i°'ó ■ .^i°ó. ❑ 11 ■ 13 ■ 14 ■ 16. ❑ 3 %6 ❑ 8°ó. ■ 1? ❑ 18 ❑ 1^ ❑ ^0. ❑ 3°'ó ■ 3°.'ó. 1^1. (B) Courel ■5 ■ ^oo ■ ^J. ■' ❑ 18. (C) Queixa. ■2 ❑„. ❑4. ®12 ■ 15. Figure 2. The distribution of the 20 haplotypes defined by the combination of 352-356 bp from control region (CR) and 786 bp from cytochrome-oxidase-I (COI) in the three studied NW Iberian populations of Erebia palarica.. COI fragment (Fig. 3C). In the CR, two out of the three loops were caused by four of the five substitutions (positions 191, 259, 320, 343 in Figure 3B, Appendix). Ancares had haplotypes not shared with other populations in the COI network (Fig. 3C). If the CR was added to the data set, the sample from Queixa contained a new haplotype: 12 (Fig. 3D) and, if gaps were taken into account, the sample from Queixa contained yet another one (haplotype 15) and so does Courel with haplotypes 7, 9 and 18 (Fig. 3E). Localities do not form monophyletic clades for any of the markers. However, if Ancares is removed from the dataset, Courel and Queixa are reciprocally monophyletic regardless of using COI or CR+COI.. ^ir^e=s^ale phyío^edgra^hy c^f E?-ebio palar^^c^ 141.
(35) P^. D. Thesis. (A) CR no indels TC§ (B) CR including indels TC§. (C) COI TC§. 2-1. 1-1. 1-2 13. 10. 2-2 (D) CR+COI TC§. 2-3. ^. 14 1-5§. (E) COI+CR including indels TC§. Figure 3. Parsimony network showing abundance and occurrence of each haplotype depending on the mitochondrial marker used. CR+COI haplotypes labelled as in Appendix. Circle size reflects the frequency of each haplotype and solid lines connecting each haplotype (regardless of their length) represent a single mutational event. Small black circles represent missing or theoretical haplotypes. Arrows indicate indel mutational steps. (TC) Total cladogram (§) Statistically significant. (A) Control Region (CR) without indels, (B) CR including indels as Sth character, (C) Cytochrome-Oxidase-I (COI), (D) CR+COI without indels, (E) CR+COI including indels. 142 Paper V.
(36) CR+COI NJ HYK a= 0.0075. 1. 66. ®. ® Ancares. 18. O. Q Courel. 14. ®. 2. 0 Queixa. 5 86. 7. ®. 0. ®. ^. ^ 8® 9. O. 15. ^. 4. ^ 19 6. ® ®. 16. ®. 10. ®. 12. ^. 11. ®. 3. ® 13. ®. ®. 20. • 17. ®. E. meo(ons - 0.001 substitutions/site Figure 4. Neighbour joining (NJ) tree showing the phylogenetic relationships of the haplotypes defined by combining COI+CR. Bootstrap values higher than 55 % after 1 000 replicates, indicated in italics above branches. Colour circles indicate geographical occurrence of the haplotype.. NCA The one-step clades led invariably to an inference of a continuous range expansion (Fig. 3, Table 2). At the total cladogram scale, restricted gene flow/dispersal but with some long distance dispersal over areas not occupied by the species was inferred, regardless of the marker of use. Only the total cladogram for the CR without indels (Fig. 3A) led to an inference of restricted gene flow with isolation by distance.. ^^r^e-^^a^^ r^-^,^ ^^^-,. ^^.:^ ^ -,. u ^ ,^ i 143.
(37) __-. !?. T!-,=^. (A) COI Population N. S NH h(sd). rr (sd). k. e. Tajima's D. Ancares Courel Queixa. 9 3 0. 0.0017 (0.0003) 0.0010 (0.0004) 0. 1.310 0.805 0. 0.003 0.001 -. -1.1127 -0.1274 -. rr (sd). k. 6. Tajima's D. 0.0015 (0.0003) 0 0.0003 (0.0002). 0.5346 0.003 -1.0302 0 0 0 0.001 -1.1644 0.1. rr (sd). k. 40 20 20. 7 2 1. 0.595 (0.085) 0.268 (0.113) 0. (B) CR Population N S NH h(sd) 40 20 20. Ancares Courel Queixa. 6 2 3. 7 3 4. 0.729 (0.038) 0.416 ( 0.116) 0.574 ( 0.090). (C) CR+COI Population N S NH h(sd) Ancares Courel Queixa. e. Tajima's D. 40 15 14 0.887 (0.031) 0.0016 (0.0002) 1.8449 0.0027 -1.2367 20 5 4 0.605(0.101) 0.0007(0.0003) 0.8053 0.0007 -0.1274 0.0002 _ 1.1644 20 3 4 0.574 (0.09) 0.0001 (0.0001) 0.1. Table 1. Erebin palarica genetic diversity. Total number of sites: COI 786 bp, CR 352-356 bp. N: number of individuals, S: Number of segregating sites, NH: Number of haplotyes, h: Haplotype diversity, (n): Nucleotide diversity (per site), k: Average number of nucleotide differences, 6(per site, from S). Standard deviations in parentheses. Tajima's D was not significant in any analysis.. Marker. Nested clades. Permutational k2 statistic. P. Chain of inference Inference. COI. 1-1 1-4. 23.61 14.87. 0 0.004. 2-11-12-No 2-I1-12-No. Total cladogram Total cladogram Total cladogram. 48.23 12.75 20.85. 0 0 0.001. 2-3-5-6-7-8-Yes 2-3-4-No 2-3 -5-6-7-8 -Yes. 1-3. 23.26. 0.02. 2-11-12-No. 1-6 Total cladogram. 14.87 57.55. 0.003 0. 2-11-12-No 2-3-5-6-7-8-Yes. 1-3 1-5 1-7. 18.46 7.399 8. Total Cladogram. 60.35. 0.002 0.029 0.011 0. 2-11-12-No 2-11-12-No 2-11-12-No 2-3-5-6-7-8-Yes. CR no indels. CR indels CR+COI no indels. CR+COI indels. CRE. CRE RGF LDD RGF IBD RGF LDD CRE. CRE RGF LDD CRE CRE CRE RGF LDD. Table 2. NCA analysis: Chi-squared test of geographical association of clades and biological inference. Contingency tests based on 1 000 permutations. Inferences were obtained following the most updated key (Templeton 1998). CRE: Contiguous range expansion. RGF LDD: Restricted gene flow/dispersal but with some long distance dispersal over areas not occupied by the species. RGF IBD; Restricted gene flow with isolation by distance.. 144.
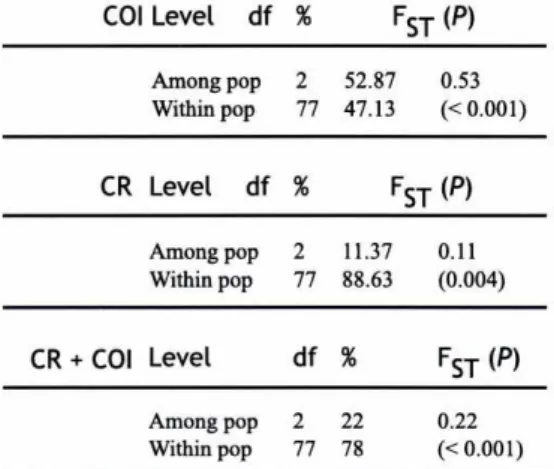
(38) `:'^^.`Ld v i. Population differentiation The AMOVA showed that there is a substantial divergence among populations, more pronounced for the COI data than for the CR. The combination of both markers resulted in a FST of 0.22, which is highly significant (Table 3A). If we separated the analyses into pairwise FST-values, we found large and highly significant differences using COI (Table 3B). A qualitatively similar pattern was found using CR, but here only two out of three values were significant (Ancares -Courel and Courel-Queixa) after adjusting for multiple tests (Table 3B). The combination of these two markers showed highly significant pairwise FST-values (Table 3B). Overall differentiation among populations is supported by the results of the global test of Raymond & Rousset (1995): COI P= 0, CR P= 0.002, CR+COI P= 0. The differentiation test between all pairs of populations resulted in no differentiation between Ancares and Queixa for the COI and CR (P = 0.1184 and 0.389, respectively). Nevertheless, when both markers were combined, population differentiation was significant (P < 0.05) for all pairs of populations. COI Level. df %. Among pop Within pop. CR Level. 2 77. FST ^P^ 52.87 47.13. df %. Among pop Within pop. CR + COI Level Among pop Within pop. 2 77. FST ^P^ 11.37 88.63. df % 2 77. 0.53 (< 0.001). 0.11 (0.004). FST ^P^. 22 78. 0.22 (< 0.001). Table 3A. AMOVA results for COI and CR separately and combined. P-values determined after 1 000 permutations.. Test for bottlenecks and expansion All populations showed signs of a recent bottleneck using the Var(S) test, regardless of marker used (Table 4). The variance in the frequencies of haplotypes was in all cases much larger than expected assuming a stable population. In general, some haplotypes were consistently over-represented, which is a sign of a bottleneck. The results from the mismatch distributions differed between markers. Thus, by using the COI, the null hypothesis of an expansion could not be rejected for Ancares (P = 0.56). For Courel the expansion model was rejected (P = 0.036) and for Queixa this test was not ^. ^,^ _ ^-:.^^w,:;^^^^^^ o:- c^^^^^ r^^ ^ ; - 145.
(39) COI. Ancares. Courel. Queixa. Ancares Courel Queixa. 0.0017 (0.0006) 0.52 (< 0.001) 0.15 (< 0.001). 0.0028 (0.0015) 0. 0010 (0. 0006) 0.87 (<0.0001). 0.0009 (0.0003) 0.0024 (0.0016) 0. CR. Ancares. Courel. Queixa. Ancares Courel Queixa. 0.0018 (0.0011) 0.14 (<0.0001) 0.02 (0.207). 0.0012 (0.0007) 0 0.24 (0.009). 0.0013 (0.0008) 0.0001 (0.0001) 0.0003 (0.0003). CR + COI Ancares. Courel. Queixa. Ancares Courel Queixa. 0.0023 (0.0010) 0.0007 (0.0004) 0.41 (< 0.001). 0.0010 (0.0003) 0.0017 (0.0011) 0.0001 (0. 0001). 0.0017 (0.0005) 0.21 (< 0.001) 0.11 (< 0.001). Table 3B. Below diagonal: Pairwise FST values and associated P-values, determined by randomisation. All FsT -values (except between Queixa and Ancares for the CR) are significant after sequential Bonferroni correction. Diagonal (in italics): within population average sequence divergence and standard error under Tamura-Nei (TrN) model. Above diagonal: Between populations average sequence divergence (TrN) and associated standard error. Standard errors determined after 500 bootstrap replicates.. COI. P. i. Var(S). Exp Var(S). 95 %. Ancares Courel Queixa. 0.56 0.04 na. 2.99 (0.52 - 6.97) 3.00 (0.53 - 4.25) na. 0.048 0.245 na. 0.0044 0.011 na. 0.0014 - 0.012 0.0028 - 0.028 na. CR. P. t. Var(S). Exp Var(S). 95 %. Ancares Courel Queixa. 0.33 0.09 0.04. 2.47 (0.62 - 5.51) 3.84 (1.03 - 5.90) 2.60 (0.46 - 6.36). 0.036 0.14 0.068. 0.0052 0.0076 0.0055. 0.0012 - 0.014 0.0021 - 0.018 0.0017 - 0.014. Table 4. Test for population bottlenecks and subsequent expansion. (P): p-value to test for population expansion by a pairwise mismatch distribution, (T): parameter of demographic expansion, (Var(S)): observed variance of haplotype frequencies, (Exp Var (S) and 95 %): coalescence simulated variance of haplotypes with 95 % intervals, (Na): not applicable.. 146.
(40) applicable since the population was monomorphic. Using the CR, the expansion model was not rejected for Ancares and Courel (P = 0.33 and 0.09, respectively), but for Queixa (P = 0.04). For all populations the time since the expansion seems consistent across populations with ^= 2.47-3.84, although the confidence intervals were large in all cases, making temporal inferences uncertain.. Migration and effective population size All tests yielded the highest 6 for the Ancares population, followed by Queixa and Courel, respectively, regardless of the marker (COI, CR+COI with or without indels) used (Fig. 5). The female effective population size was very low in all populations. These values are congruent with the 9 estimates (Table 1) calculated according to Tajima (1996). In all cases, migration was clearly asymmetric (Fig. 5). The migration model allowing all possible directions (Fig. 5) had a significantly higher likelihood than the stepping-stone. Stepping stone. All directions A 0.0062 C. 0.0002 0.0001. eA e^ eQ. A^. 0.0035 0. C ^. 0.0003. Q. Q. Log(L) = 7.184. Log(L) = 11.559. Log(L) = 8.988. COI. 0.0053. eA. 0.0063. 0. eC. 0.0001. 0.0003. 6Q. 0.0002. COI + CR with gaps. ^. A C. Log(L) = 8.125. Figure 5. Effect of differing migration matrices on estimated likelihoods in the coalescence analysis for the three populations of Erebia palar•ica. From left to right: migration rates estimates based from CR+COI on a gene-flow model reflecting all possible directions, an island-migration pattern and a source-sink model where Ancares provides with effectives to the other two populations. Migration rates (M) = N^ m where N^ = effective female population size and m = migration rate per individual per generation, are represented by arrows whose width and darkness is proportional to the gene-flow rate. Likelihoods for the migration patterns are given below each pattern. The all-directions model has significantly higher likelihood than the others (P < 0.05).. ^^^p-sc^^¢ ^,1,^,^^^^„^^^^^^r ^Qr^^^^: a ^^-^ . „tz^=^-^^i^ .. 147.
(41) ; ^^. ^. ^^,^^:e. one (LRT for CR+COI including gaps, x^ = 6.868, d.f. = 1, P< 0.01). The former showed high migration from Queixa to Ancares (M = 17.8) and from Courel to Ancares (M = 17.1), whereas migration from Queixa to Courel was zero, lower from Ancares to Courel (M = 0.72), and even lower from Courel to Queixa (M = 0.28) and Ancares to Queixa (M = 0.088). We also tested a Source-Sink model with the combined CR+COI data set and with Ancares as the source of migrants to the other two populations. The log-likelihood was significantly lower than the all-migration (LRT, x^ = 18.198, d.f. = 1, P< 0.001) and the stepping-stone (LRT, x^ = 11.33, d.f. = 4, 0.05 > P> 0.01) models.. Discussion We found strong geographic differentiation between the three populations. Pairwise FST-values were usually high and significantly different from zero, indicating highly structured populations. Haplotypes 15 (Queixa) and 7 and 9(Courel) are not found in the other locations and clustered together with other haplotypes found as well in the same population (Fig. 4). The NCA showed support for a model of restricted gene flow with occasional long-distance dispersal. All populations showed signs of bottlenecks, a fact supported by E. palarica female effective population sizes, which were relatively small (e.g. Britten & Glasford 2002; Hare et al. 2002). Gene flow estimates were highly asymmetric with regard to direction and intensity. The main routes went from the southernmost to the northernmost population and from the intermediate to the northernmost population. Such an unexpected pattern of historic gene flow in conjunction with the very high FST-values, the result of the bottleneck test and the very low estimated effective population sizes support the view that recent demographic events have played a major role in shaping the pattern of genetic variation among the populations of E. palaYica. The pertinent question to discuss is therefore the accuracy of the results from the analysis of historical gene flow and migration in face of the strong evidence for recent demographic events (Knowles & Maddison 2002).. Dispersal patterns The most-likely explanation for the restricted gene flow in the studied system is the evolution of the ecosystem (due to climatic oscillations) shaping suitable biotopes in different high-altitude areas. Many species of Erebia in southern and central Europe are considered as glacial relicts regarding their high altitude distribution areas (e.g. Schmitt & Seitz 2001a; Kudrna 2002). Once the cold periods were gradually taken over by warmer interglacials, biota adjusted their distributions retreating northwards or toward higher altitudes (e.g. in butterflies, Gutiérrez 1997; Schmitt & Seitz 2001b). Thus, it can be seen that species of the genus Erebia from Scandinavia exist in the lowlands, whereas no Erebia is found lower than 700 m in southern Europe (Kudrna 2002). We propose the. 148 II^^=.
(42) Nlarta Vi;. population structure found in our dataset to be originally shaped by genetic drift that occurred after isolation of the populations in altitude. We admit, in the light of topography and ecosystem similarity, that Ancares and Courel might have become isolated only with the highest risings in altitude and/or due to human settlements in between these areas. We argue that the "long distance dispersal" indicated by the NCA and MIGRATE estimates (routes and intensities) are currently impossible in an active way (larva or adult) and very unlikely in a passive one. Erebia palarica is not expected to be a long distance migrant (H. Descimon, pers. com.). The Satyrinae is not a long dispersing taxon (Clarke 1988; Loerstcher 1991; Sutcliffe et al. 1997; Casse12002; Cassel & Sjdgren-Gulve 2002; Bergman & Landin 2002; Leimar et al. 2003). Brussard & Ehrlich (1970) found no differences between sexes in the dispersion pattern of Erebia epipsodea. Douwes & Stille (1988) reported lack of migration behaviot^r in Erebia embla. Schmitt et al. (2000) found forests to be a barrier in the movements of Erebia medusa. Norberg et al. (2002) suggested that widely distributed species may have a greater trend toward habitat exploration than endemic and rare species. In this regard, the genus Erebia might be considered as mainly low dispersing due to the high extent of endemic species (Kudrna 2002).. Ancestral population As location of glacial refugia was beyond the scope of this study, the sampling design for this work does not allow us to assess any ancestral area. Statistical tests to distinguish whether there were one or several refugia by using a gene-tree population-tree approach (e.g. Knowles 2001) were not feasible due to the fact that haplotypes were found in more than one geographical location. Nevertheless, three facts provide some support for a single ancestral population for the three studied areas: (i) the sharing of some haplotypes; (ii) the all-directions migration model has higher likelihood than the stepping-stone and source-sink models; and (iii) the one-step clades in NCA (leading to contiguous range expansion) connect the three localities. At such a temporal scale, we would expect the most diverse population to contain the oldest haplotypes. If divergence were primarily associated with glacial periods when populations were displaced to allopatric refuges, regional structuring of genetic variation would be expected (Knowles 2001). Conversely, if divergence were associated with successive founder events during recolonization of previously glaciated areas, recently founded populations should be derived relative to one source population and show reduced levels of diversity. As an alternative scenario, ignoring the occurrence of bottlenecks, our data would iit the second case. The gradient of genetic diversity decreasing from Ancares to Queixa (Table 1) could be explained by a gradual loss of variation in the direction of the post-glacial colonization as a result of lineage-sorting through a leading-edge effect (Hewitt 1996), southwards in this fine geographical scale. However, the results of the analyses are not conclusive regarding these two hypotheses. The results from MIGRATE _9^^a^^ ^,^^i^^ec^^ra^at^^, nt ^^^^gf^ ^^-G °--= 149.
Figure


+7


Documento similar
The Dwellers in the Garden of Allah 109... The Dwellers in the Garden of Allah
In a similar light to Chapter 1, Chapter 5 begins by highlighting the shortcomings of mainstream accounts concerning the origins and development of Catalan nationalism, and
In the previous sections we have shown how astronomical alignments and solar hierophanies – with a common interest in the solstices − were substantiated in the
Díaz Soto has raised the point about banning religious garb in the ―public space.‖ He states, ―for example, in most Spanish public Universities, there is a Catholic chapel
teriza por dos factores, que vienen a determinar la especial responsabilidad que incumbe al Tribunal de Justicia en esta materia: de un lado, la inexistencia, en el
In the preparation of this report, the Venice Commission has relied on the comments of its rapporteurs; its recently adopted Report on Respect for Democracy, Human Rights and the Rule
Our results here also indicate that the orders of integration are higher than 1 but smaller than 2 and thus, the standard approach of taking first differences does not lead to
If the concept of the first digital divide was particularly linked to access to Internet, and the second digital divide to the operational capacity of the ICT‟s, the
