Capillary electrophoresis for caffeine and pyroglutamate determination in coffees / C Barbas [et al ]
6
0
0
Texto completo
(2) 1096. N. Maeso et al. / Journal of Pharmaceutical and Biomedical Analysis 41 (2006) 1095–1100. release of acetylcholine in the brain cortex [1], protection against glutamate-induced neurotoxicity [20] or improved cerebral perfusion [15]. Furthermore, in one double-blind study with aged human subjects, verbal memory was improved by pyroglutamate compared to placebo [11]. These antecedents raise the possibility that the pyroglutamate content of the coffees could provide them with some central activities previously associated with caffeine, another natural component of the coffees that reduces fatigue, improves attention and enhances cognition by modulating dopamine and adenosine central functions [13]. In the manufacture of instant coffee, extraction follows the roasting and grinding operations. The soluble solids and volatile compounds that provide aroma and flavour are extracted from the coffee beans using water. Water heated to about 175 ◦ C (347 ◦ F) under pressurized conditions (to maintain the water as liquid) is used to extract all of the necessary solubles from the coffee beans. Manufacturers use both batch and continuous extractors. Following extraction, evaporation or freeze-concentration is used to increase the solubles concentration of the extract. The concentrated extracts are then dried in either spray dryers or freeze dryers. Therefore, different treatments could produce a different pyroglutamate content. Additional operations associated with processing green coffee beans include decaffeination, the process of extracting caffeine from green coffee beans prior to roasting. Different factors, such as blend composition, brewing extraction rates, the grind or the water temperature, can slightly alter the level of caffeine in decaffeinated coffee so that it is above or below the typical caffeine level. Nevertheless, the simultaneous determination of both caffeine and pyroglutamate, has, to our knowledge, not been described. The aim of this study was to develop and validate a simple and reliable CE method to determine simultaneously caffeine and pyroglutamate in coffee, then to measure, by applying this method, the content of these compounds in usual brands of instant coffees bought in the local supermarket and finally, to assess the effects of instant coffees with different amounts of caffeine and pyroglutamate on locomotor activity and learning/memory in mice.. 2. Materials and methods 2.1. Instrumentation The separation was performed on a capillary electrophoresis P/ACE 5010 (Beckman) with UV detection at 200 nm. The injection was by pressure (0.035 bar) for 5 s. The separation was carried out with an uncoated fused-silica capillary (57 cm × 50 m i.d.) and was operated at 10 kV potential. Temperature was maintained at 25 ◦ C. The background electrolyte was prepared with 0.05 M H3 BO3 and 130 mM SDS, as anionic surfactant to decrease electroosmotic flow, and pH adjusted by adding NaOH to 9.5. The current generated in such conditions was 25 A. The capillary was flushed between runs with 0.1 M NaOH for 3 min, H2 O for 3 min and the background electrolyte for 5 min. Several parameters were studied during the optimization of the method, such as nature, pH and concentration of the BGE, SDS concentration and applied potential were also tested. 2.2. Chemicals Standards were obtained from Sigma (St. Louis, MO, U.S.A.). Boric acid was from Merck (Darmstadt, Germany), sodium hydroxide and SDS from Panreac (Madrid, Spain) and organic solvents from Scharlau (Barcelona, Spain). 2.3. Samples Samples of coffee with different origins and treatment were obtained from different brands available in the market. The characteristics were only known through their labels, which contained scarce information and are listed in Table 1. Although our work was focused on instant coffees, a standard grain coffee, brewed in the laboratory was included as a control. For the analysis, samples were prepared in triplicate with 1 g of instant coffee in 100 mL volumetric flasks with purified water. Then, samples were diluted 1:4 (v/v) with purified water, and filtered through 0.45 m nylon filters prior to analysis.. Table 1 Characteristics of coffee samples assayed Characteristics described in the label. Caffeine (mg/g coffee)*. Instant coffee, lyophilised Instant coffee, lyophilised, Colombia Instant coffee, lyophilised, decaffeinated Instant coffee, decaffeinated Grain coffee, brewed in the laboratory Instant coffee Instant coffee, decaffeinated Instant coffee, decaffeinated. 45.9 36.6 3.8 4.7 19.8 41.8 4.59 3.5. 9 10. Instant coffee, decaffeinated Instant coffee, lyophilised, Colombia. 3.6 ± 0.31 C 30.8 ± 2.2 D. 8.7 ± 0.44 de 9.8 ± 0.93 e. 11. Instant coffee, decaffeinated. 3.94 ± 0.33 C. 8.67 ± 0.18 de. Sample identification 1 2 3 4 5 6 7 8. Mean ± S.D. Different letters show statistical difference. * p < 0.05.. ± ± ± ± ± ± ± ±. 2.4 A 0.80 B 0.33 C 0.42 C 0.32 F 1.0 E 0.28 C 0.67 C. Pyroglutamate (mg/g coffee)* 4.3 6.5 10.12 6.1 0.09 8.6 7.0 7.51. ± ± ± ± ± ± ± ±. 0.52 b 0.18 c 0.36 e 0.28 c 0.01 a 0.29 de 0.05 c 0.15 cd.
(3) N. Maeso et al. / Journal of Pharmaceutical and Biomedical Analysis 41 (2006) 1095–1100. 2.4. Validation Individual stock solutions of caffeine (5 mM) and pyroglutamic acid (50 mM) in purified water were prepared and stored at −4 ◦ C. On the day of the analysis they were mixed and diluted to the final working concentrations of 0.5 mM for caffeine and 0.125 mM for pyroglutamate. Linearity of response for standards was tested by assaying in triplicate using six levels of concentrations, ranging from 12.5 to 625 M for pyroglutamic acid and from 4 to 200 M for caffeine, covering in this way all the expected values as much in classic as in decaffeinated coffees. Recovery was estimated by comparing the values obtained in the linearity test for spiked samples with the corresponding standards linearity, taking into account the coffee concentrations which had been previously quantified. Within-day precision was tested both to check the constancy of instrumental response to a given analyte and the repetitiveness of concentrations. For this purpose, the assay was performed with six solutions of standards and six of samples, in the medium concentration of the calibration curve for both compounds. The same experiment was done on a different day with buffer and samples freshly prepared for intermediate precision. Limits of detection were calculated following IUPAC recommendations [(a + 3SB )/b], where a is the intercept, b the slope and SB is the standard deviation of the blank, for chromatographic methods [12] by extrapolating to zero concentration the standard deviation of the last three points of linearity and interpolating this value in the corresponding equation.. 1097. which animals learn to avoid an electrical discharge by suppressing their natural preference for dark environments. This test is widely used in testing the effects of memory active drugs [18,19]. Animals received orally either tap water or coffee solutions (1 g/kg) as explained above. One hour afterwards, mice received an i.p. injection either of saline (controls) or scopolamine (1 mg/kg), a drug commonly used to induce learning deficits. Thirty minutes after the i.p. treatment, a task acquisition trial was conducted by means of a two-compartment apparatus (Ugo Basile, Italy). For this purpose the animals were placed in a white, illuminated chamber connected to a dark compartment by a guillotine door. As soon as the animals entered the dark compartment, the door closed and mice received a mild electric footshock (0.5 mA, 2 s) by means of the electrified grid floor. The latency for this response was recorded and those animals showing latencies longer than 60 s (cut-off) were not used further. Twenty-four hours afterwards a retention trial was conducted exactly as the acquisition trial, and positive learning was defined by step-through latency higher than 60 s. 3.4. Statistics Statistical differences between experimental groups regarding motility counts were determined using ANOVA followed by Newman Keuls post hoc test. In the passive avoidance study, learning frequencies were compared with the Fisher’s exact test. Comparisons with p < 0.05 were considered to be significant.. 3. Pharmacological studies. 4. Results and discussion. 3.1. Animals. The simultaneous separation of caffeine and pyroglutamate in coffee was optimised by testing first the suitability of the already existing methods for pyroglutamate and caffeine individually [5,9]. Caffeine did not pass the detector in reversed polarity; therefore, efforts were headed towards the optimization of separation conditions in normal polarity where both compounds were eluted, with micelles formed with SDS and pH around 7.0. Final conditions, described in the previous section, were selected after testing different potentials, buffer concentrations and pH, by injecting different types of coffee and considering mainly the resolution of caffeine from other peaks in the profile, which was the main issue. Fig. 1 shows the electropherograms corresponding to the standards and a coffee sample. Selectivity was proved for caffeine by injecting a decaffeinated coffee and looking at a minimum peak appearing with the same spectrum and migration time as the large peak in normal coffee. For pyroglutamate selectivity was proved by quantifying the response obtained with the previous method with reverse polarity.. Male OF1 Swiss albino mice weighing 25–30 (Charles River, Lyon, France) were used. The animals were housed in a controlled environment (22 ± 1 ◦ C, 55 ± 10% humidity, 12-h light:12-h dark cycle) and were fed ad libitum with standard rodent diet (RMM, Harlan Interfauna Ibérica, Madrid, Spain). All experiments were conducted between 09:00 and 17:00 h in a noise-free environment. The experimental protocols were approved by the Institutional Ethical Committee. 3.2. Locomotor activity Animals received 10 ml/kg, p.o., of either tap water (controls) or coffee solutions prepared by solving 1 g of each instant coffee in 10 mL of tap water (dose = 1 g/kg). Immediately after oral administration, mice were isolated in plexiglass cages (25 cm × 25 cm × 14 cm) and left to acclimatize to the environment for 5 min. Motility counts (arbitrary units) were then recorded for 60 min by means of a magnetic device (Panlab, Barcelona, Spain) placed at the bottom of the cages. 3.3. Passive avoidance The effects of coffees on learning/memory were assessed by means of a step-through passive avoidance procedure, in. 4.1. Validation Once both compounds were identified by migration time as compared with the standards and by spiking, selectivity was proved as described above. All the calculi were performed with peak areas..
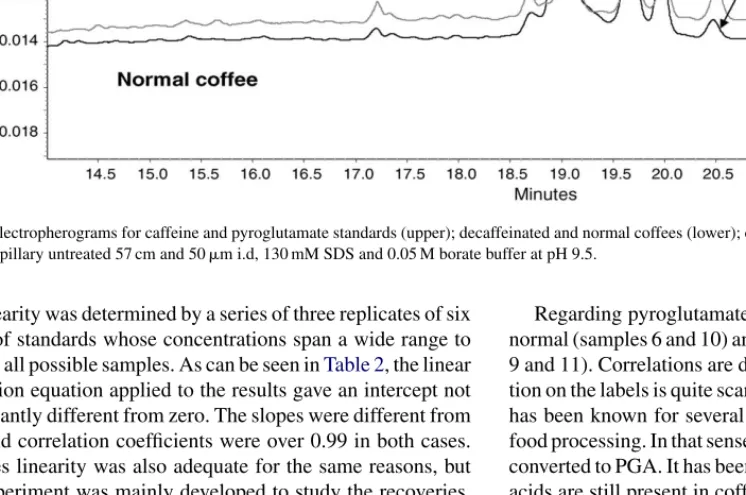
(4) 1098. N. Maeso et al. / Journal of Pharmaceutical and Biomedical Analysis 41 (2006) 1095–1100. Fig. 1. Electropherograms for caffeine and pyroglutamate standards (upper); decaffeinated and normal coffees (lower); conditions: UV detection at 200 nm, voltage 10 kV, capillary untreated 57 cm and 50 m i.d, 130 mM SDS and 0.05 M borate buffer at pH 9.5.. Linearity was determined by a series of three replicates of six levels of standards whose concentrations span a wide range to include all possible samples. As can be seen in Table 2, the linear regression equation applied to the results gave an intercept not significantly different from zero. The slopes were different from zero and correlation coefficients were over 0.99 in both cases. Samples linearity was also adequate for the same reasons, but this experiment was mainly developed to study the recoveries. All the recoveries include 100% and R.S.D.s presented very adequate values. Intra-assay precision of the method for samples gave R.S.D. ranging 4.2–6.4% considering both standards and samples. On two different days, R.S.D. values were very similar. Limits of detection were lower than the expected values in samples. Therefore, the method can be considered suitable for the intended purpose. 4.2. Coffee analysis Once the method was optimised and validated the different coffee samples were measured and results are listed in Table 1. When an ANOVA test was applied, no statistically significant difference was found (p < 0.05) in caffeine content among the decaffeinated coffees (samples 3, 4, 7–9 and 11); meanwhile, normal coffees showed statistically significant differences. These results could be related with different origin and/or industrial processes.. Regarding pyroglutamate, higher values were found both in normal (samples 6 and 10) and decaffeinated coffees (samples 3, 9 and 11). Correlations are difficult to establish, as the information on the labels is quite scanty. The thermal lability of nutrients has been known for several decades, especially as it relates to food processing. In that sense, l-glutamate can be spontaneously converted to PGA. It has been shown that virtually no free amino acids are still present in coffee beans after roasting for 5 min at 220 ◦ C [14]. 4.3. Animal experimentation After the quantification, four instant coffees were selected for in vivo experimentation: coffee 1 because it had the highest caffeine in the group with a proportionally low pyroglutamate content, coffees 3 and 11 due to their high pyroglutamate with low caffeine content and finally coffee 4 with similar content in both compounds. Coffee 1 was the most potent in producing locomotor stimulation and the only one to achieve statistical differences when compared to the control group. Coffees 3 and 4 also tended to increase locomotor activity but the effect was not significant, and coffee 11 was devoid of any apparent action on this test (Fig. 2). Concerning passive avoidance studies, the administration of coffee 1 produced in all the animals a large increase of latency, always exceeding the cut-off time during the acquisition trial. This effect disabled our procedure to measure.
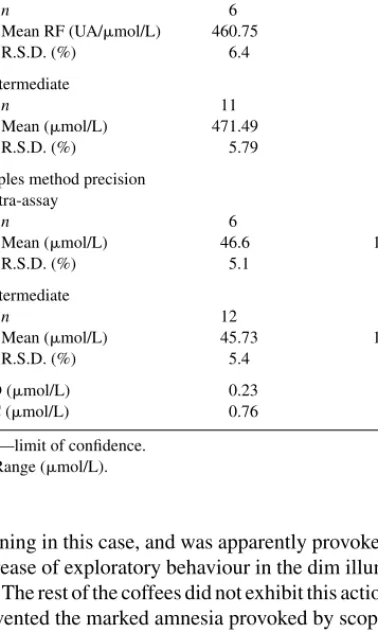
(5) N. Maeso et al. / Journal of Pharmaceutical and Biomedical Analysis 41 (2006) 1095–1100. 1099. Table 2 Main validation parameters for the analytical method for the determination and quantification of caffeine and pyroglutamic acid in coffee Coffee. Linearity Standards Intercept ± L.C. Slope ± L.C. Accuracy Samples r Recovery (%) R.S.D (%). Caffeine (12.5–626.18a ). Pyroglutamic acid (4.29–214.30a ). 1157 ± 10555 500 ± 30. 341 ± 1109 90.3 ± 8.2. 0.995 98.9 4.5. 0.994 103.1 4.8. Instrumental precision Standards n Mean RF (UA/mol/L) R.S.D. (%). 6 499.98 2.8. 6 90.77 1.8. Standards method precision Intra-assay n Mean RF (UA/mol/L) R.S.D. (%). 6 460.75 6.4. 6 83.6 5.5. 11 471.49 5.79. 12 81.44 6.48. Intermediate n Mean (mol/L) R.S.D. (%) Samples method precision Intra-assay n Mean (mol/L) R.S.D. (%) Intermediate n Mean (mol/L) R.S.D. (%) LOD (mol/L) LOC (mol/L). 6 46.6 5.1. 6 134.9 4.2. 12 45.73 5.4. 12 137.8 5.1. 0.23 0.76. 0.69 2.30. L.C.—limit of confidence. a Range (mol/L).. learning in this case, and was apparently provoked by a marked increase of exploratory behaviour in the dim illuminated chamber. The rest of the coffees did not exhibit this action and partially prevented the marked amnesia provoked by scopolamine injection, coffee 3 being the only one to produce a significant increase of the number of mice that learned the task (Fig. 3). The combined results of the biological evaluation of the coffees showed a marked stimulating effect of coffee 1, as shown by the significant increase of locomotor activity and the marked potentiation of exploratory behaviour during passive avoidance acquisition trials. This effect was expected due to the high caffeine content of the sample. The low caffeine content of coffees 3 and 4 could account for their residual tendencies to increase locomotor activity; however, these effects were not significant and both these coffees and coffee 11 lacked any prominent effect. Fig. 2. Locomotor activity exhibited by mice orally treated with tap water (control) or coffee solutions (1 g/kg). Bars are means and S.E. from at least nine determinations. * p < 0.05 vs. control.. Fig. 3. Learning assessed by the passive avoidance test in mice treated with saline i.p./tap water p.o. (control), scopolamine/tap water (s) and scopolamine/coffee (s/c). * p < 0.05 vs. control; # p < 0.05 vs. scopolamine.. on exploratory behaviour, since all the animals treated showed normal latencies below 60 s in acquisition trials. Therefore, the psychomotor stimulant effects of coffees 3, 4 and 11, if any, was only mild at the dose tested, and hardly explain the tendency of these coffees to enhance cognition in passive avoidance experiments. Rather, the pyroglutamate content of these coffees may account for their tendency to reverse scopolamine amnesia, since coffee 3 was the most active and also exhibited the higher content of pyroglutamate. Anyway, these results must be considered preliminary and require further confirmation by assaying different doses, additional tests of learning/memory and appropriate pharmacological experiments to clarify the mechanisms of these actions. References [1] T. Antonelli, V. Carla, L. Lambertini, F. Moroni, C. Bianchi, Pharmacol. Res. Commun. 16 (1984) 189–197. [2] B. Baena, D. Garcia-Martinez, C. Barbas, J. Chromatogr. A 1051 (2004) 199–205..
(6) 1100. N. Maeso et al. / Journal of Pharmaceutical and Biomedical Analysis 41 (2006) 1095–1100. [3] C. Barbas, N. Adeva, R. Aguilar, M. Rosillo, T. Rubio, M. Castro, Clin. Chem. 44 (1998) 1340–1342. [4] C. Barbas, A. Garcı́a, L. Miguel, C. Simó, J. Chromatogr. B 780 (2002) 73–82. [5] C. Chen, C. Liang, J. Lai, Y. Tsai, J. Tsay, J. Lin, J. Agric. Food Chem. 51 (2003) 7495–7503. [6] V. Galli, A. Garcı́a, L. Saavedra, C. Barbas, Electrophoresis 24 (2003) 1951–1981. [7] V. Galli, N. Olmo, C. Barbas, J. Chromatogr. A 894 (2000) 135–144. [8] V. Galli, N. Olmo, C. Barbas, J. Chromatogr. A 949 (2002) 367–372. [9] V. Galli, C. Barbas, J. Chromatogr. A 1032 (2004) 299–304. [10] A. Garcia, C. Barbas, R. Aguilar, M. Castro, Clin. Chem. 44 (1998) 1905–1911. [11] S. Grioli, C. Lomeo, M. Quattropani, G. Spignoli, C. Villardita, Fundam. Clin. Pharmacol. 4 (1990) 169–173.. [12] G.L. Long, J.D. Winefordner, Anal. Chem. 55 (1983) 712–724. [13] M. Lorist, M. Tops, Brain Cogn. 53 (2003) 82–94. [14] H.G. Maier, 12th International Scientific Colloquium on Coffee, ASIC, Paris, 1987, pp. 229–237. [15] S. Mirzoian, M. Zalinian, M. Balasanian, A. Topchian, Eksp. Klin. Farmakol. 57 (1994) 22–24. [16] L. Saavedra, C. Barbas, Electrophoresis 24 (2003) 2235–2243. [17] L. Saavedra, A. Garcia, C. Barbas, J. Chromatogr. A 881 (2000) 395–401. [18] A. Sahgal, Behavioural Neuroscience, IRL Press, Oxford, 1993, pp. 49–56. [19] H.G. Vogel, W.H. Vogel, Drug Discovery and Evaluation, Springer, Berlin, 1997. [20] X.-Q. Xiao, G.-Q. Liu, Zhongguo Yaoli Xuebao 20 (1999) 733– 736..
(7)
Figure
Documento similar
Method: This article aims to bring some order to the polysemy and synonymy of the terms that are often used in the production of graphic representations and to
The expansionary monetary policy measures have had a negative impact on net interest margins both via the reduction in interest rates and –less powerfully- the flattening of the
Jointly estimate this entry game with several outcome equations (fees/rates, credit limits) for bank accounts, credit cards and lines of credit. Use simulation methods to
In our sample, 2890 deals were issued by less reputable underwriters (i.e. a weighted syndication underwriting reputation share below the share of the 7 th largest underwriter
The aim of this study was to determine the morphometric variation in three wild populations of Brycon dentex in the Guayas basin rivers and their connections to fishing management
Therefore, the aim of this study was to produce blueberry vinegar by the Schützenbach method using spontaneous acetification and using inoculation with an
The aim of this study is to carry out the process of translation and adaptation to Spanish of the locus of control in sport’s scale for children (Tsai and Hsieh, 2015) and to
The aim of the present PhD thesis was to validate the feasibility of coffee by-products (husk, parchment, silverskin and spent coffee grounds) as novel food ingredients for a
