KPIs in the UK's construction industry : using system dynamics to understand underachievement = Indicadores de desempeño en la industria de la construcción en el Reino Unido : usando sistemas dinámicos para entender el incumplimiento de metas
14
0
0
Texto completo
(2) Abstract. In 1998 Egan set overall goals for the improvement of the construction industry in the UK. The improvements proposed have not been met. It is necessary to the identify the reasons by which the construction Industry is unable to achieve these goals, in order to implement the relevant measures to ensure the UK meets international performance standards and achieves its potential.. This paper critically analyses current use of KPIs within different contexts and identifies reasons as to why they serve purposes for which they were not intended. Building upon it, this paper applies System Dynamics theory in order to explain underachievement. Finally, recommendations and KPIs are proposed.. Key words: construction industry, system dynamics, KPIs.. Resumen. En 1998 Sir John Egan propuso metas para el mejoramiento de la industria de la construcción en el Reino Unido. Estas mejoras propuestas no se han cumplido. Resulta necesario identificar las razones por las cuales la industria de la construcción es incapaz de alcanzar estas metas, de modo de implementar las medidas adecuadas para asegurar que el Reino Unido alcance niveles internacionales de desempeño y desarrolle su potencial.. Este artículo analiza críticamente el actual uso que se les da a los indicadores de desempeño dentro de distintos ámbitos, identificando las razones por las cuales estos indicadores no sirven para el propósito que inicialmente se les dio. Basándose en lo anterior, este artículo aplica teoría de sistemas dinámicos para explicar la incapacidad de cumplir con las metas. Finalmente, recomendaciones e indicadores son propuestos.. Palabras clave: construcción, sistemas dinámicos, indicadores.. 70 ]. Revista de la Construcción Volumen 8 No 1 - 2009. ]. Roberts, M. - Latorre, V.. [. páginas: 69 - 82.
(3) Background. Methodology. The Construction Industry is an important contributor to the economy of the UK (Barr, 2004; Strategic Forum, 2002), and after the current downturn it is expected to double its size (CIOB, 2009). In 2008, the industry’s output in the UK was over £82 billion, equivalent to 6 % of the Gross Domestic Product (Office for National Statistics, 2009). The British government, identifying problems within the Construction Industry, has sought to shape and influence the workings of the industry with the publication of numerous reports over several years (Langford and Murray, 2003). During the 1990’s the government commissioned two influential reports, Latham’s “Constructing the Team” (1994) and Egan’s “Rethinking Construction” (1998). Both contributed to the increasing recognition by the industry that improvements and change were required. Both reports are seen as responsible for the industry’s current efforts to create an environment of continuous improvement coupled with initiatives, which are intended to provide step changes in the performance of the Construction Industry. Egan set the first quantifiable targets to challenge the Construction Industry (Barr, 2004). These targets propose annual incremental percentage change per year (Egan, 1998). In order to meet those targets, it became critical to measure the performance of the Construction Industry and to track the improvements due to the adoption of those initiatives. This led to the development and proliferation of Key Performance Indicators (KPIs) for the industry. These KPIs have been developed in order to measure the performance of construction projects in relevant areas, such as client satisfaction (product and service), defects, cost predictability (project, design, construction), time predictability (project, design, construction), profitability, productivity, safety, cost and time.. This article is the first of two papers which present a research project developed in order to identify the obstacles which prevent the achievement of the overall performance desired for the UK’s Construction Industry. The first paper is a critical appraisal of KPIs within a wider context, along with an attempt to apply the existing System Dynamics theory to explain this underperformance phenomenon. The second paper includes the analysis of qualitative data obtained from construction managers which is used to triangulate results; it will be published at a later date.. Research problem Despite efforts made by the British government and private companies within the Construction Industry, the goals set by the Egan Report (1998) have not been met. The construction industry is underperforming. Identifying the obstacles to meeting these goals allows the UK’s Construction Industry as a whole to develop the strategies which will enable the changes required to achieve the performance desired.. páginas: 69 - 82. ]. In order to identify the relevant theories which would allow explaining the UK’s Construction Industry underperformance (or inability to meet its goals), this research has applied a two-stage approach. The first stage involves the comparative analysis of the effectiveness of KPIs within different wider contexts. The second stage involves identifying theoretical elements which help to explain the industry’s underperformance, and determining whether those theories are suited to the problem.. Scope In this first paper, it is necessary to use historical quantitative data, obtained from governmental sources. This relevant data is used to analyse and later explain the performance of the UK’s Construction Industry over a period of 9 years (1999-2007).. Performance measurement systems The implementation of a workable performance measurement system into the project is essential to allow data from each project to be easily collected. This enables the possibility of providing timely feedback to the project team, and allows comparison with the overall performance of the industry. However, even when performance measurement systems are designed correctly, the implementation is a problematic stage (Neely, 1999). This section analyses the use of KPIs within several wider contexts: Benchmarking, conversion curves, the construction company’s objectives, KPIs being lagging measures, the lack of valid measurement guidelines, the influence of contract modalities, and accuracy of results.. Roberts, M. - Latorre, V.. [. Revista de la Construcción Volumen 8 No 1 - 2009. [ 71.
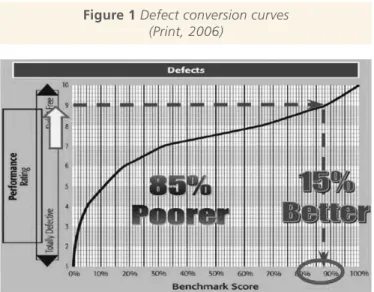
(4) Benchmarking Benchmarking is used in order to improve the overall performance of an industry. The objective of benchmarking is the adaptation of better practices that lead to superior performance (Department for Business Enterprise and Regulatory Reform, 2009; Benchmarking Index, 2007); helping to improve process effectiveness, product quality and service delivery (Office of Government Commerce, 2009). Benchmarking models from the Office of Government Commerce (2009), Audit Commission (2000), Public Sector Benchmarking Service ( 2 0 0 6 ) a n d B e a t h a m e t a l . ( 2 0 0 4 ) , p ro v i d e step-by-step guides to benchmarking. W ithin those benchmarking systems, KPI measurement and results are only a part of the process. For example, the 8-stage process for benchmarking from the Audit Commission (2000) considers defining and collecting KPIs within one stage of the overall process. Other important phases in the benchmarking process are, for example, to recognise which process to target and to establish and adopt initiatives that provide better results. The two latter allow the benchmarking process to be more effective within a wider scope. Therefore, KPIs can provide only a partial view of the overall performance improvement process.. Conversion curves (not a good way to benchmark) A factor which has an impact on overall performance scores is conversion curves (Barr, 2004). Conversion curves are cumulative frequency distribution curves of Construction Industry performance (Print, 2006), as shown in Figure 1. There are two effects from using these ogive curves. Firstly, the central section with the flattest gradient, where most results are likely to fall, allows the maximum performance improvement from the smallest increase in raw data. Hence, the area that most respondents fall into is the area that will deliver the biggest increases in benchmark scores for the smallest increments of data input. Increased difficulty in improving performance is not likely to occur until several iterations of the benchmarking framework. Secondly, when performance approaches the 80% to 85% area, the increase in input has to be significantly greater to achieve smaller returns. This encourages a bunching of projects in the central flatter section. This performance is fed back into the production of the annual KPI survey data that accentuates the shape of the ogive curve (Barr, 2004). Although these curves provide a good overview of performance results, they promote the achievement of benchmarks below 90%.. Figure 1 Defect conversion curves (Print, 2006). 72 ]. Revista de la Construcción Volumen 8 No 1 - 2009. ]. Roberts, M. - Latorre, V.. [. páginas: 69 - 82.
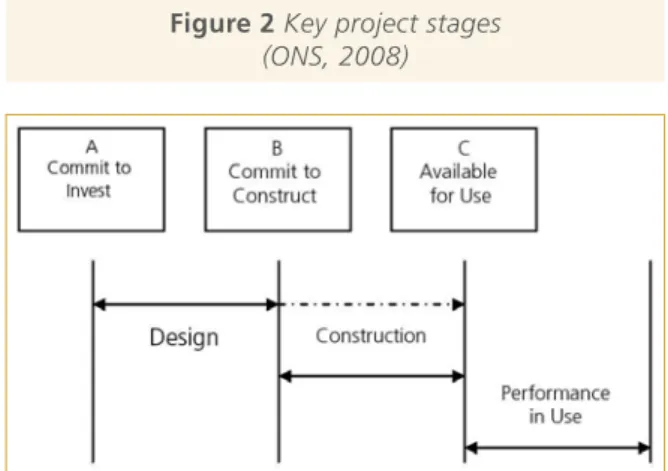
(5) Construction company’s objectives Clients have used KPI results as a measure to assess companies, in order to determine whether they would work with a company or not. This has shifted the objective of KPIs from being an internal tool to improve performance, to one which enables to market the company. This has had a negative effect on project performance; the impact has been twofold: it has promoted the use of KPIs for marketing purposes, and it has focused on measuring aspects which are not conducing to improving the project’s performance. When staff are required to measure performance for marketing purposes instead of improving the engineering and management processes, they lose the positive motivation factor of measuring processes over which they have control and can implement new initiatives. Furthermore, KPI data collection without actions being taken based on those results are a time-wasting exercise and should be avoided (Beatham et al., 2004). Applying a market-oriented perspective means emphasising on measuring the outcome of processes which may not be relevant the overall performance of a project. Losing, therefore, the opportunity to improve the performance of the project, and the overall performance of the construction company (Beatham et al., 2004). In fact, Kaplan and Norton (1996) argue that performance measurement systems should be developed from the objectives of the project (not vice-versa), and that these measures or KPIs should be aligned with the company’s strategy.. KPIs are lagging measures. change and adopt initiatives to correct measured results within project time. For example, the Respect for People indicators (Office for National Statistics, 2008) are leading indicators, which are the best at providing information to the project team within the project time (Beatham et al, 2004; Swann and Kyng, 2004). In fact, Beatham et al (2004) consider it a need to have a KPI system which contributes to the decision-making process; KPIs must provide early information as they should assist this process. This enables change within the project time and guarantees that the chosen KPIs are relevant to the project objectives and measures the optimal process.. Lack of valid measurement guidelines The inexistence of appropriate measurement guidelines leads to inaccuracy in the measurement and results. In fact, two different approaches to measurement, equally correct in their own way, will produce different results. In Figure 2, at the Commit to Construct point (B) the design may only be 75% complete, as can occur on, for example, Design, Build, Finance and Operate (DFBO) contracts. In contrast, on a Lump Sum contract at the same stage, the design will be almost 100%. Then, for the purpose of KPI measurements, if point B is the stage until which design is measured, the results obtained from these two contract modalities are not comparable to each other. These results cannot be aggregated to form the headline KPIs nor even as a comparator between two projects within a company. The lack of validation. The most significant issue with KPIs is that they are lagging measures; they do not offer the opportunity to change the path of the project (Beatham et al., 2004). Lagging measures assess complete performance results and as such provide historical information. Hence, they cannot contribute either to the project’s decision-making process or to improving project’s results. In fact, most of the processes of measurement are, in reality, just recording the history of the project and normalising it in order to compare it with the market’s KPIs. It is rarely collected fast enough or in time to be used within the time frame of the project (McClements et al, 2002). Leading measures, in contrast, do offer the opportunity to. páginas: 69 - 82. ]. Roberts, M. - Latorre, V.. Figure 2 Key project stages (ONS, 2008). [. Revista de la Construcción Volumen 8 No 1 - 2009. [ 73.
(6) and guidance on issues such as contract modalities undermines the use of KPIs as a dependable measurement tools for performance (Department of Trade and Industry, 2006). Without a validated method of measuring continuous improvement, the industry lacks the evidence to support its push on, for example, partnering initiatives (Barr, 2004). Initiatives such as comparing like-for-like projects have only been launched recently; their effectiveness has not yet been demonstrated. Furthermore, it is only available to subscribers (KPIzone, 2009). Cost and time KPIs can only be of real use when projects are comparable in a direct manner, with same units. When the differences between projects and the comparator are many, the results are inaccurate. One of the distinguishing features of the Construction Industry is that each project can be considered to be a prototype; the number of directly comparable projects can be difficult to find. This hinders the application of cost and time KPIs within acceptable levels of accuracy (Swann and Kyng, 2004). Specifically for the time for construction KPI, measured as the change in the current normalised construction time of a project at commit to construct (point B in Figure 2) compared with one year earlier, expressed as a percentage of the one year earlier forecasted time (ONS, 2008), is an example of the Construction Industry’s KPIs to which measurements can be benchmarked. It addresses issues concerning the client and the final end project, but do not contribute to the knowledge of the individuals making decisions within the construction process; neither it contributes to the decision-making process of the project manager within project’s time.. third party audit trails to ensure validity and rigor of the KPI system in its current format. Barr (2004) estimated KPI’s highest level of accuracy that can be reliably expected is between +5% and +10%. The KPI report for the Minister for Construction states that companies can take individual KPIs and adapt them to suit needs of specific projects. This allows flexibility for the construction company to identify particular aspects and the relevant indicators, however it creates a scenario which prevents projects from benchmarking against industry standards. It is unlikely that these specifically adapted KPIs can contribute to measuring overall industry standards (KPI Working Group, 2000). In fact, Swann and Kyng (2004) argue that KPIs are rough indicators, and as such should not be considered accurate scientific tools of measurement. If this is the case, there is yet another reason to examine how performance measurement systems used within the project time can be used to achieve project objectives.. Analysis of Industry Performance Results Against Egan Targets The published KPI results from Constructing Excellence from 1999 to 2007, converted into percentage change per year and compared with the Egan targets, shown in Figure 3, for each KPI show that the UKs Construction Industry has failed to meet the targets proposed initially (Figure 4 and Figure 5), with the exception of Profitability (Figure 4). Figure 3 Egan targets (1998). Accuracy of UK national data sets The KPI framework has been criticised for its lack of transparency and accuracy (Green and May, 2003). Many companies do not audit their KPI systems (Swann and Kyng, 2004). This raises issues of whether results can be trusted, and if they are a valid reflection of the state of Construction Industry. Key aspects of performance measurement systems, such as procedure and consistency of data collection; documentation of the overall process; adequacy of result for comparison purposes; possibility of KPI aggregation for providing construction company’s indicators, require validation through the use of. 74 ]. Revista de la Construcción Volumen 8 No 1 - 2009. ]. Roberts, M. - Latorre, V.. [. páginas: 69 - 82.
(7) Figure 4 Percentage change per year of actual performance against target results for Cost, Time, Safety, Productivity and Profitability. Figure 5 Percentage change per year of actual against target performance results for Defects, Cost and Time predictability and Client Satisfaction for product and service. Both time and cost reductions have not conformed to Egan targets and show a cumulative increase since 1999. The percentage change in cost was decreasing prior to the start of measurement but rose for 4 years before falling to just above the level of 1999 in 2007. Time also shows a similar polynomial curve, staying along the same level as 1999 but with a slight rise. Safety has shown an unsteady fluctuating decrease in accidents since 1999. Its general downward trend, broken by regular increases, reflects the progress made by the industry but also the lack of predictability of safety performance. Profitability has nearly conformed to Egan’s target. Productivity, by contrast, while not considered a priority project objective by White (2007), yet provides the KPI with the next closest result to Egan’s target and is also an exponential. páginas: 69 - 82. ]. curve. The percentage change of projects scoring 8/10 or better (defects) shows a slight improvement since 1999 but the results suggests that initiatives at defect reduction are not as successful as called for by Egan. Cost predictability percentage increment shows a slight decline in recent years and its trend has not achieved the target set by Egan. The changes over 8 years have adjusted it slightly from 1999 levels. The percentage of companies scoring on cost shows an aggregate drop since 1999. Time predictability has improved slightly more than cost predictability, with 2006 to 2007 providing the best result (QS Week, 2007; White, 2007), however well below expected performance. The results from client satisfaction show we have reached a natural tailing off of client satisfaction. Roberts, M. - Latorre, V.. [. Revista de la Construcción Volumen 8 No 1 - 2009. [ 75.
(8) rates (QS Week 2007; Print, 2006). Client satisfaction for service results have improved more than results for product. The KPIs that have achieved the poorest incremental changes are cost, time, defects, cost predictability and client satisfaction for product. These have remained around the same level as first recorded in 1999 or show slight improvement. The remaining KPIs of productivity, safety, time predictability and client satisfaction with service have had low to moderate improvement annually (White 2007). Overall, it is clear that the construction Industry in Britain is not improving in line with Egan targets. In 2007, 10 of 15 indicators had declined which at the time created concerns (White, 2007). The performance measurement system is not providing the expected improvement. The slight improvement trends witnessed in the early stages of measurement are levelling off, and there are indicators which are decreasing. The literature review has presented and discussed issues which may explain the lack of performance improvement shown, but only partly. Several papers have been written on performance measurement (Neely, 1999), yet it is recognised the efforts to improve performance through the implementation of measurement systems have not met with success (Santos et al., 2002). In summary, KPIs have been analysed under different contexts. Within the Benchmarking process, KPIs are only a part of the overall system utilised. In this sense, they only serve fruitful results as long as they can inform the decision making process within project time, and therefore allow changes which will ensure meeting the performance outcome results. KPIs have been used by construction companies for marketing purposes, which has de-motivated staff and encouraged the adoption of KPIs which not serve the outcome of the project. KPIs are lagging measures, they don’t allow to deliver the project to the expected standards. The lack of measurement guidelines do not allow KPIs to compare projects which are not similar enough for results to be useful. The measurement process is not regularly audited in order to guarantee reliability and transparency.. 76 ]. Revista de la Construcción Volumen 8 No 1 - 2009. ]. Turning KPIs into leading measures will allow: - The construction team to make decisions which ensure the delivery of the project to the client’s standards. - KPIs to be a reflection of the contextual circumstances of the project, and only apply the necessary KPIs for the project. - Clearly see how the project’s goals align to the construction company’s strategy. - Increase motivation of staff, as they will feel that their work matters is meaningful to others. Although these measures generate an improvement, the following issues need to be addressed: - The system should be audited regularly - Ensure that the measurements are properly made - Compare like-for-like - P ro j e c t s a re s t i l l a i m i n g f o r 9 0 % o f t h e benchmark.. Systems dynamics and causal loop diagrams Systems Dynamics strength is its ability to model a complex and dynamic system in terms of positive (Reinforcing or R+) and negative (Balancing or B-) feedback loops in a Causal Loop Diagram (CLD). Every system, simple or complex, is made of networks of positive and negative feedbacks, dynamics arise from the loops’ interaction with one another (Sterman, 2000). Systems Dynamics have been successfully applied to supply chain re-engineering in high technology firms, management of large civil engineering projects, modelling client and project relationships, and modelling site construction processes (Ogunlana et al., 2002; Sterman, 2001). Construction litigation is an area that has advanced the use of Systems Dynamics in the construction industry, mainly in the area of delay and disruption claims (Howick and Eden, 2001; Rodrigues and Bowers, 1996; Williams et al, 1995a; Williams et al, 1995b). Other areas in which System Dynamics’ applications have shown contributions include project management (Lee et al., 2006), education (Mukherjee et al, 2005), communication (Chapman, 1998) and safety (Mitropoulos et al., 2005). CLDs are used to examine the effect of endogenous goals on the KPI measurement system by reducing. Roberts, M. - Latorre, V.. [. páginas: 69 - 82.
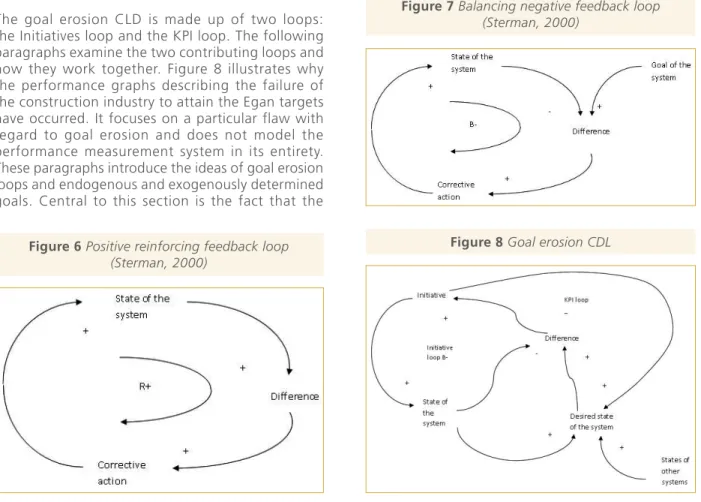
(9) it in terms of positive and negative feedback loops. The state of the system is the actual KPI result for a specific project. The desired state of the system refers to the KPI target, the objective of the system. The difference is the gap between the desired and the actual state of the system. Corrective action refers to the improvement program or initiative introduced to improve the state of the system. Positive or Reinforcing feedback loops (R+) generate growth, reinforce and increase change, and increase the difference from the starting state. They are associated with exponential and continuous growth or decay and are illustrated in Figure 6. Negative or Balancing feedback loops (B-), on the other hand, work to bring the state of the system back to a defined goal or to the initial state and are associated with balance and equilibrium, as shown in Figure 7.. desired state of the systems (the performance target) is itself a variable of the system. Sterman (2000) generally introduces the goal erosion loop for industries, however not for the Construction Industry. This is caused by a positive loop (KPI loop) acting to reduce the difference between desired and actual state of the system, not by changing the system as in the Initiative loop, but by eroding the goal. That is, the desired state of the system (Sterman, 2000). When applied to the UK’s Construction Industry, the desired state of the system is not set by an externally determined annual percentage increment as recommended by Egan. It is generated from the average annual cumulated results from industry as a whole. This means that if the industry achieved a goal below the desired goal, this new goal becomes the desired goal for the following year.. Goal erosion The goal erosion CLD is made up of two loops: the Initiatives loop and the KPI loop. The following paragraphs examine the two contributing loops and how they work together. Figure 8 illustrates why the performance graphs describing the failure of the construction industry to attain the Egan targets have occurred. It focuses on a particular flaw with regard to goal erosion and does not model the performance measurement system in its entirety. These paragraphs introduce the ideas of goal erosion loops and endogenous and exogenously determined goals. Central to this section is the fact that the. Figure 7 Balancing negative feedback loop (Sterman, 2000). Figure 8 Goal erosion CDL. Figure 6 Positive reinforcing feedback loop (Sterman, 2000). páginas: 69 - 82. ]. Roberts, M. - Latorre, V.. [. Revista de la Construcción Volumen 8 No 1 - 2009. [ 77.
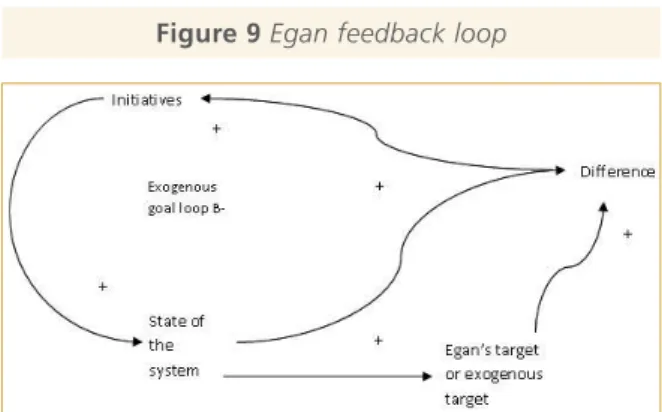
(10) In Figure 8, the Initiative loop is a balancing negative loop and shows the relationship between the state and the desired state of the system. If the difference is considerable, the rate of initiatives introduced will increase. As the state increases the difference will decrease, thereby lowering the initiatives employed. The KPI loop is a positive reinforcing loop. The desired state of the system is a function of the normalising and averaging of the many states of the systems per year, not the externally set increment as recommended by Egan. This results in the target for the next iteration to be a product of the normalising process of the previous cycle. The effect of an increasing desired state of the system is to increase the difference; an increase in difference would cause initiatives to increase thereby increasing the desired state of the system in the positive loop. A constant 10% increase, for example, would provide an exponential growth similar to those shown as target improvement in Figures 4 and 5. Conversely, a decrease in the desired state of the system and/or the difference would cause fewer initiatives to be adopted and a reduction in the desired state of the system. The reduction in the desired state will result in a lower difference value. This will reduce the rate of initiatives introduced and lower the state of the system. The lower states of the systems are aggregated to form the new lower desired state for the following iteration and thus the system continues on a decreasing spiral. Often endogenous goals appear to exogenous (Sterman, 2000). For example, a construction firm may set its goals for service, quality or time by benchmarking with competitors. This appears to be exogenous. However, when all firms benchmark against one another the goals become endogenous and determined by past performance of those firms. This can lead to goal erosion. Instead of the goal and the state of the system being a positive reinforcing loop, which would provide exponential growth, the goal is influenced by the states of the systems. This phenomenon also occurs in the positive reinforcing KPI loop for the Construction Industry.. Due to the shape of the ogive curve, a bunching up of project performance occurs in the central flatter section. Annually, these performance results are collected and produce the following year’s targets. More projects falling in the central section of the curve will accentuate the shape for the following year. However, no step changes will be achieved.. Exogenous goal loop The Egan loop in Figure 9 is an example of a balancing negative feedback loop with an externally determined explicit target in a positive loop. The desired state of the system is not a variable of the system, and is set regardless of actual historical achievement. A large difference will cause increased use of initiatives that will improve the states of the system. If the state of the system increases against the goal then the difference is reduced. This reduces, in turn, the initiatives adopted and so the state of the system will experience a decrease in results and a levelling off of performance for the relevant indicator. If the state of the system decreases, the difference becomes larger which will increase the initiatives adopted and improve the state of the system. The difference will only get smaller when the state of the systems has achieved near its target increment. This contrasts with the initiative loop as explained earlier. As the goal is externally set, it will not suffer from goal erosion. The systems should experience exponential growth with a levelling off of results as the system nears equilibrium.. Figure 9 Egan feedback loop. Because the goals are endogenous, being determined by past performance of the systems, the desired state of the system will gradually diminish as a result of goal erosion. Therefore the rate of change of the state of the system will also diminish over time. Barr (2004) observed this phenomenon in the examination of the cumulative conversion curves.. 78 ]. Revista de la Construcción Volumen 8 No 1 - 2009. ]. Roberts, M. - Latorre, V.. [. páginas: 69 - 82.
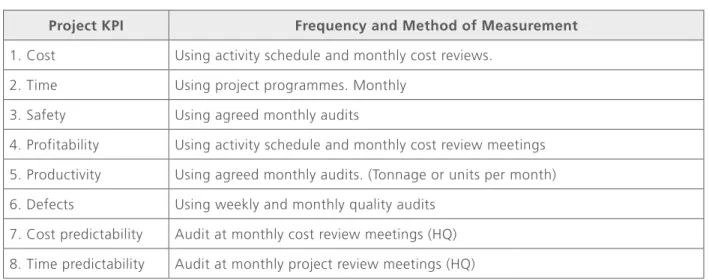
(11) Discussion There is little guidance on choosing performance indicators which are appropriate, and will lead to achievement of project objectives and the firm’s objectives. It is generally accepted that the objectives (and hence KPIs) should align with the strategic objectives of the construction firm (Kaplan and Norton, 1996). This strategic requirement, together with the evidence of the nine organisations collating KPIs within the UK’s Construction Industry, contributes to the choosing of the 10 economic KPIs and investment in staff and environmental KPIs for this research. These twelve KPI’s contribute to defining and establishing a universal set of KPIs, regardless of Construction Industry divisions that can be used within a suitable time frame for managers. With recognition of the problems experienced by Constructing Excellence demonstration projects, and how that fits with CLDs as proposed by Sterman (2001; 2000) the following 4 recommendations are made: 1. Keep it simple! Over-elaborated systems will not be suited to the contingencies of the Construction Industry. KPIs must be flexible and easy to use. 2. The purpose of the performance measurement system should be primarily to facilitate decisionmaking within the project time, by concisely reporting the status of agreed objectives against target objectives to the manager and his/her team. The performance indicators to. be measured should align with the strategic objectives of the company. 3. KPIs should be defined for a specific project within the context of the construction company, unless there is a specific need of the company which overrides the project’s goals. 4. That performance objectives and exogenous targets be jointly agreed and monitored between all parties to the contract. Third parties can be included to guarantee validity of the measurement and the results. 5. The system should be audited regularly, to ensure the transparency and reliability of results. 6. The 8 KPIs proposed in Table 1 should be measured on-site as normal, and monitored monthly against agreed targets based on historic performance on similar projects if possible. The feedback of the results within project time such that initiatives can be deployed to correct the results is critical. 7. Compare projects which share lots of similar characteristics, including contract modality. 8. Like-for-like results should be available to the public in order to encourage the different stakeholders to use the KPIs; fees discourage their use. 9. Triangulation with another performance measurement system will contribute to the accuracy of results and the decrease uncertainties regarding the results. 10. The 4 KPIs proposed in Table 2 should be measured and monitored monthly in HQ.. Table 1 List of proposed KPIs for use within project time, to be monitored on-site. Project KPI. Frequency and Method of Measurement. 1. Cost. Using activity schedule and monthly cost reviews.. 2. Time. Using project programmes. Monthly. 3. Safety. Using agreed monthly audits. 4. Profitability. Using activity schedule and monthly cost review meetings. 5. Productivity. Using agreed monthly audits. (Tonnage or units per month). 6. Defects. Using weekly and monthly quality audits. 7. Cost predictability. Audit at monthly cost review meetings (HQ). 8. Time predictability. Audit at monthly project review meetings (HQ). páginas: 69 - 82. ]. Roberts, M. - Latorre, V.. [. Revista de la Construcción Volumen 8 No 1 - 2009. [ 79.
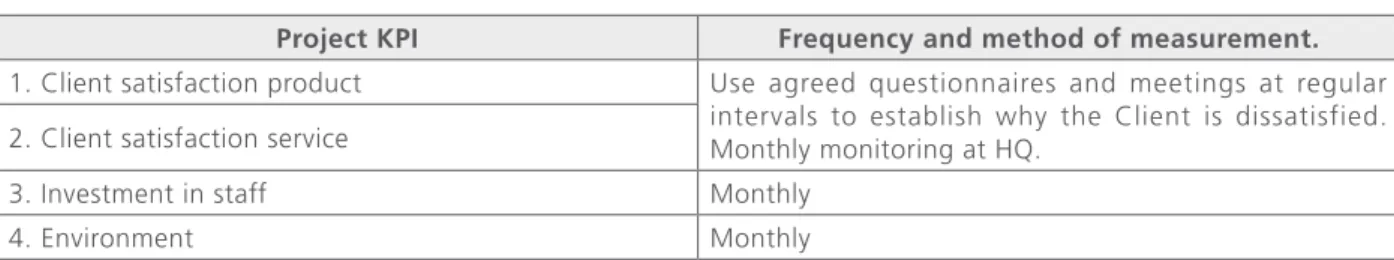
(12) Table 2 List of proposed KPIs for use within project time, to be monitored in HQ Project KPI. Frequency and method of measurement.. 1. Client satisfaction product 2. Client satisfaction service. Use agreed questionnaires and meetings at regular intervals to establish why the Client is dissatisfied. Monthly monitoring at HQ.. 3. Investment in staff. Monthly. 4. Environment. Monthly. All of the above KPIs are leading measures; they inform the decision-making process and the monitoring of the construction process. The use of these types of leading measurements contributes to Beatham et al. (2004) and Kaplan and Norton’s (1996) recommendation of aligning measurements with the project objectives. The setting of exogenous independent target performance objectives negates the effect of the goal erosion loop on performance. This allows for Egan targets to be met by the UK’s construction Industry. Performance measurement systems in other countries should follow suit in order to meet their targets and to perform at the desired level.. Conclusion This paper has presented a critical analysis of the KPI measurement system and has applied existing theory to explain the Construction Industry’s underachievement. The critical analysis has been developed in the light of relevant literature which explores the scope and effectiveness of KPIs within different contexts. The annual performance results have been illustrated against target improvements. This has demonstrated that the industry has failed to improve performance as set for in the Egan report.. 80 ]. Revista de la Construcción Volumen 8 No 1 - 2009. ]. Causal Loop Diagrams and System Dynamics have been applied to this case using historical quantitative data. This has allowed to understanding that goal erosion has caused this underperformance phenomenon, and how to better address this issue. This has the effect of reducing the targets towards which the Construction Industry strives. To counteract this, KPIs that could be measured in project time were proposed and objective targets could be individually set using similar historic performance as a guide and agreed by all parties to the contract. KPIs were chosen from research of the various KPIs that have developed since their inception and evaluated by survey. This study proposes 12 project KPIs (Tables 1 and 2) to be measured during project time along with their recommended frequency of measurement. It is also recommended that at least some of these KPIs are chosen by all parties to the project and measured in project time; results fed back to the management team, to contribute to the decision making process in a timely fashion.. Further research In order to find out how to better implement these recommendations, it is necessary to collect data from management teams and determine whether these model and suggestions suit the Construction Industry and are easy to use.. Roberts, M. - Latorre, V.. [. páginas: 69 - 82.
(13) References. 10. Green, S. & May, S. (2003). Re-engineering construction: going against the grain. Building Research and Information, 31(2), 97-106.. 1.. Audit Commission (2000). Getting Better All the Time. Making Benchmarking Work [on-line]. Available from http://www.audit-commission.gov.uk/Products/ BVIR/1EE73790-5B19-4126-A379-3EED0F82335F/ mpgettin.pdf [Accessed 11th May 2009]. 11. Howick, S. & Eden, C. (2001). The Impact of Disruption and Delay when Compressing Large Projects: Going for Incentives? Journal of the Operational Research Society, 52, 26-34.. 2.. Barr, D.W.J. (2004). The Department of Trade and Industry Key Performance Indicators: A Critical Appraisal. Unpublished PhD Thesis, University of Southampton, Southampton, UK.. 12. Kaplan, R. & Norton, D. (1996). Using the Balanced Scorecard as a Strategic Management System. Harvard Business Review [on-line]. https://wiki.brown. edu/confluence/download/attachments/33761/ Balanced+Scorecard.pdf [Accessed: 10th May 2009]. 3.. Beatham, S., Anumba, C., Thorpe, T. & Hedges, I. (2004). KPIS: A Critical Appraisal of their Use in Construction. Benchmarking: An International Journal, 11 (1), 93-117.. 13. KPI Working Group (2000). KPI report for the Minister for Construction. London, UK: HMSO.. 4.. Benchmark Index (2007) Benchmark Index [on-line]. http://www.benchmarkindex.com/bi/sb-fs.html [Accessed: 5th June 2007]. 5.. Chapman, R.J. (1998). The Role of Systems Dynamics in Understanding the Impact of Changes to Key Project Personnel on Design Production within Construction. International Journal of Project Management, 16 (4), 235-247.. 6.. CIOB (2009) Building Britain’s Future - New Industry, New Jobs [on-line]. http://www.ciob.org/news/ view/2041 [Accessed: 12th May 2009]. 7.. Department for Business Enterprise and Regulatory Reform (BERR) (2009) What are the UK Construction Industry Key Performance Indicators? [on-line]. http:// www.berr.gov.uk/whatwedo/sectors/construction/ ConstructionStatistics/KPIs/page16440.html [Accessed: 12th May 2009]. 8.. Department of Trade and Industry (DTI) (2006). Construction Statistics Annual Report 2006 [on-line] http://www.berr.gov.uk/files/file34487.pdf [Accessed: 12th May 2009]. 9.. Egan, J. Sir (1998). Rethinking Construction: The Report of the Construction Task Force to the Deputy Prime Minister, John Prescott, on the Scope for Improving the Quality and Efficiency of UK Construction. London, UK: DETR The Stationery Office Agencies.. páginas: 69 - 82. ]. 14. KPIzone (2009). KPIzone Community [on-line]. http:// www.kpizone.com/community [Accessed: 12th May 2009] 15. Langford, D. & Murray, M. (Eds.) (2003). Construction Reports 1944-1998. UK: Blackwell Publishing. 16. Latham, Sir M. (1994). Constructing the Team: Joint review of Procurement and Contractual Arrangements in the United Kingdom Construction Industry: Final Report. London, UK: HMSO. 17. Lee, S., Peña-Mora, F. & Park, M. (2006). Webenabled system dynamics model for error and change management on concurrent design and construction projects. Journal of Computing in Civil Engineering, 20 (4), 290-300. 18. McClements, S., Blumenthal, A. & Heaney, G. (2002). Measuring Construction Performance [on-line]. http:// www.engj.ulst.ac.uk/RCCNI/reports/kpi_report2.pdf [Accessed: 4th April 2009] 19. Mitropoulos, P., Abdelhamid, T.S. & Howell, G.A. (2005). Systems Model of Construction Accident Causation. Journal of Construction Engineering and Management, 131 (7), 816-825. 20. Mukherjee, A., Rojas, E.M. & Winn, W.D. (2005). Understanding Cognitive and Meta-cognitive Processes in Construction Management: The System Dynamics Perspective. In Construction Research Congress Proceedings 2005: Broadening Perspectives [on-line]. Roberts, M. - Latorre, V.. [. Revista de la Construcción Volumen 8 No 1 - 2009. [ 81.
(14) http://www.cee.mtu.edu/~amukherj/papers/407547459.pdf [Accessed: 10th May 2009] 21. Neely, A. (1999). The Performance Measurement Revolution: Why Now and What Next? International Journal of Operations and Production Management, 19 (2), 205-228. 22. Ogunlana, S.O., Ki, H. & Sukhera, F.A. (2002). Systems Dynamics Approach to Exploring Performance Enhancement in a Construction Organisation. Journal of Construction Engineering and Management, 129 (5), 528-536. 23. Office of Government Commerce (OGC) (2009) Benchmarking [on-line]. http://www.ogc.gov.uk/ documentation_and_templates_benchmarking.asp [Accessed 12th May 2009] 24. Office for National Statistics (ONS) (2008) Construction Statistics Annual 2008 [on-line]. http://www.statistics. gov.uk/downloads/theme_commerce/CSA_2008_ final.pdf [Accessed 11th May 2009] 25. Office for National Statistics (ONS) (2009) Output in the Construction Industry. First release. [on-line]. http://www.statistics.gov.uk/pdfdir/oec0309.pdf [Accessed 11th May 2009] 26. Print, M. (2006). RICS Project Management Three Sixty [on-line]. http://www.rics.org/NR/rdonlyres/ 4301AB8B-C062-4B97-B39E-E54E0849836D/0/ KPIsandBenchmarking.pdf [Accessed 11th June 2007] 27. Public Sector Benchmarking Service (2006) [on-line]. Available from www.benchmarking.co.uk [Accessed 11th November 2007] 28. QS Week (2007). Cost Prediction Improves – Client Survey [on-line]. http://www.qsweek.com/ nav?page+qsweek.gen_obj_redirects.news&fixture_ news=6 [Accessed 13th June 2007]. 82 ]. Revista de la Construcción Volumen 8 No 1 - 2009. ]. 29. Rodrigues, A. & Bowers, J. (1996). System dynamics in project management: a comparative analysis with traditional methods. Systems Dynamics Review, 12, 121-139. 30. Santos, S., Belton, V. & Howick, S. (2002). Adding Value to Performance Measurement by Using System Dynamics and Multi-criteria Analysis. International Journal of operations and Production Management, 22 (11), 1246-1272. 31. Sterman, J.D. (2000) Business Dynamics: Systems Thinking and Modelling for a Complex World. New York, NY, USA: Irwin/McGraw-Hill. 32. Sterman, J.D. (2001). System Dynamics Modelling: Tools for learning in a Complex World. California Management Review, 43 (4). 33. Strategic Forum (2002). Accelerating Change: A Report by The Strategic Forum for Construction. Chaired by Sir John Egan. London: Rethinking Construction 34. Swann, W. & Kyng, E. (2004). An Introduction to Key Performance Indicators [on-line]. http://www.ccinw. com/sites/research_pages.html?site_id=15§ion_ id=91&page_id=397 [Accessed 11th June 2007] 35. White, B. (2007) UK Construction Industry KPI Launch 2007 [on-line]. http://www.constructingexcellence. org.uk/pdf/kpizone/KPI_Launch_Presentations_1306-2007.pdf [Accessed 11th May 2009] 36. Williams, T., Eden, C., Ackerman, F. & Tait, A (1995a). Effects of Design Changes and Delays on Project Costs. Journal of the Operational Research Society, 46 (7), 809-818. 37. Williams, T., Eden, C., Ackerman, F. & Tait, A (1995b). Vicious Circles of Parallelism. International Journal of Project Management, 13 (3), 151-155.. Roberts, M. - Latorre, V.. [. páginas: 69 - 82.
(15)
Figure

+4
Documento similar