Infographics, a study tool by FGUM english students in Facultad de Contaduría Pública at Benemérita Universidad Autónoma de Puebla
98
0
0
Texto completo
(2) BENEMÉRITA UNIVERSIDAD AUTÓNOMA DE PUEBLA. FACULTAD DE LENGUAS. Infographics, a study tool by FGUM English students in Facultad de Contaduria Pública at Benemérita Universidad Autónoma de Puebla.. A thesis submitted to the Faculty of Languages for the degree of:. Licenciatura en Enseñanza del Inglés. By José Hugo Zenteno Luna.
(3)
(4) DEDICATION To God, who has showed me the path to find hope in everything I have tried to do in my life. Also, to my Mother and Father who have always been exemplary human beings. This work portrays all my devotion and love to you. Thanks for being the reason to continue believing in pure love. Being your son has been a sweet stroke of luck which has made me understand how big parents’ dedication is. Thank you so much for letting me chose a path in this world by my own. To my dear Cerbero, my dog and my “CORAZONCITO”. It is inevitable not to think of you while I write this, my sweet heart. I also want to dedicate this to you since you were always there taking care of me; above all, in the toughest days of my life. This paper would not have been possible without your light. Thanks to your limitless love, which still makes me smile since you taught me that real care remains despite of absence. Thanks for showing me that it is always my responsibility to stand up. Your tenderness and legacy will be part of my life. Hope to see you on the other side one day. In the immensity of universe and time it has been a miracle to share this life with you.
(5) ACKNOWLEDGMENTS Firstly, this work would not have been possible without my Thesis Director, Concepción Gutiérrez Aguilar; who supported, encouraged and motivated me during this time in order to end this paper. I want to express my gratitude since she always trusted in me, which makes me feel engaged with this idea. Secondly, I am so grateful with the Committee Members whose guidance has been so significant for this work. Every comment on this paper was so summative and worthy since this action contributed enormously. Thirdly, no one is more important than my parents and siblings, so it is evident I feel so grateful for being part of them. I would like to thank my father since he always let me chose my path freely. Today, I understand how lovely and emphatic you were by simply observing and enjoying how free we were growing. To my mom, the only thing I can express in this moment is thankfulness and happiness since you are the responsible of this moment..
(6) TABLE OF CONTENTS Chapter 1: Introduction 1.1 1.1.2 1.1.3 1.2 1.2.1 1.3 1.4 1.5. Introduction to the problem English as a not complementary subject Infographics adapted and used as study tools Research purpose Research questions Significance of the topic Rationale for topic selection The context of research. Chapter 2: Literature Review 2. 1 2.2 2.2.1 2.2.2 2.3 2.4 2.5 2.5.1 2.5.2 2.5.3. Introduction Theories about how human being processes information mentally: Cognitive impact within education The impact of cognitive development skills in education The cognitive influence on thinking, problem-solving, and learning Conceptual contributions to cognitive theory: The role of individuals interactions to create knowledge XXI century students’ skills needed to solve problems The impact of Visual aids used as a cognitive tool in study Infographics: Origins Infographics as a study tool Elaboration of Infographics as study tools. Chapter 3: Methodology 3.1 3.2 3.3 3.4 3.5 3.5.1 3.5.2 3.5.3. Introduction Research Context Participants Research Design Procedure Application of the instrument (Pilot) Modifications to the instrument after the pilot Activities: Introducing the use of infographics for study purposes. Chapter 4: Findings 4.1 4.2 4.3. Introduction General information of participants First section of the instrument: Participants’ feedback in relation to the impact of English study.
(7) 4.3.1 Second Section of the instrument: Students’ opinions about the importance of English and use of technology to study it 4.3.2 Third section of the instrument: Participants’ views about using infographics as English study tools Chapter 5: Conclusions 5.1 Conclusions 5.2 Implications 5.3 Limitations of the study 5.4 Suggestions for further research. Appendix References Instrument (Pilot) Instrument (final version) Students’ infographics (samples).
(8) CHAPTER 1 1.1 Introduction to the problem Normally, students may struggle academically when encountering activities that involve management of information, homework, research projects, difficult or unattractive readings in and out of school which might lead learners to adopt certain averseness towards scholar activities which may be apparently result of taking for granted the benefits of education given in school. In this case, Delval (2013) remarks the importance of considering the students’ interests when teaching them in order to stimulate curiosity and need of learning. According to Delval (2013) learners feel unmotivated by having lessons whose content resembles useless for daily life, which only provokes absence of pupils’ attention during their scholar activities. The result of learning unwillingness might naturally affect learners due to the context in which they are immersed. For instance, undergraduate students are currently asked not only an acceptable academic training; moreover, it is also well-rewarded that individuals be able to generate creative ideas, solutions, proposals, among others; whose consequences might represent constructive benefits afterwards by being materialized in constructive results. Naturally, the apprentices that do not fulfill to be creative-problem solvers into an era ruled by competence, might be part of a large number of people that cannot adapt themselves to continuous changes in diverse areas, in this case, the educative one. In order to describe this current phenomenon, Tourón (2015) compared the traditional student’s behavior versus the XXI century student whose results are briefly portrayed hereunder.. 1.
(9) Traditional student. XXI century student. A student only sits and listens. A student moves and experiments. A teacher only utters things. A student builds “meanings”. Paper and pencil are the mediums. Enriched by multimedia technology. No changing. Changing is constant. Submissive student. Problem-solver student. Isolated and private learning. Learning is global, shared, and collaborative. Results are expected. Graphics are designed immediately Fig 1. What are the XXI student characteristics? Source: UNIR (La Universidad en Internet).. The chart above comprises some of the most highlighting characteristics on how a student must behave today according to Tourón (2015). In fact, it is noticeable how apprentices are presumably expected to perform an active student role, by manipulating the resources provided by the surrounding contextual circumstances, which apparently might trigger aspects as learning autonomously, modification of input, collaborative learning, adaptation and manipulation of technology, among others. In addition to this, Delval (2013) asserted the XXI century continues producing several social and technological contributions although it seems not to modify completely schools yet. Consequently, it is essential to explore and adapt more innovative paths that may serve as guidance to better prepare individuals regarding all those tools provided by our current context. Actually, these kinds of tools can be used and improved by learners as result of interacting with them. Hence, to use them as tools might contribute with more competitive and prepared individuals capable to maximize their talents to generate self-constructive solutions. To sum up, a pupil is not an individual that attends to lessons daily just sitting on a chair listening to another person explaining terms; which seems only to promote repetitive and monotonous teaching activities. So, it is essential to adapt more new resources to arise interest. 2.
(10) for study in learners “We have to plan how it should be the educative institutions to prepare students for living under shifting conditions that move more frequently every single day. Therefore, we should reflect on how education must be for the XXI century” (Delval, 2013). 1.1.2 English as a not complementary subject Inasmuch as civilizations continue evolving, it is inexorable to recognize this will comprise different areas of human being in order to simplify life. Over the time, it is palpable that evolution inexorably permeates every knowledge human branch which resembles a particular feature of mankind, whose value attempts to enrich society itself. According to Delors (1994, 1996), education may contribute positively individuals by being regarded as a tool capable of supporting society with peace, freedom, and social equality. Basically, scholar content and activities endeavors to impact students’ lives by awakening different skills and talents that may shape his or her personality positively. Every subject attempts to provide students with different skills which can lead to solve daily defies in and out of school; consequently, it is vital individuals become responsible to make decisions that can contribute to improve the educative field. For example, Math is might be considered as an essential part of student’s training as a result of its direct use within life. This situation is frequently witnessed in actions as getting cinema tickets, paying an order at a restaurant, calculate how much has to be paid before going to a market, among others. Other subject, whose impact, has to be represented in more analytic individuals capable to understand why social movements take place is History. According to Prats (2017), teaching this subject represents a high formative content since it allows future members of the society to better understand the different social phenomena, nor through the identification of causes but by comparing these actions with past ones; which seems advantageous for apprentices due to it. 3.
(11) portrays a contextualization of two realities, whose variance is mainly temporal as well as spatial. English, as subject has to be part of a scholar curriculum due to its presence and impact in the world; as a matter of a fact, it has become considered as one of the most educative essential branches towards a more integral education today. Undoubtedly, this language as a lingua franca displays a vast landscape of formative opportunities for apprentices thanks to the different social and technological contributions, which are frequently showed around the world by English. In fact, Calderon (2015) cites Calvet & Calvet (2010), mentioning that English occupies the first position among 137 stable tongues, which remarks its prevalence upon other languages; also considered lingua franca, French and Spanish. In addition to this, Calderon (2015) stresses that the study of English as a foreign language has evolved, becoming considered as second language nor a foreign one, which is the product of an emerging multilingualism. Currently, the continuous interchange of information may impact and encompass different areas of knowledge, stressing the study of English as requirement rather than luxury. By being part of a world in which this language is considered as one of the most common mediums to spread information concerning to diverse fields, it is mandatory to adopt it as a natural mean to sharpen different skills what may allow being an active learner nowadays. According to Calderon (2015) most of Mexican students have right to achieve the highest merits in education, as much as it can be possible; which may be possible by English as an outcome of its clear relation with different social and technological aspects, so not to provide students the dominance of English has to be considered as educational malpractice. Inopportunely, English teaching in countries as Mexico does exhibit an underprivileged environment; whose scanty positive results, only have made evident the faintness of this topic in. 4.
(12) the nation. As an illustration of this, in 2014 a study performed by Education First revealed that Mexico occupied the position 39 out of 63 countries. According to Education First (2014), it is startling the shortage of English training in the Mexican territory; which clearly restrict learners from the close commercial relation that does exist with U.SA. As a result, Moreno (2017) by means of Nuño (2017) underlined the importance of strengthening English teaching in Mexican educative institutions to aim a public educational system that addresses to become a bilingual or trilingual organization. In conclusion, the primary weight of English convokes to reinforce its importance as a transverse axis, whose multiplying effect into classroom, can contribute to better educate individuals by displaying a real rapprochement of society. In addition to this, Alviárez and Castellanos (2013) by means of Odreman (2012) claims Transversal axes represent the fundamental components of curriculum, considering teaching and learning process may be contextualized logically; allowing to understanding real situations in society, needs, socio economic problems, among others. 1.1.3 Infographics adapted and used as study tools To be a school teacher necessarily involves considering different options, among them to create materials, to engage students during lessons, which naturally may lead to adapting uncommon resources to make contents more attractive for scholar activities developed during lessons. As a consequence of this, teachers may struggle by facing this action, but at the same time, educators apparently benefit from this action by acquiring experience and practice when being immersed in the creation of tools. As illustration of this, Nuñez & Téllez (2009) by means of Goethe (n.d.) claimed that knowing is not enough if there is no application. In fact, Esptein &. 5.
(13) Ormiston (2007) remark how the development of materials by the teacher is amends to reinforce the scarcity of teaching context, program goals, and student’s needs. In order to illustrate how adaptation of materials has been vital for pedagogical purposes, Schilling (2011) described how Dr. Maria Montessori (1906) started demonstrating that individuals, despite of their limitations, are capable to learn by themselves when having mediums to do it. Actually, Montessori not only created a school or a method but she also demonstrated that individuals, even those considered “unskilled”, are able to reach knowledge. According to Schilling (2011) Dr. Montessori (1906) noticed how students, after using materials designed and provided by Montessori, began redesigning adapting them to personal needs. In addition to this, Velasco (2011) stated using as reference “Montessori Method” that teachers necessarily have to let students express their interests, even as apprentices make mistakes, which may construct a more dynamic and active learning process. As it has been described the use of different resources to teach resembles a teacher’s necessary activity. Hence, to use infographics into the classroom might be considered a summative option for educative purposes due to its natural purpose of conveying information engaging the student to grasp the message meaningfully. In order to explain this point, Albar (2011) cites Mc Candless (2010) “the information visualized is a form of understanding knowledge”. According to Albar (2011) infographics allow manipulating vast information easily by synthesizing the content in attractive visual presentations; which provide users to decode the message more effectively and attractively. Apparently, an infographic finds its value to trigger meaningful learning by allowing pupils connecting the relation among different concepts just as the conceptual map when creating meaning. In order to explain this, Aguilar (2006) states the employment of conceptual maps. 6.
(14) stimulates positively in individuals the capacity on learning thanks to activities, whose impact finds validation on a system enriched by propositional concepts. Aguilar (2016) explains how visual representations connect ideas as a consequence of being based on a hierarchical structure of concepts, in which the most important endows meaning to the rest of ideas. In fact, Aguilar (2006) stresses that education certainly needs to rise students capable of acquiring concepts gradually from preschooler levels until more specialized stages. In addition to this, Aguilar (2006) describes that systems based on management of concepts provide students different advantages as learning, teaching, cognitive evaluation, among others. However, Albar (2017) by means of Gutierrez suggest that the use of infographics convokes to fun approach supported by activities that involve games in order to support the utilization of this tool. In addition to this, Albar (2017) suggests the use of this infographics should be used practically to strength communicative aspects. 1.2 Research purpose The main purpose of this paper is to explore how students react to usage of infographics; which would permit to know whether this resource may be considered by participants of this research as an English study tool. 1.2.1 Research questions This study aims to answer the following research questions: 1. Would infographics be accepted by FGUM students as an English study tools? If so, why? 2. Would the participants of this research elaborate infographics to study English? If so, why? 3. Would it be necessary to introduce the use of infographics into an English course for English study? If so why?. 7.
(15) 1.3 Significance of the topic It would be summative and necessary to create an atmosphere that lead participants to manipulate didactic materials in order to engage them to a specific context to arise curiosity, analysis and manipulation of information in order to foster more XXI century students. In fact, Snow and Jackson (1994) suggest that this relationship is expressed in cognitive, emotional, and value terms. Apparently, one technique to strengthen motivation in students is to waking up curiosity and exploratory behavior feeling that might engage them in order to experiment with new didactic materials; in this case, a different alternative in comparison to those that are frequently used into a classroom as conceptual maps, brainstorming, summaries, etc. Probably, this would enhance student be less reluctant to activities frequently used into the classroom. The purpose of this paper is to explore if participants reacts positively to use infographics as an English study tool, whose use is not very conventional among learners. In consequence, this action will allow knowing how suitable may be to work with this resource for English study purposes. 1.4 Rationale for topic selection As far as I am concerned as a student, I have experienced several issues at the moment of organizing information in order to prepare scholarly activities. Besides, to understand what I learn during lessons seems difficult which affects to construct knowledge according to the content presented in classes as a result of not knowing how to manage information in order to use it appropriately. For instance, monotonous activities as summaries, isolated notes, and memorization of concepts or even definitions are apparently daily students’ practices which might be aggrandized using other type or didactical materials. Consequently, it would summative to aggrandize the list of study alternatives even if they were not initially elaborated for educative. 8.
(16) purposes. In fact, this might result in more alternative resources which might be summative paths for learners. The decision of selecting this topic is to let students know how productive is to adapt different tools, despite of not being part of the casual catalogue of activities in the classes, which might allow students to consider other options to benefit themselves. As it was mentioned, the infographics may offer the possibility of connecting concepts when combining text and images meaningfully, which also allow training more skillful learners. In addition, the chance of experimenting as a student designing own materials may foster self-study activities. 1.5 The context of research Infographics, adapted as study tools, represent a subject that has been recently explored. Consequently, it is substantial to continue exploring other researchers which establish significant references for this paper. Firstly, “Infografía 2.0 Visualización interactiva de información en prensa” is a publication that provides data related to origins, use, and impact of infographics. Basically, Cairo (2008) underlines how efficient infographics are to make understandable written information by translating it into visual representations, which underlines the importance of this resource to convey meaning. As a matter of a fact, (Cairo, 2008), states infographics are used normally to facilitate more easily comprehension of events, actions, among others. In another Cairo’s’ study “Visualización y conocimiento. Una breve invitación a la infografía” (2009), the author depicts that individuals can become active users when decoding visual representations. Consequently, individuals may abandon passive roles when reconstructing the information acquired initially to make sense of it.. 9.
(17) At University of Palermo, Argentina (2007) was developed a research, Reinhardt (2007), who attempted to propose a definition for Infographics as didactics tool. This research highlights how contemporaneous culture convokes to innovations and adaptation of materials nowadays. In this research is mentioned how children; in this case, may be stimulated cognitively as well as it is considered that use of this resource as favorable for meaningful learning. According to Reinhardt (2007), infographics as didactical concept might find its validation as a result of being closely linked to cognitive scheme theories, among others. As an illustration of this, Reinhardt (2007) by means of Laird (1996), depicts how mental models are a representational construct that explain how people reason and make inferences to understand the world. To sum up, the contexts where have been developed investigations in relation to this topic present papers that illustrate how this tool can be regarded for educative practices; enhancing to consider the usage of infographics as study tools.. 10.
(18) CHAPTER 2: LITERATURE REVIEW 2. 1 Introduction It seems that human beings firstly perceive the world through the senses instead of having lessons about it. For example, a small kid could not know what an apple is without listening someone using this word when referring to this small multicolor rounded fruit. Naturally, ears permit to name what will be tentatively reinforced gradually. Then, hands will allow knowing how an apple feels while noise sense will progressively be acquainted this typical odour. Finally, eyes will recognize and name this fruit shaping into this individual a concept, which will be validated by other individuals. The result of how individuals build knowledge by interacting with the world is described by Aristotle (n.d.) by means of Meaurio (2009) who also claims that reality is reached when the senses categorize what they interact with; which allows individuals knowing regarding their own experiences. This chapter basically depicts how infographics; being used as an English study tool, may foster in individuals the capacity of managing information actively as well as stimulating metacognitive abilities by using it. Consequently, it is required to illustrate briefly how visual aids may be adapted as a meaningful ally for teaching-learning purposes. In a concise manner, to use infographics as study resources may increase students’ alternatives; in this case, visual representations tentatively represent advantageous means to perform activities as English study since images are able to convey information. Actually, Gamonal (2013) explains that infographics is not just the creation of simple graphics. In addition to this, Gamonal (2013) underlines how these types of visual representations allow explaining complex content easily as an effect of synthesizing and transforming data in visual codes.. 11.
(19) 2.2 Theories about how human being processes information mentally: Cognitive impact within education Humans are apparently destined to learn continuously based on experiences that structure meaningful concepts gradually. The source of such interactions may be common daily activities as choosing a movie, deciding next holidays, solving mathematical operations, among others. Consequently, these events convoke individuals able to analyzing carefully decisions and consequences, which are propitious to be benefited from these common routines; or in other circumstances, these choices are determinant to make important decisions as choosing a good accountant, analyzing the possibility to get a new job, getting a new house, among others. Regarding specially the scholar field; “Education involves not only learning new information but also problem solving” (Ashman & Conway, 1997: 76). Theories, that attempt to illustrate how humans develop thinking, may embody paths that educators can consider in order to be guided during teaching processes. According to Arancibia, Herrera, and Strasser (2008), from 70’s started a transition that involved the movement to a cognitive approach whose predecessor was behaviorism. “The emphasis shifted from behavior to the structure of knowledge and mental processes that can be inferred from behavioral indices. In other words, the cognitive theories attempt to explain the processes of thinking and the mental activities that mediate the relation between stimulus and reaction” (Arancibia, Herrera &Strasser, 2008). It can be said cognitive psychology by means of Arancibia, Herrera &Strasser (2008) that this movement studies processes as perception, memory, language, reasoning and problem solving activities. Consequently, this theory nowadays is very important for education since it highlights the impact that learners’ active role represent since the individual can be consider the main responsible of learning, regarding concepts as the importance of previous learning,. 12.
(20) meaningful learning, stimulation of cognitive and metacognitive strategies. “Learners bring to classrooms and assignments their experience and expectations. They try to make sense of what the teacher or textbook says and to integrate the subject matter into some meaningful structure” (MacKeachie, 1980). According to Ashman & Conway (1997: 41), “cognition refers to knowing and thinking. Hence, it involves taking in, storing, retrieving, transforming, and manipulating information that is obtained through senses. It also involves perception, awareness, judgments, the understanding of emotions, and of course, memory and learning”. The cognitive theory is opposed to the behaviorism theory. It is stated that: The behaviors, then and now, had and have in common the conviction that a science of psychology must be based upon a study of that which is overtly observable; physical stimuli, the muscular movements and glandular secretions which they arouse, and the environmental products that ensue (Hilgard & Bower, 1975, p 90). Concisely, it is fundamental to recognize how cognitive movement may impact the educative practices approaching the individual as the main responsible of their learning. By being conscious as educators about the contributions of this type of studies, it may be possible to find more variables engaging and benefiting students in order to involve them in meaningful scholar actions. 2.2.1 The impact of cognitive development skills in students To know about how individuals process information cognitively may benefit teaching practices although to understand holistically the concepts that build this theory may not be as simple as it seems. However, to possess at least notions can contribute to understand gradually. 13.
(21) the significance of such studies to foster practices as teachers, which might modify how teaching practices are performed into classrooms. The influence of cognition in people tentatively makes their life different to other creatures due to the ability of connecting external stimuli; benefiting eventually self-human race to satisfy even basic needs by developing the ability of making decisions, which evidences cognitive skills are significant in actions performed by people. Hence, the manipulation of concepts appropriately may endow persons the ability of decoding information, which become new concepts, whose result allow constructing a semantic network that provide meanings by having as reference previous subsumers. “We can have the concept food that we relate with fruit and vegetable. At the same time, we relate fruit with apple, lemon and strawberry. The concept strawberry is connected with red and sweet” (Mondragón, 2018). Currently, learning might be seen as an active process which basically depends on the facilitation of situations in order to train more dynamic and learners, aggrandizing their cognitive faculties consequently in order to learn meaningfully. Nevertheless, Rodriguez Palmero et al., (2010) addresses the weight of knowing about the background in students’ cognitive structure in order to identify the presence; by contrast, the absence of anchor ideas that may be support or not the understanding of new concepts. Actually, Rodriguez et al., (2010) denotes that educators’ role also encompass to identify the scarcity of subsumers in students in order to manipulate their cognitive structure to guarantee subsequent learning; which may provide students with the necessary skills to achieve different activities eventually. 2.2.2 Cognitive influence on thinking, problem-solving, and learning Necessarily, education nowadays convokes individuals able to cope with situations in which is necessary to possess mental abilities to make accurate decisions, which may perform a. 14.
(22) fundamental role to find appropriate answers when confronting difficulties. During the process of choosing a solution for the up-and-coming situations, it might be necessary to select the most proper strategy in order to achieve a goal which invariably leads to improve or solve an issue. At this stage, it seems unavoidable being an individual that knows how to dissect consciously these conflicts. In consequence to this, education represents a fundamental element to train students cognitively; who are gradually trained cognitively to arousing metacognitive abilities subsequently. According to LINCS (n.d.) the development of cognitive skills allows studying, thinking, and learning in activities as solving a mathematical problem, understanding a reading, among others. Certainly, the cognitive movement seems to have impacted progressively teaching practices, suggesting that students need to be exposed to significant sceneries in order to become active participants of the teaching-learning process. With regard to cognition in education, Porter (2014) explains that connections are made to student’s lives which gives an opportunity to apply skills in activities as measurement. “Bloom identified the level of application in the cognitive domain of learning as more effective level of learning because students are able to make connections to new gained knowledge (Porter, 2014)”. Memorization is another aspect that may be revaluated by the cognitive current when understanding its contribution to apprentices’ learning process. In order to illustrate this view, Porter (2014) explains that currently teachers tend to undervalue the constructive effect of memorization; as a result of, basing the tasks primarily on teaching conceptual understanding; creating a void in students’ capacity to learn and retain information. According to Porter (2014) by means of Garii (2002) the symbiotic work between memorization and conceptualization enhance that the learned material becomes a usable and internally explainable concept. Porter. 15.
(23) (2014) explains by means of Wang (2009, Abstract) “Memorization is a key cognitive process of the brain because almost all human intelligence is functioning based on it”. As it can be see, actions as thinking, problem solving, and learning arouse in individuals the capacity of retrieving previous information to find appropriate solutions. Hence, the necessity to expose students to contexts where they can perform the principal role in the process of learning. Porter (2014) asserts by means of Miller et al, (2001) the importance of tasks in order to facilitate approaches of reasoning which may clarify the students why to memorize is not to understand, recognizing also this feature as a cognitive skill without discrediting its importance, but implementing activities that engage students in activities that foster mental activities mainly. 2.3 Conceptual contributions to cognitive theory: The role of individuals’ interaction to create knowledge Cognitive theory seems to be enriched continuously, resulting in several concepts that attempt to explain how human being process external stimuli resulting apparently in determinant ideas that depict how human being processes information in order to develop knowledge. Lupon et al (2012)., by means of Neisser (1967) defines cognition as “the capacity to process information, which is regarded from the perception and experience, but also of the interferences, motivation, expectations; which also convokes other processes as attention, memory, learning, etc.” Evidently, to describe in detail the cognitive theory can be arduous; as well as, it is not concerning to the main purpose of this paper. Therefore, it is concisely explained vital notions to understand how human cognition benefits of interacting with the environment. For instance, Ashman & Conway (1997) highlights how Vygotsky contributed enriched the cognitive current regarding psychological and educational aspects, stressing that meaning is constructed as a result. 16.
(24) of the interaction among individuals; some of them more knowledgeable in comparison to others resulting in mental modifications. Mediation and internalization are significant for individuals’ cognitive development resulting in abilities that allow understanding and solving challenges. Basically, “mediation refers to the need for someone others than the learner to translate knowledge about the society and the culture so that it can be internalized by the learner.” While, internalization is regarded to “the individual’s ‘ownership’ of concepts or meaning that has been provided by instruction” (Ashman & Conway, 1997: 96). In addition to this, Essays, UK (2013) by means of Lightbown & Spada, 2006) states “The symbolic mediation refers the external process via symbolic signs or tools in social context through which learner can control process after internalization”. Essays, UK (2013) cites Lantolf (2000), stressing the vital role that language performs acting as a medium among individuals that share information to solve determined tasks. The Zones of Proximal Development (ZPD) clearly illustrates how children develop abilities as a result of the interactions they live, whose effect arouse in young infants the competence of solving problems. Essentially, the ZPD depicts how children encounter tasks that can be performed by themselves; nevertheless, in other occasions the actions to solve these assignments require the guidance of more knowledgeable children or even adults. Hence, the more skilled individuals enhance the unskilled ones to solve issues, using language as a medium to share answers. Consequently, assessment tools and remediation programs have been benefited by this notion. “ZPD links assessment and remediation can be seen in operation in a number of teachinglearning approaches that aim to develop students’ independent thinking and problem solving skills” (Ashman & Conway, 1997: 97).. 17.
(25) Scaffolding is a concept also related to how individual share information in order to become more skillful which reinforces ZPD influence. For instance, teachers and students tentatively represent how this process occurs due to the less skillful individuals need guidance during classroom activities. Once pupils raise the necessary skills that allow the solution of activities; that primarily were difficult to perform, it is necessary to reduce the help gradually. In fact, Magno (2010) cites Balaban (1995) to explain that “scaffolding refers to the way the adult guides the child’s learning via focused questions and positive interactions. Tentatively, scaffolding effect could not be facilitated without the influence of “language” whose expansive function may allow mediating and internalizing concepts. Presumably, construction and understanding of new concepts can be possible thanks to interactions that individuals live continuously; which allows persons coping with different interchange and assimilation of ideas regarding external stimulus, whose effect is sustainable at a cognitive level. In consequence, these activities might develop gradually tools that act as facilitators, representing a meaningful study model that regards education as an active interaction. Hence, the vital role that individuals’ perform to find suitable tools that can serve as alternative to recreate mental connections to develop student’s cognitive skills. 2.4 XXI century students’ skills needed to solve problems It seems that evolution in society not only modifies the tools, environments, technology, among others., actually, it is noticeable how generations are different depending on the context where there are raised. For example, generations as Baby boomers and Generation X present specific characteristics by which are different: individualistic, experimental, social-cause orientated, reactive, realistic, creative, among others. Clearly the modern society, composed by Millennials (born 1980-2000), convokes to renovate progressively approaches, theories, etc., in. 18.
(26) this case education practices, to adjust content and activities to specific needs belonging to individuals nowadays. Today’s school practices underline aspects as group orientated, global, risk taking, among others., whose path apparently lead subjects to creating solutions instead of accepting results. According to Driscoll (n.d.), 20th century education underestimated creativity as a result of being based on compliance and conformity. In addition to this, Driscoll (2018) stresses that students continue being taught as standardized curriculum that consequently provokes students feel unmotivated to learn. Certainly, XXI century education needs to evolve as a consequence of innovative advances in society which inevitably convoke to train differently the individuals in order to raise skills for future activities that will gradually appear as challenges for students. In order to illustrate this situation, The World Economic Forum (2016) enlists competences that learners can practice to approach incoming defies: critical thinking- problem solving, creativity, communication, and collaboration. In fact, Torres (2016) by means of the WORLD ECONOMIC FORUM (2016) remarks that 65% of children, that currently course basic education, will have to be enrolled in professions that do not even exist which will request creativity, initiative, and adaptability. The role of problem solvers individuals seems to be determinant in several fields where human being develop activities. For this reason, it is necessary to create sceneries that trigger certain abilities in problem learner solvers. Regarding this situation, Ashman & Conway (1997) address by means of Bransford, et al., (1986) a simple problem solving sequence in the form of a mnemonic IDEAL (Identify, Define, Explore, Act, Look) which is described as it follows: a) Identify: This is the first step of recognizing an existing problem; which is related to the root of the situation.. 19.
(27) b) Define: As soon as the problem has been identified, problem-solvers must analyze carefully the situation in order to find a suitable strategy. c) Explore: At this stage, the individual (student) looks for suitable information to increase its understanding about the problem. d) Act and look: Once the individual has gone through the previous stages. It is necessary the usage of the resources collected, and at the same time, it is significant to watch the progress of the situation. The counterpart of problem solver students, “low ability students” present problems at the moment of following this sequence in order to develop certain activities. Actually, Ashman &Conway (1997, p 80) through Byrnes & Spitz (1977) reported that: Low ability students tended to repeat their errors when able to complete the problem. They reported that the youngest children in their study committed many violations following the wrong initial moves. Instead of profiting from their mistakes, and in spite of the need to obey the rules to succeed, they repeatedly made errors and rule violations. (p 80) Certainly, education practices can benefit individuals to foster and reinforce skills in leaners throughout problem-solution situations based real on issues, which may contribute positively apprentices’ learning. With these actions it may be possible to arouse skills in individuals to solve current needs in society. In fact, Weil (2014) stresses that educators can raise empowered and knowledgeable individuals, who can participate in the transformation of systems by promoting activities that have more realistic content and collaboration, basing these actions on the solution of problems.. 20.
(28) Individuals’ critical thinking skills may benefit leaners to make coherent and constructive decisions, which may be determinant for their lives, emphasizing the importance of this mental process in people. According to The Open University (2008), independent learners’ can be an illustration of what a critical thinker is as a consequence of employing “higher order skills” when managing information appropriately. In fact, The Open University (2008) by means of Bloom (1956) describes briefly the skills needed and developed by critical thinker persons: to know, to comprehend, to apply, to analyze, to synthesize, and to evaluate.. Fig 2. Levels of intellectual skills: the thinking triangle. Source: The Open University (2008) by means of Bloom (1956).. To educate critical thinking individuals may be a result of performing challenges that engage learners actively and significantly in the development of activities. A key feature of this process is the relation that does exist between the individuals and the usage of the information appropriately, which allow making decisions to complete from the most daily common activities to more complex ones. Evidently, it is fundamental how individuals discern among all the information the most appropriate paths to accomplish actions. In fact, “Critical thinking is the careful and deliberate determination of whether to accept, reject, or suspend judgment about a claim” (Moore& Parker, 1986 p4). In addition to this, Santrock (2006) claims “To think critically implies to think thoughtfully and productively, evaluating evidences”, which underlines the. 21.
(29) individual’s significant role in critical thinking processes, which it may allow solving issues, by knowing, comprehending, applying, synthesizing, evaluating information, among other skills. Undoubtedly, educative centers may stimulus or not apprentices as a consequence of the skills that are developed into a classroom. Gradually, activities practices can train individuals arousing cognitive skills. However, critical thinking learners are not usually encouraged at schools, which may represent a constraint in the education of individuals. As an illustration of this, Santrock (2006) cites Jacqueline and Martin Brooks addresses (1993, 2001), stressing that occasionally educative institutions do not provide learners opportunities to think critically. According to Santrock (2006), students are only educated to give one answer instead of going further so that they do not search for more than one option; which is based only on imitation. As a result, students are apparently limited as critical thinkers due to topics, materials or even teachers which do not stimulate learners’ mental abilities. As a conclusion, XXI century students’ role convoke skills in individuals that can help apprentices in the solution of issues critically. Actually, the ability of coping with a vast amount of information in order to find the most appropriate answer, as a result of the levels of intellectual skills, underlines the active function of individual in modern education practices. 2.5 The impact of Visual aids used as cognitive tools in study Over time individuals have been able to evolve enormously in fields as agriculture, farming, transportation, medicine, among others. Probably, the source of evolution in human beings; which seems a particular characteristic, is the capacity of learning in order to modify knowledge solving needs consciously. In fact, visual representations seem part of human evolution, since images continuously represent concepts for groups of individuals; being transcendental since these symbols may be part of propositional information that allow persons understanding events. 22.
(30) around their lives. For instance, prehistoric painting caves are samples of how visual representations were used by humans to inherit visual data, which may provide ideas even nowadays about hunting practices, species that lived in a determined era, tools used to hunt, among others, which could be significant as a reference of hunting practices for particular groups. Currently, visual representations continue being used to convey meaningful information; as a matter of a fact, Veřmiřovský (n.d.) by means of Prucha (2009) stresses “visualization of information has universal clarity regardless the diversity of languages, decoding speed, relativity, and more”. In addition, Veřmiřovský (n.d.), explains that visualization may accelerate communication, representing a useful tool in routine matters as well as playing an important role at school and learners, representing a resource that can be used practically. Today, visual representations continue providing human beings the possibility of learning continuously which convokes individuals capable of decoding the information behind images. In fact, Valero (2001) explains “Since human appeared in the world, he began to learn at the same moment that he opened his eyes”. In consequence of this, it may be necessary to remark the need of visual literacy skills in learners that can lead them to understand and manage this type of tools; in this case, what representations as infographics mean. Actually, Veřmiřovský (n.d.) stresses the importance of creating an adequate context, in which images can be a medium to stimulate imagination; abandoning a passive visual culture in order to become an active one. According to Veřmiřovský (n.d.) visual culture may be represented by individuals as they are able to communicate ideas employing as main tool visual resources. Nevertheless, Veřmiřovský (n.d.) underlines that it is necessary to strengthen visual culture by using didactic tools. To illustrate this, Veřmiřovský (n.d.) cites Wiebe et al, (2001) “Visualizations are associated with. 23.
(31) cognitive activities. Visualization allows the application of scientific concepts of science in new concept”. Naturally, the impact of visualizations may find its boundaries as a result of the diversity of individuals whose preferences may impact or not their educative doings. Therefore, visuals is only an option that can enrich the catalog of study tools that learners can use as a mean to understand and learn by making more adaptable information to senses. According to Gilbert (2005), “The process of simplification and representation and within the scope of humans senses with the aid models becomes of greater importance”. In fact, Gilbert (2005) remarks that is crucial to develop models based on visuals which represent entities, causes, and effects, which can be used to explain; in this case, natural phenomena. In order to illustrate this assumption, Gilbert (2005) cites Rothenberg (1995), using as a reference Kelule’s dream about the structure of benzene being like a snake biting its tail. “The development of models and representations are in crucial in the production of knowledge” (Gilbert, 2005). In addition to this, Gilbert (2005) explains that models (visuary aids) can endow abilities as to produce, to test, and to evaluate. Clearly, the cognitive impact that visual representations wield in pupils may be significant used as a tool. “The process of visualization is, as we have seen, widely used through science and science education. Their attainment and fluent use must, I suggest, entail metacognition the ability to think about ones thinking” (P.S. Adey & Shayer, 1994 by means of Gilbert (2005). 2.5. 1 Infographics: Origins The communicative impact of image has gradually performed significant roles in human being as a resource to convey and decode information. In addition, visual models as sculptures, painting caves, Maya codices, Egyptian hieroglyphics may support and be evidence of how convenient the usage of visual representations is to spread knowledge. In fact, the power of. 24.
(32) conceptual maps can also be another example about the timeless impact that images adapted for pedagogical practices wield, by which infographics might be considered and adapted as an English study tool. “Human being has always felt the necessity to communicate graphically or visually to explain things that are difficult to describe only using words” (Gamonal Arroyo, 2013). In the face of the continuous advance, the evolution of visual representations is not an exception as a result of the individuals’ cognitive progress, which is reflexed in several demonstrations of human development. In order to illustrate this advance, Gamonal Arroyo (2013) explains that human being started understanding natural phenomena as a consequence of explaining it through universal principles that are formulated abstractly as an effect of the predominance of reason upon the human senses. According to Gamonal (2013) Leonardo da Vinci represents a paradigm in the use of visual representations since da Vinci’s works represent the communion between knowledge and its visual representation.. Fig.3 Infografía etapas históricas y desarrollo (Gamonal,2013).. The origin of infographics found its beginning as a tool to spread information as Valero (2001) suggests in the XVII century as a result of being used in journals to depict information more practically; nevertheless, its origin resembles still debatable due to the existence of 25.
(33) informative brochures that can be also considered as infographics in XV century. In a concise manner, the power of visual representation as a mean to simplify data is essential since this resource allow dissecting a complex topic in smaller parts, which is benefit to understand it better. “In the face of the enormous and complex world created by the human being, the main goal is to make readable and comprehensible everything that surrounds us” (Moles 1989 cited by Gamonal Arroyo 2013). In order to illustrate, to Gamonal Arroyo (2013) by means of Points (2007) the century XVI and XVI illustrate how scientific studies as time measurement, distance and space were represented in engravings remarking the presence of visual tools as a timeless resource that individuals use to represent its understanding about the world. The Mr. BLIGHT’S HOUSE (see Valero, 2001:47); which is an infographic underlines the value of this kind of visual resource to convey information in which the reader decodes a scene where the murderer Richard Patch walked through the Mr. Blight’s mansion in order to murder him. This infographic allows perceiving details as the bullet trajectory and the Mr. Blights’ remains are exposed graphically instead of describing it using only words. Thanks these kind of visual representations the information is explained more rapidly and practically; revealing how readers perform active roles as an effect of decoding these types of representations. Another example that underlines the effect of infographics; in this case digital, was mentioned by Cairo (2008); which is related to a New York Times publication (2007). Basically, this infographic did catch the readers’ attention about next situation: Is it more convenient to buy or rent a home? “In this case, the graphic does not only show the evidence, but it allows the readers to create their own particular evidences, adapted to their circumstances, wishes or curiosities” (Cairo, 2008: 16). In a concise manner, “Infographics reveals itself as the most effective medium to transmit in a rapid and concise way the fundamental aspects related to information” Valero (2001: 57).. 26.
(34) Hence, the power of infographics to summarizing complex information exposing it more practically through visual representations, creating significant relationships among concepts which can be internalized by users that apparently may know, comprehend, apply, analyze, synthesize, and evaluate what is displayed, resulting in a more active individual capable of decode a message through these types of visualizations.. Fig 4. The Times, London 1806. (Valero, 2001: 47).. Nowadays, the appropriate use visual models; in this case, infographics reveals the ability that individuals wield to make knowable the events that involve human perception of the world by decoding concepts represented through images. Consequently, it is crucial to raise individuals capable of interpreting and creating visual tools that symbolize how persons manage of information consciously in order to represent their own understanding about events that surround their lives. In order to expose how adequate is the use of images to produce information, Richard Wurman (n.d.) coined the term “the architecture of the information”, advising about an exponential growth of information; which describes the necessity of professionals capable of organizing it coherently, systematically, and comprehensibly” (Cairo 2011: 30 by means of Gamona Arroyo 2013). Evidently, the value of visual representations to symbolize human thinking seems to be a timeless practice in which individuals represent an essential role being 27.
(35) developers of knowledge progressively. “This is the main aim of infographics and data visualizations: synthesize a large amount of information to be understood at a glance” Gamona Arroyo (2013). 2.5.2 Infographics as an English study tool Currently, the continuous progress in different areas of knowledge convokes individuals capable of coping with vast range of data which is managed daily as a result of sources of information as Internet, academic or informal publications, among other human activities. Beneyto (2013), in order to describe how the generation of information increases day after day, in the same year, reported that 2, 700 millions of computer users sent around 200 millions of emails every minute, 200 millions of consults were realized on Google, and 30, 000 new articles appeared in Tumblr or WordPress, among others. In consequence, it seems necessary that individuals develop tools; in this case infographics, which may facilitate the use of information more practically. For instance, Beneyto’s report about individuals’ habits related to the usage of data is presented by an infographic; which allows comparing how this instrument can depict the same event combining text and visual elements. The visual element below prudently represents the practical character that infographics have in order to represent complex data using a more concise tool.. 28.
(36) Fig 5. Data never sleeps. Source: ¿Cuánta información se genera y almacena en el Mundo? (DOMO n.d. by means of Beneyto, 2013).. Today, the impact of visual representations in human being development of information, whose samples to spread data can be seen in different periods of human civilizations, may reinforce the use of image as propitious tool to represent mental concepts; which it consequently convokes individuals able to interact with information in order to adapting these resources for school activities. In this case, English study practices may find in the employment of these type of visual representations another educative alternative to study this language, which allow pupils creating and decoding information to represent it visually regarding their own understanding about a particular topic. Actually, the creation of conceptual maps is a reference of how individuals may be benefited by using tools that are also based on a propositional learning that underlines its cognitive impact in individuals. According to Aguilar (2006) by means of Novak (1998: Gowing 1988) the scientific knowledge can be constructed using a complex structure of propositions; which underlines the goal of constructing truth propositions. Aguilar (2006) also describes that representations as the conceptual map aims to represent meaningful relationships among concepts. The impact of visual models is described by Aguilar (2006) illustrating that these type of mental representations allow understanding, classifying, and representing events which consequently are displayed visually using signs, symbols or drawings. Concisely, Aguilar (2006) by means of Novak (1998) explains that words can be represented as “labels” that represent concepts as a result of ideas can be named and communicated using language. The impact of managing concepts using images is described by Aguilar (2006) by means of Novak (1998; Novak and Musonda, 1991) explaining that learning can be developed through propositional structures that are organized and displayed hieratically according to the advance of meaningful learning in. 29.
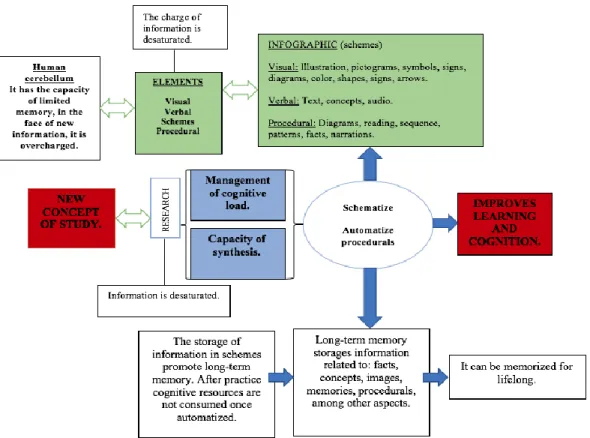
(37) scientific learning. In relation to the impact of visual tools, it can be underlined by means of Aguilar (2006) that an important education goal from preschoolers to high level of education is to provide students the opportunity of owning concepts gradually. Albar (2017) stresses the pedagogical impact that infographics represent if it these resources are implemented under a fun approach that may arise the interest of individuals. In addition, Albar (2017) describes how other resources related to the infographics as the great game of goose allow connecting these tools with games that can foster motivation which facilitate comprehension and learning. According to Albar (2017) by means of Alcalde (2013) “students that work with infographics must acquire competences as skills comprehension, evaluation, analysis, simplification, make decision, and ability to represent artistically data into information and information into knowledge. In order to illustrate how infographics can be adapted for educative practices, Albar (2017) describes briefly that teachers must be capable of adapting these resources in creative and didactic models which can develop topics transversally. The use of infographics as a tool to acquire knowledge is explained by Albar (2017) as a design of visual schemes that can represent ideas using the least amount of graphemes. In addition, the influence of infographics is explained by Albar (2017) regarding Costa’s article (2014) “The power of schemes” based on studies related to The Poynter Institute Miami performed in 1990. According to Costa (2014) “The prestigious journalistic center, created the Eye tracking (the process of evaluating where the sight is posed, or the movement of the eye in relation to the head. This process is used in researches of visual systems, a sophisticated tool of video that allows registering millimetrically how eyes observe media”.. 30.
(38) The impact of infographics in study may endow individuals the ability to create and adapt own mental representations of their understanding which might be significant as learning skills; hence, the worth that these types of visuals may represent as study tools. In order to describe this phenomenon (Albar 2017) by means of Alcalde (2014) explains students perform essential roles as the “makers” of knowledge based of data; which can develop basic competences in learners described as the management of the cognitive load and the capacity of synthesis as a result of using mental representations as infographics.. Fig 6. From left to right is presented a reading about the management of cognitive load, capacity of synthesis, and long-term memory (Adapted from Albar, 2015).. As it can be seen in the previous figure, the use of visual tools can represent a propitious element to study actively; where evidently students need to adopt an active role in the process their own learning; above all, living an era where the continuous advance of human requires to facilitate the manipulation of knowledge constructively. In consequence, infographics adapted as study. 31.
(39) tools may represent a summative and educative tool which also convokes and promotes visual literacy skills for individuals. 2.5.3 Elaboration of infographics as English study tools The process of representing mental concepts by infographics necessarily involves the correct manipulation of characteristics connected to this tool in order to be adapted as a didactical resource. According to Albar (2017) the essential elements that characterize this kind of visual models are: images and illustrations that can be simplified and schematized; otherwise, it is advisable the utilization of narrative elements. Albar (2017) explains by means of Alcalde (2013), students that create this kind of mental representations can impact in the transversal cognitive development of contents which is the consequence of elaborating a work that regards high mental skills as comprehending, evaluating, analyzing, simplifying, deciding, and representing data into information becoming knowledge lastly. Regarding Albar (2017), the function of teachers is vital since creative and didactical activities that can involve the usage of this of infographic, is part of their work as a result of implementing the usage of this resource into classroom constructively. Actually, Albar (2017) exposes that it is also necessary to adapt this resource according to the students’ ages and to identify if this activity can involve both students and teachers; which may serve as a guide to select contents according to goals as well as if allows stimulate individuals’ behavior as attention, participation, interest and exploration. Infographics design essentially requires the construction of narrative visual representations which are enriched with imagery elements that make possible to convey a message clearly and practically. Consequently, the users of this tool may understand a topic at first glance although the complexity of the subject presented by using this type of visual representation. Albar (2019) enlist different type of infographics that might be eventually used as didactical tools to engage. 32.
(40) students to development them for school activities. The types of infographics that teachers and students can use as part of their learning activities are: interactive infographics, analog infographics, graphic narrative (infographic similar to comics), informative infographics (using maps, elaboration processes, schematic blueprints), among others. Infographics are composed with basic elements that symbolize powerful pieces that allow this tool the constructing visual communication. According to Albar (2017), the parts that conform this type of visual models are: 1. Signs, symbols, icons, pictograms, and ideograms: This type of semiotic elements, presented through schemes, can facilitate the information into the infographics as a result of embodying concepts through imagery that combines esthetic, function, and significance. 2. Diagrams and its different typologies: Bar charts, single-line diagram, conceptual map, mind map, Gant diagram, heatmap, among others. These types of visual elements can be used to describe data, probabilities, comparative information, etc. Consequently, these resources enhance to organize appropriately the organization regarding schemes. 3. Maps, blueprints, and itineraries: The use of maps allows recreating sceneries whose result is information contextualized. For instance, the use of blue prints enables to be in the architectonic spaces. Likewise, the itineraries serve as reference to visualize and understand the events displayed in this type of tools. 4. Illustrations: Imagery resources may be used regarding real visuals and iconicity, whose significance is the result of an abstraction and deformation process of the images to endow the comprehension of the visualization. As a consequence, the usage of images cannot symbolize as a simple ornament; on the contrary, visual representation must be efficient to convey information. 5. Shapes of geometrical figures: It can be used most of figures and shapes that represent simplicity, symmetry, regularity, coherence and stability in order to stimulate the achievement of elements that encompass the infographic. 6. Color: The use of this feature into an infographic allows spreading information regarding aims as communication, highlighting, association, differentiation, impact, among others. 7. Signs, arrows, dividing lines, and vectors: The usage of sings, arrows, dividing lines, and vectors., facilitate the organization and coherence due to these elements act as guide to focus attention in the infographic representation; making visible the existing connections to improve presentation and understanding of information.. 33.
(41) 8. Written text and typography: The text used in infographics must regard the language according to the audience, the narrative style of text, the contrast of text used in this visual tool, the integration between writing and graphic elements, among others. Evidently, the font style used is essential as well as it may be supported with freehand drawings. 9. Text containers: Shapes, iconographic forms, and comic elements (boxes, captions, etc.) are delimited and propitious areas to add text. 10. Image and text sequence: It is possible to represent image and text through processes that create different sequences. For example, the separation between the graphics and text enhances analyze individually each one of these elements. Another form to arrange text and images is by integrating the graphic in the text which can result in a radial reading. Also it is possible to organize the elements of infographics in order to produce a lineal reading which is the result of using graphics since the beginning until the end of the infographic. 11. Size of elements involved in the infographics development: The size of visual elements and the size of text depends on the functions that performs in the infographic. Finally, the design of didactical infographics is described by Albar (2017) by means of Cairo (2009) in 3 steps: 1. Extraction and selection of information: It represents to be immersed accurately into the subject; using the appropriate sources which requires an active attitude towards research and explorations in order to filter information, to extract it, and to schematize it creatively for didactical purposes. 2. Planning development for information: It is characterized with the management of information to select the most appropriate data to express clearly the purpose of the infographic. This action is essential in consequence of communicative synthesis that regards the most important aspects of the information selected as well as the didactical organization all the data employed. 3. Artistic implementation of the plan: It is the most creative part of the infographic design. Consequently, graphic- artistic techniques are imperative; evidently, it is necessary to use imagery as drawings, illustrations, pictures, collages, etc. It is mandatory to create previously drafts using schemes and conceptual maps before the final representation. In addition, it essential to use only relevant text as well as it is necessary to dismiss irrelevant information. To conclude, didactical infographic design evidently symbolizes an arduous process, in which the management of data and visual elements integrated correctly, may facilitate learners’. 34.
(42) activities as study by providing a tool that makes more understandable contents. Necessarily, the implementation of this type of resources convokes in individuals to be acquainted with the impact of the architecture of information to schematize, organize, to display data, among others. In consequence didactical infographics might be employed as a summative alternative to study different subjects; in this case, English. “Texts explain. Images display. Schemes, in addition, demonstrate. (Albar, 2017 cites Costa, 2014). “The infographic adapted to educative needs is a pedagogical and didactical resource that facilitates meaningful learning and improves cognition” (Albar, 2017).. 35.
(43) CHAPTER 3: METHODOLOGY 3.1 Introduction This chapter provides information about methodology employed during this research. Concisely, context, subjects, instruments and procedures involved during this paper are described prudently in order to represent results obtained lastly which involved activities as the application of an instrument, the students’ English infographic samples as study tools, among other actions. Basically, the information gathered during this research identified students’ attitudes at the moment of using an infographic for English study purposes. Evidently, participants’ feedback did represent a vital element since it embodied data about whether to use infographics as a study tool. Finally, this research is based on a quantitative-qualitative approach that involved usage of surveys, conformed whit Open & YES-NO questions; whose results were represented afterwards. 3.2 Research Context The purpose of this paper explored how university students reacted to usage of Infographics as an English study tool option; which would allow knowing whether this resource might be considered useful and suitable for the participants of this paper. This research took place at Facultad de Contaduría Pública which is located in C.U. (Ciudad Universitaria) at Benemérita Universidad Autónoma de Puebla. Respectively, the participants were enrolled to FGUM (Formación General Universitaria Minerva) who were expected to be involved about the use of an infographics by creating one.. 36.
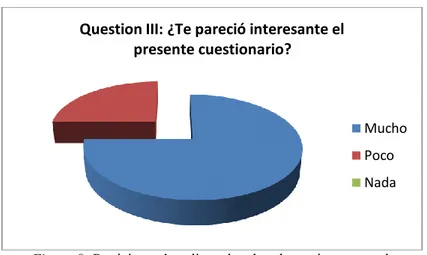
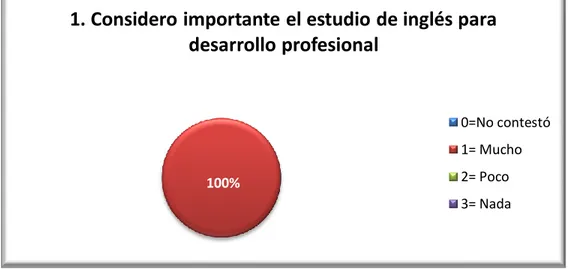
(44) 3.3 Participants The participants of this research were 29 university students from Lengua Extranjera Inglés I at facultad de Contaduría Pública, BUAP; whose ages oscillated from 18 to 21 years old (21 females and 8 males). Most of them were enrolled in their first English course at university; as well as, they did belong to the Minerva Curricula. 3.4 Research Design In order to obtain more detailed data about how the participants of this research tend to organize their studies. In consequence, it was designed a survey (see appendix) that contained questions that attempted to scan participants’ personal opinions about the impact of English, use of synoptic charts, employment of mind maps, synthesis of complex content, combination of imagery and text, among others. Necessarily, the instrument was written in Spanish since the students’ English level was basic; which facilitated them to provide a more accurate answer. The instrument (questionnaire) was divided into 4 sections: Firstly, the first section contained 12 statements that students did answer marking with an x according to criteria provided: mucho, poco, nada. Secondly, next section was formed by 6 questions whose criteria differed lightly from the first section: 3= muy importante, 2= importante, 1= nada importante. The third section was different compared to the other sections within the present instrument since it involved text and images in this part of the survey. Consequently, students were expected to notice this particular feature in order to provide feedback in the last section, so it would make easier to know how students reacted towards a section that combines text and images (an infographic characteristic). Finally, the fourth section exposed students’ comments about the instrument design that served as feedback to correct mistakes in order to get more reliable data before applying the final. 37.
(45) version already corrected. Evidently, instructions were also elaborated in Spanish which facilitated the participant’s comprehension and replies which were analyzed afterwards. The questions that form the last section were “¿Fueron claras las preguntas de este cuestionario? ¿Por qué?”, “Puede ser mejorado este questionario? ¿Cómo?”, “¿Te pareció interesante este cuestionario? ¿Qué sección?”. The participants answer according to next criteria: 3= mucho, 2= poco, 1= nada. Likewise, the fourth section included Open questions whose purpose was to engage students in order provide more detailed information. 3.5 Procedure Necessarily, the development of the research involved the creation of an infographic which contextualized the usage of this visual representation for English study. Apart of this, it required the development of a survey, which was fundamental to collect the participants’ reactions to usage of infographic as a possible didactical tool. The application of the instrument required a pilot stage in which participated four students (a, b, c, d); who were chosen randomly. The participants’ feedback was worthy since it served to correct the draft version of the instrument; which allowed collecting participants’ answers during the final application of the survey. After having applied the pilot, data was analyzed carefully in order to polish the structure of questions, vocabulary, and the structure of the sections. 3.5.1 Application of the instrument (PILOT) The pilot was applied on Monday 9th, February, 2015 at the Facultad de Contaduría Pública which is located in C.U. (Ciudad Universitaria) at Benemérita Universidad Autónoma de Puebla. The participants were four students (2 males and 2 females) whose English level was basic; as a result, instructions were given in Spanish which facilitated the participants to answer. In. 38.
Figure


+7


Documento similar
For example, the variable that has the highest correlation with both math and Spanish grades is teacher-perceived effort, significantly higher than cognitive skills, cognitive
In the “big picture” perspective of the recent years that we have described in Brazil, Spain, Portugal and Puerto Rico there are some similarities and important differences,
If thinking is high and emotions become salient after thinking, they can lead people to rely or not rely on the thoughts generated either because the emotion leads people to like
Table VII shows the results of the five tests assessing visual object and visuospatial skills. The cognitively preserved group did not show statistically significant differences
the correct sequence of actions to achieve a specific goal, thus enhancing sequential skills that are recognized as very important for cognitive development since the
Conclusion: in the AVENA and AFINOS studies ado- lescents who disliked physical education had similar re- sults in cognitive and academic performance than their peers, but in
With the aim to check the impact and usefulness of these mobile learning environments in education (focusing on helping students with time management by recommending them
It is important to note that the two analyses (the original pre-registered analysis on the Theta peak and the Theta power time evolution) address different aspects of the
