Optimization of agitation in a wood liquefaction reactor
58
0
0
Texto completo
(2) TFG REALIZADO EN PROGRAMA DE INTERCAMBIO. TÍTULO:. Impact Project: Optimization of agitation in a wood liquefaction reactor. ALUMNO:. Iria Serrano Medina. FECHA:. June, 2019. CENTRO:. Instituto Superior Técnico- Universidade de Lisboa. TUTOR:. Prof. João Carlos Moura Bordado. A mis padres y a mi novio, por darme ánimos y fuerza cuando yo no los tenía. A mi hermano, porque si yo pude, él también.. 2.
(3) RESUMEN En este proyecto se ha optimizado la agitación de un reactor utilizado para la licuefacción de madera. En la primera parte, destinada a contextualizar este trabajo, se ha presentado de forma genérica el proyecto del que forma parte este trabajo y se ha descrito brevemente la totalidad del proceso industrial, poniendo especial énfasis en la reacción química de licuefacción que se lleva a cabo utilizando biomasa lignocelulósica para producir bio-óleo y otros compuestos de alto valor añadido. En la segunda parte, se estudiado el problema de agitación presente en el reactor actual y se han realizado diversos análisis con los materiales disponibles actualmente en el laboratorio con el fin de optimizarlo. Los parámetros considerados más relevantes en el sistema de mezcla actual han sido la velocidad de rotación del agitador, la posición del mismo respecto al fondo del recipiente y el tamaño y forma del propulsor. En la tercera parte, y dado que la optimización de la agitación del reactor lograda con los medios disponibles en el laboratorio se ha considerado insuficiente, se ha propuesto un nuevo agitador realizado un breve estudio comparativo entre dicha propuesta y el agitador actualmente utilizado en el laboratorio. Para ello, se ha hecho una breve revisión de los tipos de agitadores disponibles actualmente en el mercado, eligiendo un agitador tipo ancla que por sus características fue considerado idóneo. Seguidamente, se han modelado en 3D los elementos necesarios para realizar una simulación CFD en la que se ha procedido a analizar la influencia del agitador en el flujo creado en el interior del reactor utilizado para la licuefacción. Como conclusión, se ha considerado que, si bien la propuesta de utilizar un agitador tipo ancla para evitar el depósito de residuos sólidos al fondo del reactor técnicamente era viable, lo ideal sería poder probarla en el laboratorio antes de proceder a su implementación en la planta piloto.. PALABRAS CLAVE: Licuefacción de madera, agitación, optimización, simulación, agitador tipo ancla 3.
(4) ABSTRACT The aim of this project has been optimizing the agitation of a reactor used for wood liquefaction. First part is destined to contextualize this dissertation. The project in which this work is included has been presented generically and the entire industrial process has been briefly described, focusing on the chemical reaction of liquefaction that is carried out using lignocellulosic biomass to produce bio - oil and other compounds of high added value. In the second part, the stirring problem present in the current reactor was studied and various analyses were done with the materials currently available in the laboratory to optimize it. The parameters considered most relevant in the present mixing system were the rotational speed of the agitator, its position regarding to the bottom of the vessel and the size and shape of the impeller used. In the third part, and since the optimization of reactor mixing achieved with the means available in the laboratory has been considered insufficient, a new agitator has been proposed, making a brief comparative study between this proposal and the agitator currently used during lab experiences. A brief review of the types of agitators currently available in the market has been made, choosing an anchor blade stirrer which, because of its characteristics, was considered suitable. Then, some elements have been modelled in 3D to perform a CFD simulation in which the influence of stirrers on the flow created inside the wood liquefaction reactor has been analysed. In conclusion, it was considered that, although the proposal to use an anchor blade stirrer to avoid the deposit of solid particles to the bottom of the reactor was technically feasible, it would be ideal to be able to test it in the laboratory before proceeding to its implementation in the plant pilot.. KEYWORDS: Wood liquefaction, agitation, optimization, simulation, anchor blade stirrer 4.
(5) INDEX INTRODUCTION 1.. Scope ................................................................................................................................ 8. 2.. About the project .............................................................................................................. 9 a.. Semapa and The Navigator Company ............................................................................ 9. WOOD LIQUEFACTION 3.. Lignocellulosic biomass: .................................................................................................. 11 a.. Cellulose...................................................................................................................... 11. b.. Hemicellulose .............................................................................................................. 12. c.. Lignin .......................................................................................................................... 13. 4.. Liquefaction process ....................................................................................................... 14 a.. Alternatives ................................................................................................................. 14. b.. Process and pilot plant description .............................................................................. 15. c.. Products obtained ....................................................................................................... 16. OPTIMIZATION OF AGITATION 5.. Detailed description of actual situation: .......................................................................... 18 a.. Fluid characterization .................................................................................................. 18. b.. Materials currently used.............................................................................................. 19 i.. Agitator ................................................................................................................... 19 1.. In the pilot plant .................................................................................................. 19. 2.. In the laboratory .................................................................................................. 20. ii.. c. 6.. Tank ........................................................................................................................ 21 1.. In the pilot plant .................................................................................................. 21. 2.. In the laboratory .................................................................................................. 21. Problems ..................................................................................................................... 22 Optimization of actual stirrer .......................................................................................... 22. a.. Variables to optimize ................................................................................................... 22. b.. Tests changing speed................................................................................................... 23 i.. TEST 1: ..................................................................................................................... 23. ii.. TEST 2: ..................................................................................................................... 24. iii.. TEST 3: ..................................................................................................................... 25 5.
(6) iv. c.. TEST 4: ..................................................................................................................... 26 Tests changing impeller ............................................................................................... 27. i. d.. TEST 5: ..................................................................................................................... 27 Test changing impeller’s position ................................................................................. 27. i. e. 7.. TEST 6: ..................................................................................................................... 28 Conclusions ................................................................................................................. 28. Proposing a new agitator................................................................................................. 30 a.. Alternatives ................................................................................................................. 30 i.. By the type of flux.................................................................................................... 30 1.. Axial flow agitators .............................................................................................. 31. 2.. Radial flow agitators ............................................................................................ 31. 3.. Agitators of closed passage .................................................................................. 31. ii.. By the shape of the blades: ...................................................................................... 31 1.. Shovel impellers................................................................................................... 31. 2.. Propeller impellers............................................................................................... 32. 3.. Turbine impellers ................................................................................................. 32. b.. Type selection. ............................................................................................................ 33. c.. Comparison between actual impeller and proposed impeller: ..................................... 34 i.. Main characteristics................................................................................................. 34. ii.. Basic simulation of flows in the reactor by computer ............................................... 35 1.. Software used ...................................................................................................... 35 1.. Calculation method .......................................................................................... 36. 2.. Main equations of fluid mechanics ................................................................... 36. 3.. Geometry ............................................................................................................ 37 1.. Tank ................................................................................................................. 37. 2.. b. Impellers ...................................................................................................... 38. iii.. Boundaries and mesh definition. ............................................................................. 41. iv.. Simulation: .............................................................................................................. 42 1.. Streamlines: ..................................................................................................... 42. 2.. Vorticity ........................................................................................................... 45. 3.. Power consumption ......................................................................................... 46 6.
(7) d. 8.. Conclusions ................................................................................................................. 48 General conclusions and future perspectives ................................................................... 50. BIBLIOGRAPHY ANNEXES: ANNEXE 1: Figure index ANNEXE 2: Tank used for simulation ANNEXE 3: Anchor impeller used for simulation ANNEXE 4: Two flat blades impeller used for simulation. 7.
(8) Introduction 1. Scope The project that I am going to develop is a part of another larger which proposes the design and optimization of a pilot plant for wood liquefaction. This project exists thanks to a collaboration between Instituto Superior Técnico and holding company Semapa in order to produce bio combustible and other products with high value added. The pilot plant is located in Patalha, Leiría district, Portugal, and is able to produce about 3 ton/day of liquefied wood. It operates using lignocellulosic biomass as raw material, which is introduced together with an acid solvent and a catalyst in a jacketed and stirred reactor by 90min at 160ºC to produce liquefied wood. After the reaction, products are filtered twice to separate liquified from biomass not converted. The liquified goes then to an extraction unit, where bio-oil and sugars are separated. The aim of this project is to optimize the agitator of the batch reactor used for wood liquefaction. Wood liquefaction is a thermochemical procedure used to obtain high value compounds such as bio-oil or raw materials for phenolic resins from organic residues, especially lignocellulosic ones. That means that, during the reaction, high viscosity compounds must appear, as well as solids in suspension from biomass not converted. Optimized stirrer must be able to homogenize high viscosity products, avoiding dead zones with lower conversion in the reactor. Reaction inside must be happening at 160ºC during 90min, so reactor must be jacketed, and a thermocouple and a serpentine must be installed inside the vessel. Also, to create inert atmosphere inside, a nitrogen flow is flowing in a continuous way during the whole reaction. The optimized stirrer must keep all those elements inside the bowl, as well as heat transfer is maximized during the reaction.. 8.
(9) 2. About the project This project was started by a collaboration between Instituto Superior Técnico and Secil business group, belonging to Semapa, which is one of the largest industrial groups of Portugal. The collaboration started as Energreen in 2012, who was a first phase in which basic design of the project was completed. In this phase, the liquefaction process was developed to convert waste into fuel, by fixing parameters such as reaction conditions, type of solvent and catalyst used, etc. In a second phase, called Alfagreen and carried from 2016 to 2018 also in collaboration with Secil group, the aim was optimising the whole process and increase the value of products. During this phase, the research was focused on the improvement of biofuel calorific value and on the extraction of added-value chemical products of origin bio-based, such as raw materials for glues, resins and other products traditionally made from petroleum. This third part, started in 2018 by a partnership with Navigator company, also belonging to Semapa group, is called Inpactus, and it is focused to keep improving the process specially regarding to products coming from eucalyptus wood.. FIGURE 1- SCHEME OF THE WHOLE PROJECT. a. Semapa and The Navigator Company Semapa is one of Portugal’s largest industrial groups, with a workforce of more than 6,000 and a presence on several continents. More than three quarters of its turnover is generated on foreign markets. Its business activities consist of indirectly managing its holdings in three industrial areas:. 9.
(10) -. PULP AND PAPER, through its holding in The Navigator Company. -. CEMENT AND OTHER BUILDING MATERIALS, through its holding in Secil. -. ENVIRONMENT, through its holding in ETSA. As said, this third part of the project is promoted by The Navigator Company, which is an integrated forestry, pulp and paper, tissue and energy undertaking. Its business is based on large scale modern facilities that use cutting-edge technology and set quality standards for the sector.. The Navigator Company is Portugal’s third largest exporter, and the exporter generating the most added value for the country. Consolidating its position as a European leader in the production of uncoated woodfree printing and writing paper and ranked 6th worldwide, the company is also Europe’s leading producer (ranked 5th worldwide) of bleached eucalyptus kraft pulp. Nowadays, it sells to around 130 countries on five continents, mainly Europe and the United States. The Navigator Company is a vertically integrated forestry undertaking with its own forestry research institute (RAIZ). It manages vast areas of forest certified under the national FSC® and PETC™ systems, with production capacity of 1.6million tons of pulp, 130000tonnes of tissue and 15tWh/year of electricity. It also operates some of the Europe’s largest forest nurseries, with annual production capacity of around 12 million certified plants of various species destined to renew Portugal’s woodlands.. 10.
(11) Wood liquefaction 3. Lignocellulosic biomass: Raw materials used in the reactor will be biomass obtained from forest residues, such as eucalyptus or pine woods. Nowadays, this kind of product is considered one of the most important renewable sources to substitute petroleum to obtain bio combustibles and other high value chemical products, such as phenolic resins. Depending of the type of wood used, percentages may variate, but in general terms, the main composition of lignocellulosic biomass is described in Figure 2:. FIGURE 2- COMPOSITION OF LIGNOCELLULOSIC BIOMASS 1 As we can see, wood is mainly composed by three polymers related between them by intermolecular forces: cellulose, hemicellulose and lignin. Correct stirring during chemical reaction is important since it helps, mechanically, to break these forces by separating molecules constituting biomass.. a. Cellulose As described in figure 2, cellulose is usually the most frequent compound of lignocellulosic biomass. In fact, it is the most abundant organic polymer on Earth. Structurally, cellulose is an linear polysaccharide with the formula (C6H10O5)n, being n bigger than 2000. The several D- glucoses forming each chain are linked by β(1→4) O-glucosidic links, and linear chains are usually related to each other by hydrogen bridges between hydroxylic groups, just as seen in figure 3. 11.
(12) FIGURE 3- CELLULOSE STRUCTURE Simple sugars can be easily obtained when cellulose is liquefied (depolymerized), as well as other compounds as furfural or levulinic and formic acids.. b. Hemicellulose In contrast with cellulose, hemicellulose is composed by heteropolysaccharides, it means, polysaccharides formed by more than one sugar molecule. Heteropolysaccharides usually have shorter chains and ramified and amorphous structures, mostly made of linked hexoses (glucose, mannose and galactose) and pentoses (xylose and arabinose). However, other saccharides can appear within the monomeric structure, such as fructose or mannose. An example of hemicellulose structure is described in figure 4.. FIGURE 4- HEMICELLULOSE STRUCTURE When liquefied (depolymerized), hemicellulose produces monomeric sugars and other compounds such as levulinic and formic acids and furfural, just as cellulose does. 12.
(13) c. Lignin Lignin structure is quite different to cellulose and hemicellulose’s since its basic structure is not formed by sugars but aromatic compounds, which leads to rigid and more resistant cellular walls. This aromatic matrix is basically formed by cumarilic, conipheric and sinaptilic alcohol, linked in a random way to integrate an amorphous structure, as seen in figures 5 and 6.. FIGURE 5- BASIC COMPOUNDS OF LIGNIN. FIGURE 6- LIGNIN STRUCTURE As we can see, the higher amount of hydrogens and carbons rather than oxygen atoms made this biomass compound the most potential one regarding to production of high-quality bio combustibles. During liquefaction, intermolecular links of the macromolecule get broken and some irregular oligomers are generated, same as some linear ones.. 13.
(14) 4. Liquefaction process a. Alternatives The aim to liquefy lignocellulosic biomass is to produce higher value products, who will be used as raw material is some other industries (e.g. phenolic resins) or as bio combustible to reduce CO2 emissions. Some other processes were considered to reach this objective, specially energy production: gasification, pyrolysis and combustion of the biomass2. -. Gasification: consists on transforming a solid organic product in two phases: one solid, usually formed by inert mass, and other gaseous, called syngas, which is commonly used to produce energy. A pre-treatment is commonly needed to prepare the biomass to the gasification, reducing the size of particles and eliminating excess water. Once gasificated, syngas often needs to be treated before the burning to avoid undesirable gases, such as sulphuric and chlorhydric ones.. -. Pyrolysis: is a thermal decomposition procedure happening in oxygen absence to produce liquid and solid products with high carbon content. There are three types of pyrolysis (slow, medium and high speed), depending on the residence times, temperatures and particle sizes. The pre-treatment needed is very different according to biomass composition, and it can be physical, chemical, thermal or biological.. -. Combustion: this process’ aim is to obtain heat and energy by burning a combustible with the lowest cost and pollution possible. Inorganic ashes and gaseous particles will be formed, and a filter may be needed to avoid their emission.. Finally, the chosen option was liquefaction, as it has several advantages from other procedures: -. residues may be minimized by the solvent chosen, as crossed reactions which form other compounds are avoided. Also, they are easily transported, as they are mostly liquids.. -. pre-treatments are not usually needed because the moisture is not a problem but an advantage for the reaction speed.. -. temperature needed is lower, so energy consume too.. Biomass liquefaction happens in three steps, which are: (1) depolymerization of biomass to form monomers; (2) decomposition of monomers by dehydration, decarboxylation and deamination to form smaller and lighter molecules; (3) reordering of molecules by 14.
(15) condensation, cyclation and polymerization to form new and simplest compounds. Those simplest compounds can be classified as a gas fraction, a liquid fraction (including bio-oil) and a solid fraction, usually mixed with the solvent.. There are many physical and chemical parameters who can directly influence the yield reaction. They are briefly described in figure 7: Physical parameters. Chemical parameters. Pressure and temperature. Type and composition of biomass. Solvent/biomass rate. Solvent. Residence time. Catalyst. Amount of catalyst. Atmosphere. FIGURE 7- MAIN PARAMETERS AFFECTING LIQUEFACTION REACTION Several reaction conditions, solvents and catalysts were considered for liquefaction. Finally, an organic solvent, working at temperatures between 100-200ºC and atmospheric pressure and with a medium acid catalyst was chosen. The solvent is currently a mixture of 70% 2-Ethylhexanol and 30% diethylenglycol and the catalyst used is tosilic acid.. b. Process and pilot plant description In the pilot plant, the process starts when lignocellulosic biomass with a maximal size of around 2cm length is introduced in the reactor by using a screw without end. During its introduction, residues are heated and mixed with the catalyst and the solvent by pulverization to maximize the contact between molecular surfaces.. Once in the stainless-steel reactor, reagents keep being homogenized by using a mechanical stirrer and reaction happens at atmospheric pressure and 160ºC during 90 min to obtain liquefied wood. Several bibliographies3,4 have shown that liquefaction process can be modelled as 3 parallel, irreversible and independent reactions of 1st order (one for each of main biomass compounds). As process is endothermic, heat is provided in a constant way by an oil serpentine and a steam jacket connected to a boiler. Both parameters, temperature and pressure, are controlled in the reactor because they must be constant during the whole reaction. 15.
(16) Once the liquefaction is made, products must be filtrated to recover biomass not reacted from bio-oil and other products obtained. This filtration is made in two steps, because of the different particle sizes. Biomass not reacted is usually recirculated to the reactor, and other products are taken to a second treatment where sugars, bio-oil and bituminous residues are separated and valorised. Pilot plant, currently located in Patalha (Leiria district, Portugal), is designed to fit inside a sea container in order to facilitate its transportation if needed. Basic diagram of pilot plant is described in figure 8.. FIGURE 8- PILOT PLANT 'S SCHEME Where: 1- Burner. 5- Catalyst feed hopper - hopper 2. 2- Reactor. 6- Reservation of solvents. 3- Screw without end. 7- Condenser. 4- Biomass feed hopper - hopper 1. 8- Condensate tank. c. Products obtained As said, once the filtration phase is completed, liquefied wood is carried to a tank where water is added to counter its high viscosity. There, products have an approximated calorific value of 6700-7000kcal/kg, and two phases are visible in the storage tank. It is quite easy to separate the two phases by using a funnel decanter.. 16.
(17) In the aqueous phase, called SuGreen, there will be water and simple sugars solubilised, while in organic phase, named GreenOil, there will be complex glycosides, alquilphenols and other bituminous compounds. This organic phase now will have an approximated calorific value of 10500- 11000kcal/kg, which is pretty close to petroleum’s. Results obtained from analysing the composition of GreenOil produced show that around 9% can be assumed as gasoline, between 32-36% can be assumed as Diesel and rest is mostly composed by tar which, once treated, can be used in several industries whose raw materials are usually obtained from petrol.. 17.
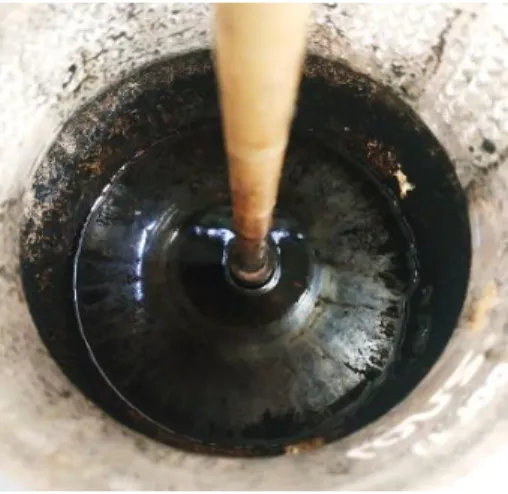
(18) Optimization of agitation 5. Detailed description of actual situation: a. Fluid characterization In order to optimise the mixer, a basic characterization of the reactor content has been done focusing on the two more extreme cases: at the beginning of the reaction and at the end of the reaction. At the beginning of the reaction, the bowl’s content is formed by a heterogeneous mix of the lignocellulosic biomass (solid) and the liquid organic solvent. Solid particles of eucalyptus wood provided by The Navigator Company have a maximal size of 2cm large and tests has shown a humidity around 44,8%. The solvent used, described as mixture 70-30% of 2- Ehtylhexanol and diethylenglycol, is colorless, not very soluble in water and slightly less dense. The aspect of the bowl before starting the reaction is described in figure 9:. FIGURE 9- ASPECT OF THE REACTOR CONTENT BEFORE STARTING THE REACTION. At the end of the liquefaction, probably several solid particles from not depolymerized biomass will rest in the bowl, but most of its content will be formed by a dark and high viscosity liquid: the liquefied. Several analyses have shown that density is quite similar to water’s, but viscosity may variate between 10-100Poise, working in normal conditions, and, in some cases, it can be even bigger- until 200Poise. This is described in figure 10.. 18.
(19) FIGURE 10- ASPECT OF THE BOWL AT THE END OF THE REACTION. b. Materials currently used i. Agitator 1. In the pilot plant Actual stirrer in pilot plant is helicoidal, with two upper helices which boost liquid to the bottom and three lower helices which impulses heavier products to the surface. The mixing in medium zone is quite good, but in the bottom of the reactor some biomass is still accumulating. Furthermore, blades from this agitator needed to be reinforced due to the high viscosity of liquefied. This reinforces also are a problem for the installation of the oil serpentine which is needed to heat the reactants, as heat transfer by reactor walls is very inefficient due to products accumulation. Other configurations such as 6 blades turbines has been already tested in the reactor, being necessary to put two sequenced to obtain an acceptable homogenization. However, due to reactor’s sizing, space inside the tank wasn’t enough to let flows created by both turbines circulate freely and result was not as well as initially expected. Figure 11 show two different configurations of pilot plant’s reactor:. 19.
(20) FIGURE 11- SERPENTINES AND 6 BLADES TURBINES INSIDE THE REACTOR, 2016 AND 2018. 2. In the laboratory Several impellers are available in the laboratory. All of them can be classified in the two more relevant types, which are the turbine impellers (numbers 1-3 from figure 12) and the propellers (numbers 4-5 from figure 12).. FIGURE 12- IMPELLERS AVAILABLE IN THE LABORATORY. Also, different materials, especially plastic and metal, and sizes (bigger has a 10cm diameter and smaller has 4cm diameter) can be tested. The agitator who is currently being used for wood liquefaction experiences is a two flat blades impeller, articulated, 10cm diameter and 1cm width, made of plastic. In figure 12, it is named with number 3.. 20.
(21) ii. Tank 1. In the pilot plant Reactor used in the pilot plant is made from stainless steel and has an useful volume of 5m 3. It is cylindrical, and it is provided with a jacketed and a serpentine to assure the temperature during reaction. As liquefaction must happen at atmospheric pressure, there are relief valves, and samples can be taken from the bottom of the reactor by using another valve. Mechanical agitation is driven by a motor placed on the top of reactor. A basic scheme of pilot plant reactor is described in figure 13:. FIGURE 13- REACTOR IN PILOT PLANT. 2. In the laboratory Reactor used in the laboratory is a 2L spherical glass one, manufactured from Lenz. It also has a valve in the bottom to ease taking samples during reaction and it is possible to introduce a thermocouple, a nitrogen flow and other requirements by the top side. Heating is obtained by a thermic blanket working with electricity and stirring is driven by a Heidolph RZR 2102 control motor, which permits knowing the torque and rotational speed during agitation.. 21.
(22) c. Problems Main problems seen during the agitation process are related to the high viscosity of products formed in the reactor. That means that, due to the high resistance of fluids to the gradual deformations produced by shear or tensile stresses, content in the reactor may not be homogeneous, and dead zones where there is no flow may appear. Some of these dead zones are seen by simple view, as part of the biomass accumulates in the walls and the lower part of the tank and forces the conversion yield in these regions to be lower. This phenomenon is shown in figure 14:. FIGURE 14- ACCUMULATION OF BIOMASS ON THE LAB’S REACTOR WALLS During the reaction, not only wood residues but also some carbonates accumulate in the reactor walls, causing other of the main problems during the reaction: the lack of heat transfer. As described before, reactor is provided with a combustion gas jacketed and an oil serpentine. Even if combustion gases in the jacketed are a very high temperatures (over 500ºC), heat transfer trough the walls is really low due to difference of densities and product accumulation.. 6. Optimization of actual stirrer As tests were mainly made in the laboratory, the reference stirrer will be the one that is currently be used for all experiences in little scale. This stirrer has already been described at point 5.b.i.2.. a. Variables to optimize Three main variables can be considered to optimize actual stirrer: speed, shape and position.. 22.
(23) Several tests have been made in the lab according to these variables. Only one of the parameters was changed in each test at the time, to be sure than comparisons between results will be possible. Reaction conditions and raw materials have been always keeping the same to compare these experiences. Wood liquefaction has been made during 90min in a 2L spherical reactor, at atmospheric pressure and 160ºC obtained with a thermic blanket. Quantities used have always been the following described in figure 15, and lignocellulosic biomass used has always been from same lot provided by The Navigator Company. liquefaction of eucalyptus biomass 100g eucalyptus biomass (wet, 44,8% humidity average) 500g solvent 3g catalyst FIGURE 15- Q UANTITIES USED FOR EXPERIENCES. b. Tests changing speed For those tests, impeller used has been the two flat collapsible blades one described in 5.b.i.2, and its position has always kept between 3-4cm from the bottom of reactor.. i. TEST 1: Several experiences previously made by other researchers in the lab decided me to choose an initial rotational speed about 170rpm using the two collapsible blades impeller already described in point 5.b.i.2. During the reaction, a lot of biomass accumulation was observed, especially in the bottom and walls of the reactor. Torque (T) was one of the main parameters followed during the experience, as it is directly related with power consumption (P) as described in equation nº1, where N represents the rotational speed expressed in s-1. T. P N. (1). It was found to be nearly constant during the 90 minutes, as described in the following graphic:. 23.
(24) FIGURE 16- TORQUE VS. REACTION TIME IN TEST 1 At the end of reaction, yield was calculated basing on the number of solid residues obtained. It was necessary to clean the residues with acetone and then let dry in the furnace during a night to make sure that there was no bio-oil mixed with solid residues. It was checked visually that most part of solid residues were biomass not reacted. Once done this, yield, expressed in percentage, was obtained by using the following equation (2):. %Yield liquefaction. . 100 1 −. . M biomass M residue. (2). Where Mbiomass is the initial amount of lignocellulosic biomass introduced in the reactor (in this experience 55,2g of dry eucalyptus biomass), and M residue is de solid mass obtained as residue after cleaning with acetone and drying in the furnace. Yield of experience 1 was 39,3%, which is considered lower than expected, and average power consumption was about 2,5W.. ii. TEST 2: In order to improve yield keeping actual reaction conditions, a second experience was made by increasing rotational speed to 200rpm. During reaction, some biomass accumulation in the reactor walls was observed. However, solids’ amount was visually lower that the one in 1st experience. Torque was also followed during this reaction and the graphic obtained was the following one:. 24.
(25) FIGURE 17- TORQUE VS. REACTION TIME IN TEST 2 Once finished the reaction, yield was calculated basing on the amount of solid residues obtained by using the same mathematical expression as for test 1, and average power consumption was obtained from torque using equation 1. Yield obtained for test 2 was 52,4%, and its average power consumption was 2,6W.. iii. TEST 3: As increasing rotational speed seemed to lead to better yield results, a third experience was made with the same impeller. In this case, speed set point was focused on 230rpm. During reaction, not a lot of solid biomass was appreciated to be accumulating in the walls and bottom of reactor, and a bit of foam appears on the reactants surface. Same as in previous experiences, torque was noticed during reaction, obtaining the following graphic:. FIGURE 18- TORQUE VS. REACTION TIME IN TEST 3. 25.
(26) Yield and power consumption were also calculated by using the similar method already explained (equations 1 and 2). Yield was found to keep increasing regarding to previous tests: 60,1%, and average power consumption for this experience was 2,7W.. iv. TEST 4: As by the moment increasing speed has always leaded to better yield results, a fourth test was made using a rotational speed of 250rpm. First thing realised during this experience was that, due to the high rotational speed fixed, fluid surface inclines appreciatory. This is caused by bigger centrifugal forces in the liquid, that sometimes visually leads to see the impeller blades. Surface shape can be described by using the following equation (3), where N is rotational speed in s-1, g represents gravity (9,81m/s2), C is the lowest point of the liquid, r the radius of the container and y the liquid height. This equation graphicly represents a parabole and is obtained from integrating force balance applied to a surface liquid particle. 2. y. 1 N 2 r + C 2 g. (3). Regarding to torque, the graphic representing its evolution regarding to reaction time is the following one:. FIGURE 19- TORQUE VS. REACTION TIME IN TEST 4 Yield and power consumption obtained during this experience were: 62,7% and 2,9W, respectively.. 26.
(27) If rotational speed continues increasing, it is seen that reaction yield will start to decrease because impeller blades would be partially out of the liquid due to the high centrifugal forces. This implies that part of the mixing power transmitted by stirrer would get lost and wasted, so, seen these results, it was decided to not keep increasing speed with this stirrer. Another reason to stop increasing speed in tests was that, at higher speeds, vibrations may start to appear in the stirrer shaft. It will be important to valorise the effect of these vibrations in mechanical structure, and, even if mixing may seem to be quite good, a most powerful fastening system will probably be required, as well as tensions in the shaft may degrade stirrer in a quicker way.. c. Tests changing impeller For those tests, speed used has been 200rpm and impeller’s position has always kept between 3-4cm from the bottom of reactor.. i. TEST 5: Once seen these experiences regarding to speed, another one will be tested by changing the size and shape of stirrer. A smaller one will be used, as there are not bigger stirrers in the lab which can fit inside the 2L spherical reactor used. Procedure used in this test was like the one followed in precedents. The selected impeller (number 5 from figure 12) has half of the diameter of the initial one used and has 4 blades instead of two. As we can see, it can be categorized as a propeller, as the type of flow generated will be mostly axial instead of radial. Similar tests about torque and mass accumulation in the reactor walls were made in this case, obtaining that propeller was not powerful enough to efficiently homogenize all biomass. The number of solids retained at the end of reaction was even bigger than in the case of turbine impeller working at lower speed, and yield, obtained with equation 2, was also found to be lower in this experience: 36,9%.. d. Test changing impeller’s position For those tests, impeller used has been the two flat collapsible blades turbine one already described in 5.b.i.2, and speed used has been 200rpm.. 27.
(28) i. TEST 6: The last of parameters tested to optimize actual stirrer was the position of stirrer. All other tests have been made with a distance between the impeller and the bottom of reactor of 3-4cm. It has been considered that impeller should not be lower, because when the distance from the bottom is smaller than 2cm, shovels may hit the walls damaging the vessel. Then, the test was made having a higher position of stirrer, between 5-6cm from the bottom glass. It is easy to appreciate that impeller is now closer to surface of the liquid, and that becomes a problem when speed is switched on and a small whirlwind appears, forcing impeller to sometimes work partially on the air. One possible solution to avoid this problem might be reducing speed to dismount centrifugal forces that cause this fluid shape, but that has the obvious consequence that a lot of solid biomass accumulates in the bottom, not being correctly mixed with the solvent. Mathematically, rotational speed and surface shape can be related by using equation 3, already described during Test 4. As expected, the yield of this reaction was found to be very low (32,5%).. e. Conclusions As said before, all parameters except from stirring have been kept constant during essays, so it is possible to assume that differences between results are mainly caused by agitation effects. Once made all these tests in the lab, analyses show that rotational speed must ideally be over 200rpm. However, it must be lower than 250rpm to assure that stirrer is completely inside the liquid during all process and mechanical system won’t be damaged in a long-term use due to spontaneous vibrations. Considering yield and power consumption, better results are obtained in 230 rpm test, as seen in figure 20.. FIGURE 20- ROTATIONAL SPEED REGARDING TO YIELD AND POWER CONSUMPTION 28.
(29) Regarding to impeller used, two flat blades turbine has proven to be much better than four blades propeller. This is explained because of the type of flux created by each agitator: propeller creates an axial flow which forces biomass to accumulate in the bottom of the reactor, while turbine creates mainly radial flow.. FIGURE 21- AXIAL (A) AND RADIAL (B) FLOWS. Regarding to impeller’s position, 3-4cm from the bottom of reactor has been proved to be the ideal one for two collapsible blades turbine impeller having a diameter of 10cm. As seen, a higher position will cause the waste of power consumption in air agitation instead of fluid’s, and a lower position may damage the vessel walls and won’t let enough space to fluids right movement. This parameter is especially important since part of the reactor content are solids who can easily sediment, so caudal flowing must always be enough to drag particles. Optimal impeller must be able to transfer enough energy to the fluid to create a caudal whose speed is at least the terminal speed of solid particles. Mathematic calculation of this terminal speed in case of lignocellulosic biomass used for wood liquefaction may be quite hard, as particles from raw material may have different shapes and sizes and fluid conditions in all parts of the tank may not be uniform. A short experience only with biomass and solvent has been done to estimate the superior limit of this parameter, as flow speed will get smaller when viscosity increases during progress reaction. During this experience, biomass and solvent were put together in same proportions than used in chemical reaction, mixed in the most homogeneous way possible and then evolution of height suspension was noticed regarding to time. Representing this in a graphic (figure 22), the maximum value for biomass sedimentation speed has been 0,35mm/s, obtained from slope at t=0s.. 29.
(30) FIGURE 22- SEDIMENTATION SPEED So, flow created by impeller inside the reactor, especially near the bottom, must be always over this speed value to avoid biomass accumulation, just as didn’t happened during tests 1, 2, 5 and 6.. 7. Proposing a new agitator Once made several tests using impellers already existing in the laboratory, a new agitator is going to be proposed in order to improve the reaction yield. First, a brief bibliographical research has been made to know which kind of stirrers are already available in the market.. a. Alternatives A huge variety of stirrers are nowadays available in the market. However, not all the stirrers can be used for the same products, as several variables, such as viscosity, size of the tank, etc, may affect this process. To optimise the mixing, it is important to know the main alternatives currently used in industry. On the one hand, a first classification can be done by analysing the origin of the movement, for example, mechanical, magnetic, etc. For high viscosity fluids, mechanical power is usually the best option due to the high resistance of fluids to the gradual deformations produced by shear stresses or tensile stresses. On the other hand, mechanical stirrers are usually classified by the type of flux generated by their blades, and by the shape of the blades themselves.. i. By the type of flux Regarding to the type of flux, there are three basic types of agitators, coinciding to the three basic flux models inside the mixing tank.5. 30.
(31) 1. Axial flow agitators These allow a flow that comes off the impeller blades approximately at 45º and therefore presents recirculation, returning until the central area of the blades in parallel to the axis of rotation. The axial flow agitators include all those who have shovels that form an angle less than 90º with the plane perpendicular to the axis, for example, propellers and turbines of inclined blades. There are two basic ranges of speeds: from 1150 to 1750 rpm with direct transmission, and from 350 to 420 rpm with gear transmission. For the solids suspension it is usual to use the transmission units for gears, while for reactions or rapid dispersions are more appropriate high-speed units.. 2. Radial flow agitators This type of stirrers includes blades parallel to the motor shaft, whose most representatives are agitators of flat shovels. The smallest and multiple blades are called "turbines"; the bigger with two or four blades, are called paddle agitators. These rigid blade agitators are classified according to the quotient value between the area total of the blades and the circle circumscribing the agitator; and the most used ones are those which maximize the flow and minimize its tangential velocity. It is desirable to have higher values of the quotient previously defined for higher viscosities of the fluid, because mixing will be more effective.. 3. Agitators of closed passage In this type of agitators, anchor and helical types are included. Its main feature is that they work very close to the wall and are particularly effective for high viscosity fluids, where it is it is necessary to have the mixing capacity concentrated near the wall, achieving a more effective flow field than with the agitators previously mentioned.. ii. By the shape of the blades: The three main types of impellers are blades, turbines and propellers. While there are other types, the solution will be resolved between 95% and 100% of all agitation problems.. 1. Shovel impellers They are usually shakers of flat blades that rotate on a vertical axis and effectively meet simple agitation problems. Agitators of two and four blades are frequent. Sometimes the blades have 31.
(32) a certain degree of inclination, but most often their position is vertical. The lights rotate at low or moderate speeds in the centre of the pond, driving the liquid radially and tangentially, however, there has been a vertical movement and an exception of the plates to find tilted. The currents that are produced move outwards to the wall of the pond and then upwards or downwards. In high-altitude ponds several blades are installed, one on top of the other, on the same axis. The blade agitators usually rotate at speeds between approximately 20 and 150 rpm. The total length of a blade impeller comprises between 50 and 80% of the inner diameter of the pond and the width of the palates of 1/6 to 1/10 of its length. At very low speeds, the stirrers of the blades produce a very gentle agitation in tanks without baffle plates. For the highest speeds, these are the needs of high-speed vehicle networks, but with little mixing. Not only free shovel mixers are included in this category, but also anchor and gate blades, whose characteristics sometimes may be a bit different due of the shape of the impeller.. 2. Propeller impellers The flow of a propeller impeller is axial, works at high speeds and is used for low viscosity liquids. The small propellers can rotate using direct transmission at a speed that varies between 1150 and 1750 rpm; the large propellers can rotate between 400 and 800 rpm. Flow currents leaving the impeller continue through the liquid in a certain direction until they collide with the bottom or walls of the pond. The column of axial fluid that produces is highly turbulent, generating vortices of liquid that leave the impeller, dragging the stagnant liquid. The plates of this impeller cut the liquid, due to the persistence of the flow currents, being very effective in large ponds. They are mainly used to homogenize, suspend fluids and promote heat exchange.. 3. Turbine impellers This impeller is generally composed of numerous short blades, which rotate medium and high speeds on an axis mounted centrally in the pond. Average speeds of 100 to 300 rpm and elevated speeds of 300 to 1000 rpm are considered. The plates can be straight or curved, inclined or vertical, and the impeller can be open, semi-closed or closed. The diameter can vary between 30 and 50% of the diameter of the pond. The turbine ones are effective for a wide range of viscosities, depending on the chosen configuration. In low viscosity liquids turbine impellers generate strong currents that are distributed throughout the pond, destroying pockets of stagnant fluid. An area of fast currents, high turbulence and an intense cutting effort occur near the impeller. The main currents are radial and tangential. The tangential 32.
(33) components induce the formation of vortices and eddies, which can be avoided using baffle plates or through a diffuser ring to make agitation more efficient.. FIGURE 23- SOME EXAMPLES OF DIFFERENT TYPES OF BLADE AGITATORS. b. Type selection. As seen, one of the main problems is the accumulation of biomass in the walls and bottom of reactor, so after some research an anchor blade stirrer has been proposed to optimize the mixing. To take this decision, main parameters considered have been: -. Properties of the fluid, specially its viscosity (10-100Poise, in normal conditions).. -. Speed used during tests made in the lab (optimal speed around 230rpm).. -. Characteristics of the reactor where stirrer will be placed, especially its shape and volume due to the biomass accumulation.. The main graphic consulted is represented in figure 24:. 33.
(34) FIGURE 24- RELATION BETWEEN FLUID VISCOSITY , TANK VOLUME AND ITS SUITABLE TYPE OF AGITATOR6. c. Comparison between actual impeller and proposed impeller: i. Main characteristics In figure 25 main characteristics of anchor blade stirrers as proposed one are described: Description. two curved arms that reach the wall, adapting to the container shape. Type of flow. Tangential. Regime. Laminar/Transition. Angular speed. Until 300rpm. Viscosity of the medium. until 1000Pa·s. Runner position (d2/d1). 0,9- 0,95. Applications. It favours heat exchange and decreases the boundary layer, avoiding particle accumulation in container walls. FIGURE 25- GENERAL CHARACTERISTICS OF ANCHOR BLADE STIRRERS In figure 26 main characteristics of flat blade turbine impellers such as the one used in laboratory experiences are described:. 34.
(35) Description. two collapsible flat blades. Type of flow. Radial flow. Regime. Transition/Turbulent. Angular speed. Until 400rpm. Viscosity of the medium. until 100Pa·s. Runner position (d2/d1). 0,3- 0,6. Applications. It favours dispersions and emulsion mixing, especially when working at higher speeds.. FIGURE 26- MAIN PROPERTIES OF COLLAPSING FLAT BLADES IMPELLERS. As seen, usually anchor blade stirrers work at similar or lower speeds than impeller currently used for tests in the lab. Its shape, adapted to container’s, avoid solids accumulation on the walls in a mechanical way, so it is not compulsory that the flow created by impeller reaches higher speed than limit sedimentation one. The continuous elimination of solids in the reactor walls also stimulates the heat exchange, which is important in case of jacketed vessels. Also, anchor stirrers work better in higher viscosity mediums, especially when referring to big volumes where paddles aren’t able to transfer all energy due to the fluid resistance to flow.. ii. Basic simulation of flows in the reactor by computer Before buying anything, some basic tests were made by using CFD software to simulate and compare actual stirrer with the proposed one.. 1. Software used To do basic simulation about the system proposed, the Computer Fluid Dynamics (CFD) software used was SimFlow, as it is one of the most powerful and free license softwares available nowadays on the internet. It combines an intuitive graphical user interface with the advantages of the open-source OpenFOAM® libraries. With SimFlow it is possible to create and import the mesh, define boundary conditions, parameterize the case, run the simulation and post-process results with ParaView. As a comprehensive numerical tool, SimFlow offers functionalities to handle such phenomena as compressible and incompressible fluid flows, turbulent flows, heat transfer, multiphase flows,. 35.
(36) cavitation, chemical reactions, etc. All these processes can be modelled in both stationary and rotating reference frames or by using dynamic mesh. After simulation made with SimFlow, results were treated and visualized by using ParaView software, which is another open-source, multi-platform data analysis and visualization application.. 1. Calculation method The calculation method used in simulations is called finite volumes one. It consists on discretizing and solving numerically differential equations, and it is the most used calculation method to solve complex problems related to fluid mechanics, although it can also be used to solve other types of problems. In the calculation by finite volumes the domain or system to be calculated is subdivided into small control volumes and the variables are stored in the nodes, which can be placed in the vertices of the volumes or in the centre. The set of control volumes and nodes form a mesh, which is the result of simplifying a complex system in a set of simpler ones. To solve a problem by finite volumes calculation method, the basic steps to follow are the following ones: 1- The system is decomposed into control volumes. 2- The integral conservation equations are formulated for each volume, and integrals are approximated numerically. 3- Values of variables are approximated by using the information contained in nodes. 4- The algebraic system obtained is assembled and solved.. 2. Main equations of fluid mechanics The simulation program uses a series of fluid mechanics equations to solve the system. These equations are the continuity equation (4): d + ( v ) . dt. 0. (4). the equation of moments (5): d ( v) + ( v v) . dt. 36. − P + f + v .. (5).
(37) and the equations for energy conservation applied to turbulent flow, which in this case follow the k-epsilon model 7 and can be described as the kinetics energy (k) equation (6): d ( k ) + ( k V) . dt. . t + k + G − . . k . (6). and the equation of turbulence dissipation velocity (ε) (7): d ( ) + ( V) . dt. . t + + ( C1 G − C2 ) . . k. (7). Where G is energy generation rate, v represents liquid speed, V its volume, ρ its density, µ its viscosity and µt its turbulent viscosity, which can be obtained from equation 8 where Cµ is a known constant, valued 0.09: 2. t. k C . (8). Also σk, σε, C1 and C2 are known constants, and its value is 1, 1.3, 1.44 and 1.92 respectively.. 3. Geometry All geometries used for simulation were designed by using SolidWorks software, which is a solid modelling computer-aided design (CAD) and computer-aided engineering (CAE) program published by Dassault Systemes for Microsoft Windows.. 1. Tank As reactor used in pilot plant is cylindrical, simulations have been made using cylindric geometry instead of spherical one. The geometry used for vessel during simulation is based on the real geometry of the 5m3 reactor, but some assumptions have been made to simplify the modelling: -. Rugosity has not been considered, so in the model tank and impellers surface is completely uniform.. -. All inner elements of reactor (e.g. thermocouples) except from oil serpentine have been eliminated to have a clearer idea of how impeller affect flow lines.. Basic geometry of the vessel used during simulation is described in figure 27: 37.
(38) FIGURE 27- 3D VIEWS OF REACTOR USED FOR SIMULATION Detailed description of 3D reactor used for simulation can be found in Annexe2.. 2. b. Impellers Regarding to impellers, main simplifications have been: -. Flat blade impeller has considered to not be collapsible but rigid to simplify modelling.. -. As said, rugosity has not been considered, so in the model tank and impellers surface is completely uniform.. Regarding to actual impeller currently being used in the lab experiences, it has been scaled up to adapt size to a 5m3 vessel. The similarity criteria used has been the geometrical one, and to place the stirrer inside the tank several bibliographies8 have been consulted obtaining these relations (9, 10, 11): Z DA. 1 (9). W. 1. DA. 5. (10). DA. 1. DT. 3. (11). Where Z is the distance between agitator and the bottom of the reactor, DA the impeller diameter, W the width blades and DT the tank diameter. Two flat blades impeller used during simulation is described in figure 28:. 38.
(39) FIGURE 28- 3D VIEWS OF ACTUAL IMPELLER USED FOR SIMULATION. The basic geometry of anchor blade impeller designed for simulation has been obtained from generic equations from bibliography8 ((12, 13, 14, 15): (12). (13). (14). (15). Where: Z: distance between agitator and reactor bottom (m) DA: Diameter of the agitator (m) DT: Diameter of the tank (m) HA: height of the blade (m) H: height of the tank (m) WA: width of the blade (m). FIGURE 29- BASIC GEOMETRY OF REACTOR AND AGITATOR. However, we must consider that, to assure that heat transfer is enough during the reaction, an oil serpentine will be installed also inside the reactor. Also, there is a nitrogen flow used to assure inert atmosphere during reaction, and we need to know that, due to previous experiences with turbine impellers, bottom of reactor is not flat. That means that, even if 39.
(40) design equations proposed by bibliography are still valid, they must be adapted to fit with real configuration of the reactor, described in figure 30.. FIGURE 30- REAL CONFIGURATION OF REACTOR AND AGITATOR. As we can see, the main change regarding to basic configuration has been adapting the lower part of stirrer to make it closer to the reactor walls. Reinforces such as crossed arms weren’t considered in this anchor to be necessary because of the lack of free space inside of the vessel. This is caused by the oil serpentine system, whose configuration can also work as deflectors helping to spread the flux inside the reactor. Also, including more mechanical reinforces in the basic structure may require more power to carry on efficiently this kind of agitation. Applying these equations (12, 13, 14, 15) to our reactor, we obtain: HA = 1.668m . DA = 1.668m . W A = 0.185m . The final anchor blade stirrer used for simulations is described in figure 31:. 40. Z = 0.185m.
(41) FIGURE 31- 3D VIEW OF ANCHOR STIRRER USED FOR SIMULATION. Detailed description of impellers used for simulation can be found in Annexes 3 and 4.. iii. Boundaries and mesh definition. To do both simulations, a dynamic mesh has been used. Every node is allowed to move during the simulation, and that is why this kind of mesh is usually used to simulate flows around moving objects, such as impellers in mixing tanks. Free SimFlow license limits number of mesh nodes to 100000, so very complex simulations cannot be performed in this interface. In this case, mesh defined is cylindrical and it is composed by 15 radial divisions, 15 axial divisions and 15 circumferential divisions, just as seen in figures 32.. FIGURE 32- MESHES USED FOR SIMULATION. 41.
(42) External boundaries of the mesh have been fixed as walls, which means zero gradient pressure, zero speed, and turbulent wall functions. After creating the mesh was necessary to split baffles to make sure that nodes were completely independent for each mesh face, and an arbitrary interface was fixed between them.. iv. Simulation: In order to compare both impellers, simulation has been made using same tank geometry and same fluid characteristics. Number of mesh nodes has also been fixed equally, but each case’s shape is adapted to impeller’s one. Also, rotational speed selected in both cases has been the optimal selected from laboratory experiences: ±230rpm (25rad/s). The solver chosen is called “InterDyMFoam”, which is a transient, incompressible, multiphase solver from OpenFOAM® library. A representative mixing time of 10s using a variable integration time step whose maximum is fixed in 0.01s has been chosen to see how main considered parameters are affected by agitation. Some other parameters defined before starting the simulation were the maximal Courant number and the initial liquid fraction, who were respectively set as 0.5 and 1. After simulation, results were treated with ParaView software, which is an open-source, multi-platform data analysis and visualization application.. Several parameters were studied during simulations. A brief comparison between results obtained with each impeller is going to be made focusing on these parameters.. 1. Streamlines: Streamlines are a family of curves that are instantaneously tangent to the velocity vector of the flow. These show the direction in which a massless fluid element will travel at any point in time. In figure 33 is described the evolution of streamlines for two flat blades impeller (actual one), while figure 34 represents the evolution of streamlines for anchor blade impeller. Background colour in the tank represents gradient pressure: red where pressure is higher and blue where it is lower.. 42.
(43) FIGURE 33- EVOLUTION OF STREAMLINES FOR TWO FLAT BLADES STIRRER. FIGURE 34- EVOLUTION OF STREAMLINES FOR ANCHOR BLADE STIRRER. Streamlines obtained with two flat blades impeller (actual one) are initially retained in the closest region of the impeller’s shaft. When particles go through the “rotating zone” limited by the serpentines, they mainly follow a nearly linear trajectory in parallel to the reactor walls. We can also appreciate the vortex created around the shaft near the surface, just as checked during lab experiences, but higher speeds are located near the blades. Regarding to anchor blade simulation, we can appreciate that flow is chaotical than in two flat blades impeller. Streamlines do not follow a clear trajectory but is easy to appreciate how vortex are forming in the bottom of the reactor, according to the anchor’s shape. Moreover, if we compare streamlines from same time simulations seen from the upper side of the reactor, it is possible to appreciate how impellers shape influences mixing. Reactor has been hidden in this view to clarify this effect.. 43.
(44) FIGURE 35-STREAMLINES UPPER VIEW FROM BOTH IMPELLERS As described on the pictures, in two flat blade impeller (left) most of streamlines are rotating around the impeller’s shaft. This may imply that particles are slicing one next to each other, so mixing in this case is presumed to not be optimal. However, in anchor blade impeller (right) the effect of blades on the fluid is bigger, as clearer regions indicate that speed increases in the tank zone closer to the walls, it is said, the region where the anchor blade is working. This assures avoiding the accumulation of solids in the reactor walls, as flow created seems to be enough to drag particles. Dragging solid particles to avoid its sedimentation is very important in order to obtain an optimal mixing, and consequently, a maximized reaction yield. As the limit velocity for biomass sedimentation has already been obtained during lab experiences (described in 6.e), it is easy to know if speed in critical regions of reactor such as bottom and walls will be enough to avoid solids accumulation. In this case, limit values from the lower and farther zone of reactor (the most critical point) obtained during simulation were 0,6mm/s for the two flat blades impeller and 9mm/s for the anchor blade impeller. So, according to this, flow should be enough to drag solid particles in both cases, as experimental biomass sedimentation speed had been found to be 0,35mm/s. These average speeds in those regions have been used to quantify turbulence by using the Reynolds number, which is the ratio of inertial forces to viscous forces within a fluid which is subjected to relative internal movement due to different fluid velocities. At low Reynolds numbers, flows tend to be laminar, while at high Reynolds numbers turbulence results from big differences in the fluid's speed and direction. It is used to predict the transition from. 44.
(45) laminar to turbulent flow and in the scaling of similar but different-sized flow situations. Mathematically, it is calculated as: Re. v D. (16). . Where: ρ: density of the fluid (kg/m3). v: speed (m/s). µ: viscosity of the fluid (Pa·s). D: diameter of tank (m). As in this case all parameters except from impellers have always kept the same during simulations, differences in Reynolds can only be caused by their influence. So, using these average flow speeds in the critical region of reactor, we obtain: Reanchor. Reflatblades 15. Which is the same that saying that anchor blade stirrer creates around 15 times more turbulence, and, consequently, flow is 15 times more mixed in this critical region than when using two flat blades impeller.. 2. Vorticity Vorticity is considered an important parameter to quantify rotation during mixing. It can be obtained from velocity vector and it represents some regions in a flow where you have some shear. In real fluids as the one used for wood liquefaction, this shear is usually very related to tangential efforts. As streamlines evolve during simulation, is logical to deduce that vorticity will also change. Following figures describe this evolution for both impeller experiences:. FIGURE 36- EVOLUTION OF VORTICITY LINES WITH A TWO FLAT BLADES IMPELLER. 45.
(46) FIGURE 37- EVOLUTION OF VORTICITY LINES WITH AN ANCHOR BLADE IMPELLER As seen, the two flat blades impeller creates rotation mainly around the impeller blades. Nevertheless, in the anchor blade impeller flow is created around the shaft, involving all the content of the tank. This difference can be appreciated in detail in figure 38 where, where vorticity vector in two flat blades impeller’s shaft keeps parallel, mainly creating the whirlwind near the surface, but in anchor blade impeller it doesn’t.. FIGURE 38- COMPARISON OF VORTICITY VECTORS IN BOTH SHAFTS. 3. Power consumption Power consumption can be obtained from a theorical point of view, applying adimensional power number obtained from graphics consulted in bibliography, or from a practical point of view, that is, from simulation results. Same as in case of forces, both results have been obtained to assure its reliability.. 46.
(47) Simulation made with SimFlow permits obtaining evolution of torques regarding to time. Once obtained the stationary, values have been averaged to obtain moment modules. Then, applying equation 1 already described and considering rotational speed N as constant, the relation between power consumption for both impellers have been obtained: T. Panchor. P N. (1). 7.8Pflatblades. Regarding to theorical way of obtaining power consumption, it is important to previously define two adimensional numbers which are going to be used for. One of them is Reynolds, whose main characteristics were already described while quantifying turbulence. In this case, Reynolds will be applied to agitation, and can be mathematically described as (17):. Re. N DA. 2. . (17). Where: ρ: density of the fluid (kg/m3). N: rotational speed (rps). µ: viscosity of the fluid, (10Pa·s). DA: diameter of agitator (m). The other adimensional number is Power number, which relates the impeller power consumption (P, in W) with other operational variables. It describes the impeller's necessary effort to counteract friction generated between the fluid in motion and the walls and bottom of the tank, including the resistance produced by the deflectors, and its mathematically expressed by (18): P. Np. 3. 5. N DA . (18). Once known the Reynolds, Power number can be obtained from graphics from bibliography 9, such as the following one, in which red line identifies anchor blade searching and yellow line identifies two flat blades one:. 47.
(48) FIGURE 39- POWER NUMBER VS . REYNOLDS NUMBER9. Then, applying power number definition is possible to know power consumption for both cases, and dividing one between the other, its relation has been: Panchor. 8.09 Pflatblades. The relative error between simulation and theoretical calculation is about 3,6%, which can easily be assumed by lack of precision of results while reading from graphics. Also, simulations verified that torque, and consequently, power consumption, increases when increasing rotational speed, just as expected.. d. Conclusions Once made both simulations, comparison between streamlines showed that anchor blade stirrer is around 15 times more efficient creating turbulences in the flow than two flat blade stirrer, which is the one currently used for lab experiences. As seen, the flat blades impeller is not able to mix efficiently all the fluid, because vortex are only created in the closest part to shovels. It favorices the slicing between fluid layers, as in some parts of the vessel streamlines are completely parallel one to each others.. 48.
(49) One possible solution may be using a double two flat blades stirrer, installing another flat blades impeller on the same shaft but in a higher position. However, currently in the laboratory there are not double impellers to test and previous experiences made in the pilot plant with 6 blades turbines showed that result was not as good as expected.2. Also it was observed that fluid current created through the critical zones of the reactor (bottom and walls) is more powerful when using the anchor blade impeller than the two flat blades one, so it will better avoid biomass accumulation on this regions. It has been proved by comparing with the experimental limit sedimentation velocity that, in both cases, average fluid in the lower part of reactor may be enaugh powerful to drag all particles. However, due to fluid movement inside the tank monitorised during simulation, anchor blade stirrer has been considered to get a better homogenization, as average speed in the lower part of the vessel is bigger and more uniform than when using actual impeller.. Regarding to power consumption, it was found that anchor blade stirrer uses around 8 times more energy than the two flat blades one when both are working on the same operational conditions (same fluid and rotational speed fixed). This is caused by the bigger rotating zone created by this type of impeller, which consequently generates a bigger torque because it mixes a bigger amount of fluid at the same time. This movement of fluid has already been quantified by Reynolds number in critical regions and, as said before, was 15 times bigger for an anchor blade stirring than for a two flat blades one.. To sum up, as yield reaction is directly related to mixing inside the tank and is quantified by using the solid residue obtained at the end of liquefaction, it has been considered that, at equal reaction conditions, anchor blade stirrer will minimize solids accumulation by increasing the contact between reactants. Knowing that efficiency in the reactor relates yield and consequently, mixing capacity and turbulence quantified by Reynolds number, to power consumption, we can conclude that an anchor blade impeller proposed is around 15/8 = 1.87 times better than two flat blades impeller currently used during lab tests.. 49.
(50) An anchor blade impeller was asked to be bought in order to do some tests in the laboratory to verify this simulation and all the hipotesis proposed, but, unfortunately, it hasn’t been possible due to the lack of materials available by the end of this project.. 8. General conclusions and future perspectives The aim of this project has been optimizing the agitation of a reactor used for wood liquefaction, whose main problems were the high viscosity of products obtained during reaction and the accumulation of solid biomass in the bottom and wall of the vessel. As pilot plant located in Patalha wasn’t operating by this moment, some tests were done in the lab using the facilities currently available there. The conclusions obtained from these tests showed that speed, shape and position of the stirrer were the main parameters to consider during optimization. Also, torque was monitored during the reaction, in order to know power consumption during tests. As expected, this value increases when speed does in a linear way. Regarding to yield reaction, maximum was found in the maximal speed that allows impeller to be completely submerged in liquid. If speed keeps increasing, vortex created by centrifugal forces makes power loss because stirrer works partially on the air. Better shape impeller between all those available in the laboratory was found to be the two flat blades impeller one, because the flow created is mainly axial instead of radial as the propeller does. The best results for reactions made in a 2L spherical reactor were achieved working at around 230rpm and 3-4cm of distance from the bottom of vessel, using the two flat blades impeller whose diameter was about 10cm. It was also found that, to avoid biomass sedimentation in the walls and lower part of reactor, the flow speed necessary to drag solid particles must be always bigger than 0.35mm/s.. However, results obtained from this first optimization with facilities currently available weren’t as well as expected, so a new agitator was decided to be proposed to minimize these remaining problems. After a brief review of the types of agitators currently available in the market and the comparison between its general characteristics, an anchor blade stirrer was selected for optimising the mixing in the wood liquefaction tank. To verify the suitability of this selection, some elements were modelled in 3D to perform a CFD simulation in which the. 50.
Figure
Documento similar
In that case, the adjustment can be done in terms of power consumption, by measuring both chip input current and sensor output frequency during the normal operation of a
In addition, it also provides insights of an extra-benefit to the end user that has not been previously studied, the increased energy efficiency at the terminal that can be achieved
In this paper, we have conducted a thorough measurement analysis of the power consumption of 802.11 devices that, in contrast to previous works, provides a detailed anatomy of
The expansionary monetary policy measures have had a negative impact on net interest margins both via the reduction in interest rates and –less powerfully- the flattening of the
Jointly estimate this entry game with several outcome equations (fees/rates, credit limits) for bank accounts, credit cards and lines of credit. Use simulation methods to
In our sample, 2890 deals were issued by less reputable underwriters (i.e. a weighted syndication underwriting reputation share below the share of the 7 th largest underwriter
We can conclude that decompression of the median nerve in the carpal tunnel consistently and immediately improves the quality of sleep and daytime performance related to lack of
However, the comparison of the effects triggered by the administration of an active and an inactive form of MMP-9 led to conclude that the response observed in the bovine
