Has the reduction of employment been efficient in the restructuring of Banks in Europe? : an insight into the overbranched sector in Spain / Isabel Lázaro Aguilera and Ricardo Palomo Zurdo
19
0
0
Texto completo
(2) 218. I. LÁZARO-AGUILERA AND R. PALOMO-ZURDO. Figure 1. Number of monetary financial institutions in the Euro-area. Source: European Central Bank (2014).. The second wave of the financial crisis occurred in Europe (just after Lehman Brothers’ failure) and led to a slump because of the loss of trust and negative perspectives among the financial players and companies. In this context, some researchers have proven that the probability of crisis should be higher in banking sectors where the concentration ratio was smaller as happened in 2008 in southern and central European countries. European retail banks have been clearly oversized (Figure 2) for decades as a result of the strong increase in the number of offices (Figure 3). In periods of economic crisis, banks generally tend to reduce the number of employees through staff restructuring processes. Spain and other European nations have. Figure 2. Comparative size of banking in European main countries. Source: Cecabank and European Central Bank (2014)..
(3) JOURNAL OF TRANSNATIONAL MANAGEMENT. 219. Figure 3. Employees and branches in European banking sector. Source: Compiled by the authors from European Central Bank (2014).. faced similar situations of restructuring during the crisis, and there were several similar approaches to the problem. This study focuses specifically on the layoffs as one of the different staff restructuring processes often due to concentration strategies conducted to decrease fragmentation and curtail entities and branches trying to enhance their efficiency, thus reducing the number of employees (downsizing strategy; Figure 4). In scientific literature about downsizing, much research has centered on explaining the background of this strategy in firms that were experiencing a crisis situation (Ahmadjian & Robinson, 2001; Budros, 1997, 2000, 2002; Dahl & Nesheim, 2010; DeWitt, 1998; Filatotchev, Buck, & Zhukov, 2000; Love & Nohria, 2005), but progressively, there have been cases of firms enjoying good financial returns that have also been inclined to implement these strategies. Although these practices have become more widespread on a world level in these large firms (Ahmadjian & Robinson, 2001; Bruton, Keels, & Shook, 1996; Cameron, Freeman, & Mishra, 1993; Cascio, 1993; Cascio & Young, 2003; Hillier, Marshall, McColgan, & Werema, 2007; DeWitt, 1993; Filatotchev et al., 2000; Hitt, Hoskisson, & Ireland, 1994; Markides, 1995; Mentzer, 1996; Morris, Cascio, & Young, 2000; Pfeifer, 2007) and they have also been frequently adopted by the largest Spanish firms (Casillas & Barroso, 1998; Claver & Fernández, 2006; Fernández, 2006; Maldonado, Suárez, & Vicente,.
(4) 220. Figure 4.. I. LÁZARO-AGUILERA AND R. PALOMO-ZURDO. Branches and employees in Spain.. 2009; Requejo, 1996; Sanchez & Suarez, 2005; Suarez, 1999; Vicente & Suarez, 2007), there are still many questions about this matter as it has not been possible to verify effectively whether the effects of these techniques are those initially sought, as shown in Table 1. The contribution to scientific knowledge intended with this study consists in analyzing the impact of personnel reduction in the context of the process of concentration of listed banks with data that will enable analysis of both the period prior to the crisis and the period of the crisis itself. This study comprises four sections, including this introductory section. The second section discusses the general magnitude of the process of restructuring in Europe. The third section focuses on the Spanish banking sector as the research case, analyzing the impact of the restructuring undertaken in the sector on employment through an empirical analysis of the subsector of listed banks. The final section gives the general conclusion of the study. Restructuring and downsizing: An overview of the European banking sector Imbalances accumulated in the European banking sector during the economic expansion that preceded the outbreak of the crisis. As a result of the explosion.
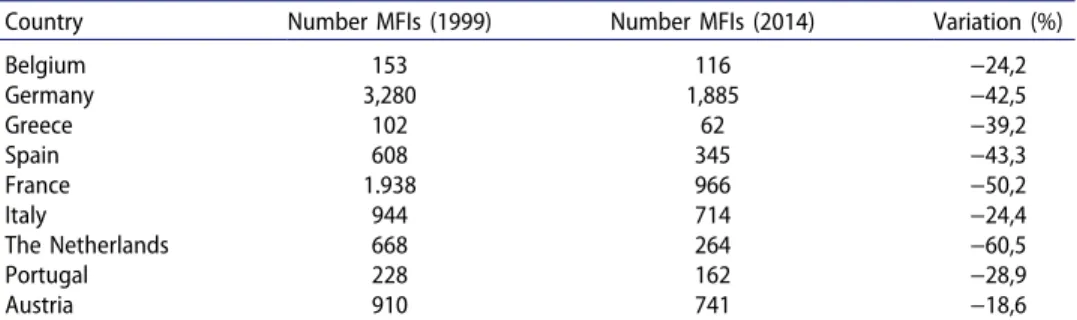
(5) JOURNAL OF TRANSNATIONAL MANAGEMENT. Table 1.. 221. Literature on effects of restructuring processes in firms. Methodology, sample, and time. Study. Worrell, Davidson, 194 announcements & Sharma (1991) of redundancies by USA firms 1979–1987 case analysis Iqbal & Shetty 187 announcements of (1995) redundancies by USA firms 1986–1989. Case and regression analysis Davidson, Worrell, 51 announcements of & Fox (1996) early retirement. 1982–1992. Study of cases Bruton, Keels, 100 Fortune 500. & Shook (1996) 1985–1987. Regression and qualitative analysis Cascio, Young, & Morris (1997) Lee (1997). Wayhan & Werner (2000). Standard & Poor’s 500. 1980–1994. Regression analysis 300 announcements of redundancies in USA and 73 in Japan. 1990–1994. Study of cases 250 large USA firms in 1992. Regression analysis and analysis of data panel. Measure of performance. Downsizing measures. Main effect. Announcements of redundancies by firms. Reaction of the stock market. Negative. Announcements of redundancies by firms. Reaction of the stock market. Negative. Announcements of redundancies by firms. Reaction of the stock market. Positive. Reduction of employment by 3% or more between 1985 and 1987 Announcements of redundancies. ROA. Positive. ROA and reaction of the stock market. No effect. Announcements of redundancies by firms. Reaction of the stock market. No effect. Reduction of employment. Growth in sales and capitalisation of the market 1989–1996. Positive. Source: Compiled by the authors.. of the “sovereign debt crisis” (in the spring of 2010), confidence in the system deteriorated from the rest of the economic agents and increased difficulties in obtaining financing in international markets. Thus, it has been necessary for public authorities to adopt a series of measures with the aim of intense restructuring to streamline the structure of banking institutions and improve their efficiency to adapt to the new national and international environment that emerged after the financial crisis (Table 2). Table 2.. Number of monetary financial institutions (main countries Euro-area).. Country Belgium Germany Greece Spain France Italy The Netherlands Portugal Austria. Number MFIs (1999). Number MFIs (2014). Variation (%). 153 3,280 102 608 1.938 944 668 228 910. 116 1,885 62 345 966 714 264 162 741. −24,2 −42,5 −39,2 −43,3 −50,2 −24,4 −60,5 −28,9 −18,6. Source: Compiled by the authors, documented from European Central Bank..
(6) 222. I. LÁZARO-AGUILERA AND R. PALOMO-ZURDO. Moreover, the banking sector has to face the confluence of very relevant regulatory changes, such as the Basel III Rules that affect their business model and other very diverse changes, such as the resolution mechanisms for banks in difficulties, stress tests, and so forth. These changes have also affected the lending capacity of the banks, causing repercussions on the real economy, and a contraction of sector size with clear consequences for employment in this sector. A bank restructuring is usually accompanied by a workforce restructuring, which may also involve a change in the structure of the bank, caused by both national and international economic circumstances and internal circumstances (Arboledas, Hortal, & De Enterría Pérez, 2002). Among the former, caused by circumstances beyond the control of the sector, are the downturn of the country’s economy, though also the development of new information and communication technologies, the struggle against the competition and the existence of more and more demanding and disloyal users of bank services. Among the latter, caused by internal circumstances of the banks themselves, there might be an inadequate organizational structure (oversizing of the staff, lack of flexibility and training of personnel, or duplication of functions and work positions). In consideration of this view, an adaptation of the firm size in the interest of efficiency is envisaged (Homma, Tsutsui, & Uchida, 2014).Restructuring the workforce is a major concern due to its consequences, both internal and external, as well as posing one of the biggest challenges for employers (Marr & García, 1997). From another viewpoint, there have also been some cases of redefining the business model based on a more conservative, conventional model (García-Montalvo, 2014). It must be emphasized that the financial crisis has caused great change for the savings banks in Europe, whose market share was huge in some countries, especially in Germany and in Spain. Savings banks were also outstanding in France until 1999 when French savings banks decided to convert to cooperative banks due to the success of this type of institution in this country. In January 2014 there were 6,790 Monetary Financial Institutions (MFIs)1 in the Euro-area, and despite the enlargement of the Euro area with the accession of Greece (2001), Slovenia (2007), Cyprus and Malta (2008), Slovakia (2009), Estonia (2011), and Latvia (2013), the number of institutions decreased by 31% since January 1999. In the whole European Union (formed by Euro-area plus the incorporation of 10 new members in 2004, Romania and Bulgaria in 2007, and Croatia in 2013) figures decreased, despite those enlargements, from 10,909 to 8,746 institutions. The Netherlands, France, Spain, and Germany recorded the largest decrease. Pronounced declines over that period were also noticeable in Italy and Portugal. Although some mergers and integrations have been undertaken in the banking subsector (without the need for bailout or intervention), in the case.
(7) JOURNAL OF TRANSNATIONAL MANAGEMENT. 223. of the Spanish savings banks (which represented a market share of 50% of the banking sector), the 45 existing banks were reduced to just 11 banks within three years (Bank of Spain, 2014), primarily by absorptions or by forming Institutional Protection Schemes (IPS).2 Only two saving banks remained, the smallest in the subsector.3 In the case of European cooperative banks (credit unions), IPS has also featured in some of the main consolidation processes. The data gathered in the following figures shows and compares the situation and evolution of the number of branches and employees in the European banking sector. The United Kingdom is the outstanding banking sector in the European Union (not included in the Euro-area), followed by Germany, France, and Spain. Austria, Germany, and Ireland reach the highest number of employees per inhabitants, but Spain leads the ranking in number of branches per inhabitants. The restructuring, which has completely changed the European banking map, particularly that of the savings banks, was undertaken through mergers and acquisitions, although one of the widely used formulas was the Institutional Protection Schemes (IPS), whereby those involved maintained their own identity and operational capacity on the commercial front as well as their economic autonomy, but pooling to a large extent their solvency and business results (Palomo, Sanchis, & Gutierrez, 2011). In the banking subsector, the financial crisis has given rise to some concentration operations in which all kinds of banks were involved, some of which became new institutions deriving from the earlier savings banks. Most of the imbalances occurred in savings banks, deriving from the credit expansion, which they recorded in the period prior to the crisis (Gutiérrez, Palomo, & Romero, 2012). There was an excess of capacity and a high exposure to the real estate sectors that ended in a sharp elevation of the default rate.4 Several studies (Gutiérrez et al., 2012; Palomo et al., 2011) indicate that the integration processes imposed on the saving banks sector do not address the question of uniformity in the business model of the savings banks comprising same, as would have been desirable and recommended by the regulations and the supervisor. Rather, the restructuring of the sector was guided by other criteria (personal, political, and administrative considerations, market and analyst evaluations, and even the very inclination of the supervisor). All this has directly affected employment in the sector due to its downsizing. Consequently, the savings banks undertook the largest banking consolidation transacted in several countries, but mainly in Spain, (European Association of Co-operative Banks,5 2010) which, to date, has given rise to three pure mergers and three by absorption, three integrations by the IPS scheme (one of which—Bankia—was nationalized), two banks untouched and one intervened.
(8) 224. I. LÁZARO-AGUILERA AND R. PALOMO-ZURDO. in August 2011, the Caja de Ahorros del Mediterráneo (CAM), ultimately integrated into the Banco Sabadell.6 All in all, the number of savings banks was reduced from the 45 existing in December 2009 to 13 cajas or bank groups in 2012. The social effects of this restructuring should be pointed out due to the social work undertaken by these banks (Carnero, Nuez, & Barroso, 2010), one of their traditional hallmarks if they were savings banks or credit unions (Chaves & Soler, 2005). An important element, though also controversial, was the cost of restructuring a part of the sector. For instance, according to sources from the Bank of Spain, the financial aid to recapitalize the sector amounted to 61.336 billion euros even though total public funds allocated to the restructuring amounted to 107.913 billion euros7 on adding the Fund for Orderly Bank Restructuring (FROB) funds, the Guarantee and Deposit Fund and that of the Bank of Spain. We would point out that the “good” banking sector paid 7.5572 billion euros, primarily in contributions to the Spanish Guarantee and Deposit Fund (FGD) and the Spanish Management Institution of assets deriving from bank restructuring (SAREB). More precisely, by bank, Banco Santander contributed 4.000 billion euros; Popular, 1.775 billion; Caixabank, 966.2 million; Sabadell, 750 million; and Bankinter, 66 million (Bank of Spain and our compilation). Some banks acquired entities during the crisis: Popular (Banco Pastor), BBVA (Unnim), Sabadell (CAM) and Caixabank (Caixa Girona, Bankpime, Banco de Valencia and Banca Cívica). The downsizing in banking: Analysis and application to the Spanish banking sector According to the data of the Bank of Spain, the number of bank branches marked a historical maximum in 2008 with a total of 46,200 only to be reduced in early 2014 to 33,786, which also corresponds to a maximum number of employees at 278,000 in 2008, which fell to 216,000 in early 2014. The reduction of employment in the sector, around 20,000 persons, resulting from the crisis, was implemented by collective redundancies, early retirements, and external contracting. It must be pointed out that according to the data of the European Central Bank, Spain has the largest density of branches in Europe (7.9 per 10,000 inhabitants) as opposed to the European average of 4.6. With respect to personnel, however, Spain has 49.5 bank employees per 10,000 inhabitants, lower than the European average of 63.1. Table 3, referring to the bank sector, reflects a reduction of 14.29% in the number of entities, with negative figures of around 5% that show a reduction of the commercial network and the number of employees. There is an increase of 38% in resources as opposed to an increase of only 5% in the volume of.
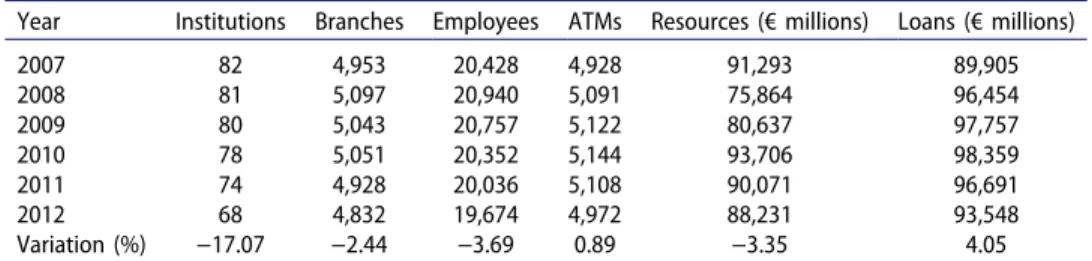
(9) JOURNAL OF TRANSNATIONAL MANAGEMENT. Table 3.. 225. Spanish banking sector (2007–2012).. Year 2007 2008 2009 2010 2011 2012 Variation (%). Institutions. Branches. Employees. ATMs. Resources (€ millions). Loans (€ millions). 70 66 64 64 61 60 −14.29. 15,391 15,441 14,690 14,531 14,112 14,675 −4.65. 110,528 107,771 102,823 101,931 99,125 104,165 −5.76. 20,399 20,450 19,666 19,807 19,237 20,880 2.36. 468,513 531,415 515,405 564,309 575,072 650,491 38.84. 792,061 840,270 836,835 884,263 822,215 832,174 5.06. Source: Compiled by the authors, documented from the Bank of Spain and the sector’s association.. loans, which evidences a clear asymmetry between the evolution of both sides of the balance as well as a sharp contraction of credit. Table 4 corresponds to the savings banks (cajas) sector (as sector of origin since, for operational purposes, only the cajas of Ontinyent and Pollensa have maintained their original legal status). A drastic reduction of 70% occurred in the number of cajas in the sector, accompanied by a 25% reduction in the sector’s commercial network and employees. This figure is accompanied by a sharp reduction in the volume of resources and more so of loans (−25%). Therefore, it can be maintained that practically one quarter of the economic size of the sector of origin of the cajas has been shed with the financial crisis. Table 5 shows a numerical reduction of some 17% in the number of credit cooperatives consequent on the mergers and acquisitions. The commercial network and the number of employees reflect a negative evolution of around. Table 4.. Savings banks sector (2007–2012).. Year 2007 2008 2009 2010 2011 2012 Variation (%). Institutions. Branches. Employees. ATMs. Resources (€ millions). Loans (€ millions). 46 46 46 24 16 14 −69.6. 24,637 25,035 24,252 23,253 20,719 18,409 −25.3. 131,933 134,867 132,340 128,165 115,101 99,670 −24.5. 35,034 35,847 35,013 34,306 31,941 28,905 −17.5. 941,407 993,811 1,027,496 1,016,755 969,018 752,840 −20.0. 854,093 913,743 904,990 882,824 840,830 641,085 −24.9. Source: Compiled by the authors, documented from the Bank of Spain and the sector’s association.. Table 5.. Credit unions/co-operative bank sector (2007–2012).. Year 2007 2008 2009 2010 2011 2012 Variation (%). Institutions. Branches. Employees. ATMs. Resources (€ millions). Loans (€ millions). 82 81 80 78 74 68 −17.07. 4,953 5,097 5,043 5,051 4,928 4,832 −2.44. 20,428 20,940 20,757 20,352 20,036 19,674 −3.69. 4,928 5,091 5,122 5,144 5,108 4,972 0.89. 91,293 75,864 80,637 93,706 90,071 88,231 −3.35. 89,905 96,454 97,757 98,359 96,691 93,548 4.05. Source: Compiled by the authors, documented from the Bank of Spain and the sector’s association..
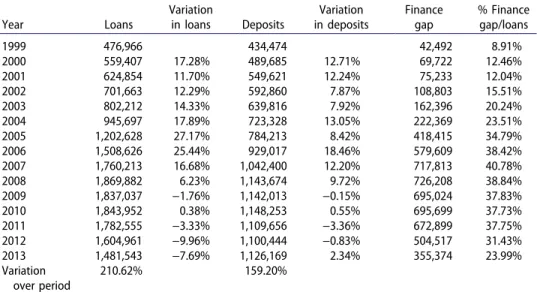
(10) 226. I. LÁZARO-AGUILERA AND R. PALOMO-ZURDO. Table 6. Spanish banking sector: Evolution of loans and deposits and finance gap (1999–2013). Year 1999 2000 2001 2002 2003 2004 2005 2006 2007 2008 2009 2010 2011 2012 2013 Variation over period. Loans 476,966 559,407 624,854 701,663 802,212 945,697 1,202,628 1,508,626 1,760,213 1,869,882 1,837,037 1,843,952 1,782,555 1,604,961 1,481,543 210.62%. Variation in loans 17.28% 11.70% 12.29% 14.33% 17.89% 27.17% 25.44% 16.68% 6.23% −1.76% 0.38% −3.33% −9.96% −7.69%. Deposits 434,474 489,685 549,621 592,860 639,816 723,328 784,213 929,017 1,042,400 1,143,674 1,142,013 1,148,253 1,109,656 1,100,444 1,126,169 159.20%. Variation in deposits 12.71% 12.24% 7.87% 7.92% 13.05% 8.42% 18.46% 12.20% 9.72% −0.15% 0.55% −3.36% −0.83% 2.34%. Finance gap 42,492 69,722 75,233 108,803 162,396 222,369 418,415 579,609 717,813 726,208 695,024 695,699 672,899 504,517 355,374. % Finance gap/loans 8.91% 12.46% 12.04% 15.51% 20.24% 23.51% 34.79% 38.42% 40.78% 38.84% 37.83% 37.73% 37.75% 31.43% 23.99%. Source: Compiled by the authors, documented from the Bank of Spain. Amount in € millions.. 3%, less than in the case of the banks; therefore, it is the sector reflecting less impact from the crisis in regard to these variables. We would point to a reduction in the capture of resources even though, like the banks, a small growth rate occurred in the loans granted. In Table 6, the evolution of the finance gap, that is, the difference between deposits and loans on the balance sheet, is particularly evident. The lowest entry, in percentage terms on loans over the period, is in 1999 (8.91%) and the highest, in 2007 (40.78%), having dropped since then to 23.99% in 2013. Having examined the process of restructuring the banking sector, its size and its importance, an analysis is required on how said changes have affected the employment variable (measured by the number of employees) in order to check the hypothesis of whether the variation in the number of these has had an impact on the efficiency of the sector. To do this, we analyze a time period, in which there are two phases: one of growth and another of a sharp reduction in employment or downsizing. Based on the studies conducted earlier, inter alia, Carnero et al. (2010), De Meuse, Bergmann, Vanderheiden, and Roraff (2004), Huselid (1995), Love and Kraatz (2009), Love and Nohria (2005), Muñoz and Sanchez (2010, 2011), Maldonado et al. (2009), Sheaffer, Carmeli, Steiner-Revivo, and Zionit (2009), Van Dierendonck and Jacobs (2012), and Yu and Park (2006), the indicators or variables that will be used in this study to determine whether a firm that has undergone a process of workforce restructuring has improved its efficiency are established as follows. The study undertaken is based on the conventional accounting indicators used to measure business efficiency or financial performance. These ratios.
(11) JOURNAL OF TRANSNATIONAL MANAGEMENT. 227. are the financial profitability and the economic profitability (Ahmadjian & Robinson, 2001; Bruton et al., 1996; Budros, 1997; Cascio & Young, 2003; Cascio, Young, & Morris, 1997; Coucke, Pennings, & Sleuwaegen, 2007; De Meuse, Bergmann, Vanderheiden, & Roraff, 2004; De Meuse, Vanderheiden, & Bergmann, 1994; Espahbodi, John, & Vasudevan, 2000; Flanagan & O’Shaughnessy, 2005; Guthrie & Datta, 2008; Hillier et al., 2007; Love & Nohria, 2005; Magán & Céspedes, 2007a; Perry & Shivdasani, 2005; Yu & Park, 2006) and the EBITDA (Earnings Before Interest, Taxes, Depreciation, and Amortization; De Meuse et al., 2004; Yoo & Mody, 2000) and the efficiency ratio (Corral, Dominguez, & López, 2011). The next group of indicators comprises two variables that measure organizational performance. These variables are the productivity per employee or average profit achieved by the employee (Ahmadjian & Robinson, 2001; Baumol, Blinder, & Wolff, 2003; Budros, 1997, 2000; Hillier et al., 2007; Yoo & Mody, 2000; Yu & Park, 2006) and the average cost per employee (Baumol et al., 2003; Espahbodi et al., 2000; Yu & Park, 2006). In regard to the sample selected, to conduct our empirical analysis, we have taken the sector of the banks listed on the IBEX 35 at the time of the study. The period selected to conduct the analysis was from 2003 until 2012, both inclusive, for the purpose of having a time range that would enable us to verify the hypotheses in accordance with the double scenario of the economic boom (2003–2007) and the subsequent economic crisis (2008–2012). This range will enable us to examine the effects that said crisis has had on these organizations on having to undergo the workforce restructuring techniques by reducing the number of employees to try to improve their efficiency and handle the rescaling undertaken due to the economic crisis. The quantitative analysis of the data was done with the Stata program. Because the nature of this study is dynamic, the use of panel data was more appropriate as said data contain observations of certain variables for all the firms included in the sample in each of the years comprising the period under study. Moreover, the main advantage of this type of data is that it enables the model to be verified by controlling the existence of unobserved heterogeneity; in other words, it enables us to see the individual effect of all the firm-level characteristics that have not been able to be measured (Magán & Céspedes, 2007a). The econometric model to conduct the empirical analysis was a model of linear regression with panel data (Baumol et al., 2003; Bruton et al., 1996; Budros, 1997; Cascio, Young, & Morris, 1997; Coucke et al., 2007; De Meuse et al., 2004; Espahbodi et al., 2000; Guthrie & Datta, 2008; Huselid, 1995; Love & Kraatz, 2009; Love & Nohria, 2005; Magán & Céspedes, 2007b; McElroy, Morrow, & Rude, 2001; Mellahi & Wilkinson, 2010; Muñoz & Sanchez, 2010, 2011; Maldonado et al., 2009; O’Shaughnessy & Flanagan, 1998; Perry & Shivdasani, 2005; Sheaffer et al. 2009; Suarez, 1999; Suarez & Vicente, 2000; Yoo & Mody, 2000; Yu & Park, 2006), as this type of model was the.
(12) 228. I. LÁZARO-AGUILERA AND R. PALOMO-ZURDO. most appropriate for measuring the causal relationship between a sample of economic agents for a certain time period. In the model used, the dependent variable (Y) corresponds to efficiency measured across the most commonly used variables, such as economic performance, financial performance, EBITDA, the efficiency ratio, productivity per employee and the average cost per employee. The explanatory variables (X) were both the variation in the workforce and the control variable that were added following several authors: the firm size (Budros, 1997; De Meuse et al., 2004; Love & Kraatz, 2009; Love & Nohria, 2005; Magán & Céspedes, 2007b; McElroy et al., 2001; Mellahi & Wilkinson, 2010; Muñoz & Sanchez, 2011; Sheaffer et al., 2009; Suarez, 1999; Suarez & Vicente, 2000; Yu & Park, 2006), measured with the volume of assets, the workforce and the number of branches as well as the firm’s market value. Hence the relationship is established as follows: EFFICIENCYit ¼ ai þ bdplantillait þ c1tama~ noit þ c2valormercadoit 4it This methodology allows us to select between two different methods: the fixed effects model and the random effects model. To ascertain the most appropriate model, we did the Hausman test in order to select between these two models. The results obtained from this test indicated that the best option was the estimate from the random effects model since the significance of the workforce variable was higher when it was conducted using this type of estimate, which means that it was accepting the zero hypothesis and therefore, the model to be used was the random effects model. We made different estimates with several differentiated models. To do this, we used the firm size control variable in each of the forms in which this variable can be measured (workforce, volume of assets and branches) and market value for each of the efficiency measures used. Moreover, having made the correlation matrix of all of the variables that measure the firm size, we observed that the correlations between the three variables were very high, as can be seen in Table 6, which justifies creating a unique variable, firm size, which will comprise the three variables. Subsequently, after examining the results of each of the parameters analyzed by the software, we observed that only three of the variables analyzed showed significance: EBITDA, efficiency ratio and average cost per employee. The other three variables (ROA, ROE, and employee productivity) were ruled out because on making the individual estimate of each of the models in the results obtained, the p-value result obtained from the dependent variable was greater than 5%, indicating no significance between these variables. After we had selected the three independent variables in which a relation was found with the dependent variable, we did the Hausman test with each of the three variables in order to estimate the final model. We obtained the results shown in Table 7 from said model, which enables the proposed model.
(13) JOURNAL OF TRANSNATIONAL MANAGEMENT. Table 7.. 229. Correlation matrix.. Workforce Assets Branches dworkforce. Workforce. Assets. Branches. dworkforce. 1.0000 0.7795 0.9617 −0.2312. 1.0000 0.8242 −0.2302. 1.0000 −0.1827. 1.0000. Source: Compiled by the authors using the stata software.. to be verified, as we can see how the dependent “workforce” model was significant at a coefficient of 10% of the independent EBITDA model. With respect to the efficiency ratio variable, significance was not obtained with the dependent variable. With respect to the significance that was observed in the “workforce” variable in relation to the independent variable measured with the average cost, we can observe that it was significant, recording a level of 5%. With respect to the firm size and market value control variables, the first of these was significant at a level of 1% in relation to the independent EBITDA and average cost of employee variables while the latter control variable, market value, was only significant, at a level of 10%, in relation to the independent efficiency ratio variable. With respect to the r2 correlation coefficient (see Table 8), the results obtained showed that the r2 explained for each of the three independent variables was 85%, 19%, and 61% respectively, which indicated that in the EBITDA variable it could be accepted that there was a good linear correlation; in other words, he EBITDA variable explained 85% of the workforce variation whereas in the second variable, efficiency ratio, the level of correlation obtained was quite low and even zero. With respect to the average cost per employee, we could say that this variable explained that there was a reduction of personnel in the firms, the subject matter of the study, at a reliable level of 61%. In Table 7, the first column shows the dependent variable and subsequently the control variables as well as other information pertaining to the statistical study, whereas the first row of the final model shows the independent variables analyzed that explain the downsizing. The columns headed by the. Table 8.. Results of the model applied.. Variable Variation employees (plantilla) firmsize Market value (valormercado) D1 _cons N R2_o. EBITDA F. Efficiency F. CostmedF. 205.81295* 1113026.7*** 8495.1223 2492545.4*** 45 .85142699. .00008879 −.05509905 −.02438638* 1.6910673*** 45 .19409789. −.00227811** 8.33344232*** −.06250502 67.108235*** 45 .61488381. Legend: *p < .1; **p < 05; ***p < .01. Source: Compiled by the authors using the Stata program..
(14) 230. I. LÁZARO-AGUILERA AND R. PALOMO-ZURDO. three independent variables provide the significance coefficients for each of the variables obtained using the linear regression model. In light of the results obtained, we can say that the firms that apply downsizing techniques, particularly the redundancy model, do not achieve better results because, as shown by the study, the firms that implement workforce reduction strategies do not improve their average results as per the different indicators used to measure efficiency in three of the variables used, EBITDA, efficiency ratio, and average cost per employee. According to the foregoing, we can verify that evidence confirms a positive relation between a workforce increase and an increase in corporate efficiency. Conclusion Since 2010, approximately 18 months after the outbreak of the financial crisis in September 2008, the European banking map has changed, mainly in relation with commercial banks. This transformation has given rise to a marked reduction of the commercial network and part of the central services of lending institutions. In this context, employment has been very adversely affected. Despite different ways of transformation and reorganization of the banking maps among the European countries—also between those in Southern Europe—all of them share a reduction in the number of entities and, consequently, the developing of downsizing strategies. It is also evident from the earlier studies undertaken that the economic cycle decisively affects the application of these techniques because, as observed from the results obtained by the entities analyzed, the years in which the financial crisis (from 2008) was most severe are also the years in which there was a more significant reduction in their number of employees. For this reason, our study has examined the relationship between the employment variable and the performance of banks, bearing in mind not only the years of the crisis but also those prior thereto, in order to have a representative sample that considers the variables affected by the crisis from opposite perspectives. To do so, we have chosen one of the European countries, i.e., Spain, as a research case, due to its high density of branches and the sharp concentration process developed especially by the savings banks. These practically disappeared in 2011, changing their original status to convert to listed banks. From the results obtained, the hypothesis of earlier studies on downsizing in the context of Spain (Claver & Fernández, 2006; Fernández, 2006; Muñoz & Sanchez, 2010, 2011; Maldonado et al., 2009; Requejo, 1996; Sanchez & Suarez, 2005; Suarez, 1999; Suarez & Vicente, 2000) is reinforced as we can deduce that the reduction of workforces is a strategy of immense magnitude used frequently in large Spanish firms and also in lending institutions. The results enable us to confirm that none of the results obtained from the models presented, examining the relationship between downsizing and the.
(15) JOURNAL OF TRANSNATIONAL MANAGEMENT. 231. increase of corporate efficiency, allow us to conclude that the impact has been positive as significant differences cannot be appreciated between the reduction of personnel and corporate efficiency. According to the results obtained in which the workforce variation was significant in three of the dependent variables at levels of between 5 and 10% it is clear that efficiency increases when the workforce of the firms increases since the result obtained from the model was positive. Therefore, it seems evident that the claim that large firms applying these techniques achieve better results could be rejected. Shown by the analysis, firms that implement workforce reduction strategies do not achieve better results, as measured across the different indicators used to measure efficiency for any of their variables. With the variables used to measure the effects of downsizing, namely EBITDA, efficiency ratio, and average cost per employee, it can be concluded that evidence confirms a positive relationship between the increase of the workforce and the increase of corporate efficiency. As a general conclusion, it should be pointed out that with this study we insist on the hypothesis that, in spite of a priori suppositions, there is a positive relationship between size and downsizing, thereby coinciding with the conclusions drawn by other authors (Budros, 1997; Suarez, 1999; Suarez & Vicente, 2000). Larger firms have a “need to change” consequent on surplus and inefficiencies, which has been analyzed for a specific sector such as banking, while being able to verify this within a time comprising two very different scenarios: the financial crisis and the prior boom. Nevertheless, these findings cannot be generalized for other European countries, but the research case presented in this work can show a path for implementing the methodology for other countries. Notes 1. Nearly 90% of MFIs are credit institutions (commercial banks, savings banks, credit unions, post office banks). The other 10% are money market funds accounted, central banks and other institutions. 2. IPSs arose with European Directive 2006/48/CE of June 14, of the access to the activity of credit institutions. IPSs are applicable to various types of banking institutions, although it seems better to adapt to savings banks and credit unions, by having a deeprooted solidarity culture. Its article 80 indicates “that the institutional system of protection is based on broad participation of credit entities with a predominantly homogeneous profile of activities.” It is also more precise than entities reasonably comparable in activity and business model, as in the aforementioned given its strong territorial character, the local roots and the practice of a dominant model of intensive and extensive retail banking on a network of offices. 3. The cases being the savings banks (cajas) Ontinyent and Pollensa. 4. To be precise, the mergers and groupings of savings banks (cajas) undertaken since 2010 gave rise to the incorporation of several banks that took over the banking business of the cajas from which they derived. Their incorporation as public companies limited by shares.
(16) 232. I. LÁZARO-AGUILERA AND R. PALOMO-ZURDO. (sociedades anónimas) and even their launch on the stock market from June 2011 was the manner of transforming their capacity in order to be solvent. 5. The European Association of Co-operative Banks (or EACB) was founded in Brussels in 1970 and is the leader association in the representation of the common interests of its 28 institutional members and the more than 4,200 European credit cooperatives that form part of it, while it acts as their official spokesman before the Institutions of the European Union. 6. To the foregoing should be added the processes undertaken earlier (the incorporation of Banca Cívica, Liberbank and Caja 3 by IPS, the mergers of la Caixa and Caixa Girona and the merger of Unicaja and Caja Jaén), and the cajas bailed out by the Bank of Spain in 2009 and 2010 respectively: Caja Castilla-La Mancha (CCM) and CajaSur, subsequently absorbed by other banks. 7. Source: Tribunal de Cuentas del Reino de España (The Spanish court of auditors), 2014.. References Ahmadjian, C. L., & Robinson, P. (2001). Safety in numbers: Downsizing and the deinstitutionalization of permanent employment in Japan. Administrative Science Quarterly, 46, 622–654. doi:10.2307/3094826 Arboledas, J. R. P., Hortal, J. P., & De Enterría Pérez, A. G. (2002). Libro Blanco: Las mejores prácticas en los procesos de reestructuración de plantillas. [White Book: Best practices in downsizing processes]. Madrid, Spain: University of Navarra IESE Business School, CREADE Especialistas in Personas, & Sagardoy Abogados. Bank of Spain. (2014). Boletín Estadístico [Statistics bulletin]. Madrid, Spain: Author. Baumol, W. J., Blinder, A., & Wolff, E. N. (2003). Downsizing in America: Reality, causes, and consequences. New York, NY: Russell Sage Foundation. Bruton, G. D., Keels, J. K., & Shook, C. L. (1996). Downsizing the firm: Answering the strategic questions. The Academy of Management Executive (1993–2005), 10, 38–43. doi:10.5465/ ame.1996.9606161553 Budros, A. (1997). The new capitalism and organizational rationality: The adoption of downsizing programs, 1979–1994. Social Forces, 76, 229–250. doi:10.2307/2580324 Budros, A. (2000). Organizational types and organizational innovation: Downsizing among industrial, financial, and utility firms. Sociological Forum, 15, 273–306. Budros, A. (2002). The mean and lean firm and downsizing: Causes of involuntary and voluntary downsizing strategies. Sociological Forum, 17, 307–342. Cameron, K. S., Freeman, S. J., & Mishra, A. K. (1993). Organizational change and redesign: Ideas and insights for improving performance. New York, NY: Oxford University Press. Carnero, F., Nuez, J., & Barroso, C. (2010). Banca Cívica. Reinventando la obra social de las cajas de ahorros. CIRIEC-España, Revista de Economía Pública, Social y Cooperativa, 68, 203–222. Cascio, W. F. (1993). Downsizing: What do we know? What have we learned? Academy of Management Executive, 7(1), 95–104. Cascio, W., & Young, C. (2003). Financial consequences of employment-change decisions in major US corporations, 1982–2000. In K. De Meuse & M. Lee (Eds.), Resizing the Organization (pp. 131–156). Bowling Green, OH: Society for Industrial and Organizational Psychology. Cascio, W. F., Young, C. E., & Morris, J. R. (1997). Financial consequences of employment change decisions in major U.S. corporations. Academy of Management Journal, 40, 1175–1189. doi:10.2307/256931 Casillas, J. C., & Barroso, M. C. (1998). Analysing the reorganization effect in Spanish firms 1990–1994. Revista Europea de Dirección y Economía de la Empresa, 7(3), 53–64..
(17) JOURNAL OF TRANSNATIONAL MANAGEMENT. 233. Chaves, R., & Soler, F. (2005). El comportamiento de Cajas de Ahorros y cooperativas de crédito españolas frente a los fines sociales: La obra benéfico-social y el fondo de educación y promoción cooperativa [The behavior of savings banks and credit cooperatives on social purposes: The benefical fund and the education and cooperative promotion fund]. GEZKI, 1, 45–62. Claver, E., & Fernández, J. A. (2006). Nuevas perspectivas en los procesos de reestructuración de plantillas [New perspectives on downsizing processes]. Investigaciones Europeas de Dirección y Economía de la Empresa, 12, 111–131. Corral, S., Dominguez, J., & López, R. (2011). The new map of Spanish financial system. Extoikos, 3, 65–77. Coucke, K., Pennings, E., & Sleuwaegen, L. (2007). Employee lay-off under different modes of restructuring: Exit, downsizing or relocation. Industrial and Corporate Change, 16, 161–182. doi:10.1093/icc/dtm002 Dahl, S. A., & Nesheim, T. (2010). Downsizing strategies and institutional environments. Scandinavian Journal Management, 14, 281–348. Davidson, W. N., Worrell, D. L., & Fox, J. B. (1996). Early retirement programs and firm performance. Academy of Management Journal, 39(4), 970–984. De Meuse, K., Bergmann, T., Vanderheiden, P., & Roraff, C. (2004). New evidence regarding organizational downsizing and a firm’s financial performance: A long-term analysis. Journal of Managerial Issues, 16, 155–177. De Meuse, K. P., Vanderheiden, P. A., & Bergmann, T. J. (1994). Announced layoffs: Their effect on corporate financial performance. Human Resource Management, 33(4), 509–530. DeWitt, R. L. (1993). The structural consequences of downsizing. Organization Science, 4(1), 30–40. doi:10.1287/orsc.4.1.30 Dewitt, R. L. (1998). Firm, industry, and strategy influences on choice of downsizing approach. Strategic Management Journal, 19, 59–79. doi:10.1002/(SICI)1097-0266(199801)19:1<59:: AID-SMJ934>3.0.CO;2-2 Efthyvoulou, G., & Yildrim, C. (2014). Market power in CEE banking sectors and the impact of the global financial crisis. Journal of Banking and Finance, 40(3), 11–27. doi:10.1016/ j.jbankfin.2013.11.010 Espahbodi, R., John, T., & Vasudevan, G. (2000). The effects of downsizing on operating performance. Review of Quantitative Finance and Accounting, 15, 107–126. European Association of Co-operative Banks. (2010). Corporate social responsibility report in cooperative banks. Brussels, Belgium: Author. European Central Bank. (2014). Banking structures report. Retrieved from https://www.ecb. europa.eu/pub/pdf/other/bankingstructuresreport201410.en.pdf Fernández, J. A. (2006). Qué sabemos realmente acerca de las reestructuraciones de plantillas? Unaaportaciónteórica [What do we really know about downsizing? A theoretical contribution]. Economic Analysis Working Papers (EAWP), 5, 1–17. Filatotchev, I., Buck, T., & Zhukov, V. (2000). Downsizing in privatized firms in Russia, Ukraine, and Belarus. Academy of Management Journal, 43, 286–304. doi:10.2307/ 1556396 Flanagan, D. J., & O’Shaughnessy, K. C. (2005). The effect of layoffs on firm reputation. Journal of Management, 31(3), 445–463. García-Montalvo, J. (2014). Vuelta a la “banca aburrida” en la era del desapalancamiento y la nueva regulación financiera [Going back to boring banking in the unleveraged era and the new financial regulation]. Cuadernos de Información Económica, 238, 47–58. Guthrie, J. P., & Datta, D. K. (2008). Dumb and dumber: The impact of downsizing on firm performance as moderated by industry conditions. Organization Science, 19, 108–123. doi:10.1287/orsc.1070.0298.
(18) 234. I. LÁZARO-AGUILERA AND R. PALOMO-ZURDO. Gutiérrez, M., Palomo, R., & Romero, M. (2012). The territorial enlargement as a motivational fact for the reorganization of Spanish financial sector: The case of saving and cooperative banks. Revesco, 107, 7–34. Hillier, D., Marshall, A., McColgan, P., & Werema, S. (2007). Employee layoffs, shareholder wealth and firm performance: Evidence from the UK. Journal of Business Finance & Accounting, 31(3–4), 467–494. Hitt, M. A., Hoskisson, R. E., & Ireland, R. D. (1994). A mid-range theory of the interactive effects of international and product diversification on innovation and performance. Journal of Management, 20(2), 297–326. Homma, T., Tsutsui, Y., & Uchida, H. (2014). Firm growth and efficiency in the banking industry: A new test of the efficient structure hypothesis. Journal of Banking and Finance, 40(3), 143–153. doi:10.1016/j.jbankfin.2013.11.031 Huselid, M. (1995). The impact of human resource: Management practices on turnover, productivity, and corporate financial performance. Academy of Management Journal, 38, 635–672. doi:10.2307/256741 Iqbal, Z., & Shetty, S. (1995). The impact of merger outcome, bid order, payment method and managerial resistance on stock returns to bidders in multiple-bidder merger contests. International Review of Economics & Finance, 4(1), 57–67. Lee, P. M. (1997). A comparative analysis of layoff announcements and stock price reactions in the United States and Japan. Strategic Management Journal, 18(11), 879–894. Love, G., & Kraatz, M. (2009). Character, conformity, or the bottom line? How and why downsizing affected corporate reputation. Academy of Management Journal, 52, 314–355. doi:10.5465/amj.2009.37308247 Love, G., & Nohria, N. (2005). Reducing slack: The performance consequences of downsizing by large industrial firms. Strategic Management Journal, 26, 1087–1108. doi:10.1002/smj.487 Magán, A., & Céspedes, J. (2007a). Difusión del downsizing en la empresa española. Análisis del modelo de dos etapas [Dissemination of downsizing in the Spanish firms. An analysis of the two-stage model]. Revista Europea de Dirección y Economía de la Empresa, 16, 55–72. Magán, A., & Céspedes, J. (2007b). Why are Spanish companies implementing Downsizing? Review of Business, 32(2), 5–22. Maldonado, M., Suárez, I., & Vicente, J. D. (2009). Downsizing y su efecto en los resultados en la gran empresa española [Downsizing and its effect over the outcome of big Spanish firms]. Revista Europea de Dirección y Economía de la Empresa, 18(4), 13–28. Markides, C. C. (1995). Diversification, restructuring and economic performance. Strategic Management Journal, 16(2), 101–118. Marr, R., & García, S. G. (1997). La dirección corporativa de los recursos humanos [The corporative direction of human resources]. Madrid, Spain: Díaz de Santos. McElroy, J., Morrow, P., & Rude, S. (2001). Turnover and organizational performance: A comparative analysis of the effects of voluntary, involuntary and reduction-in-force turnover. Journal of Applied Psychology, 86, 1294–1299. doi:10.1037//0021-9010.86.6.1294 Mellahi, K., & Wilkinson, A. (2010). A study of the association between level of slack reduction following downsizing and innovation output. Journal of Management Studies, 47, 483–508. doi:10.1111/j.1467-6486.2009.00872.x Mentzer, M. (1996). Corporate downsizing and profitability in Canada. Canadian Journal of Administrative Sciences, 13(3), 237–250. Morris, J. R., Cascio, W. E., & Young, C. E. (2000). Downsizing after all these years: Questions and answers about who did it, how many did it, and who benefited from it. Organizational Dynamics, 27(3), 78–87. Muñoz, F., & Sanchez, M. J. (2010). Downsizing implementation and financial performance. Management Decision, 48, 1181–1197. doi:10.1108/00251741011076735.
(19) JOURNAL OF TRANSNATIONAL MANAGEMENT. 235. Muñoz, F., & Sanchez, M. J. (2011). Does downsizing improve organisational performance? An analysis of Spanish manufacturing firms. The International Journal of Human Resource Management, 22, 2924–2945. doi:10.1080/09585192.2011.599955 O’Shaughnessy, K. C., & Flanagan, D. J. (1998). Determinants of layoff announcements following M&As: An empirical investigation. Strategic Management Journal, 19, 989–999. doi:10.1002/ (sici)1097-0266(199810)19:10<989::aid-smj994>3.0.co;2-3 Palomo, R., Sanchis, J. R., & Gutierrez, M. (2011). Efectos de la crisis financiera sobre la innovación en la reorganización de los sistemas bancarios: Los sistemas institucionales de protección en las entidades financieras de ámbito territorial [Effects of the financial crisis on innovation in the reorganization of banking systems: The institutional protection schemes in local financial institutions]. Innovar Journal, 21/39, 179–190. Perry, T., & Shivdasani, A. (2005). Do boards affect performance? Evidence from corporate restructuring. Journal of Business, 78, 1403–1431. doi:10.1086/430864 Pfeifer, C. (2007). The perceived fairness of layoffs in Germany: Participation, compensation, or avoidance? Journal of Business Ethics, 74(1), 25–36. Requejo, A. (1996). Reducción de plantilla y problemas de viabilidad financiera: El papel de la estructura de capital [Reduction of workforce and financial viability: The role of financial structure]. Investigaciones Económicas, 20, 43–70. Rughoo, A., & Sarantis, N. (2014). The global financial crisis and integration in European retail banking. Journal of Banking and Finance, 40(3), 28–41. doi:10.1016/j.jbankfin.2013.11.017 Sanchez, M. J., & Suarez, I. (2005). Los procesos de reducción de plantillas en el ámbito Español: Motivos y modalidades utilizadas [The downsizing processes in Spain: Reasons and categories]. Revista Europea de Dirección y Economía de la Empresa, 14, 81–96. Sheaffer, Z., Carmeli, A., Steiner-Revivo, M., & Zionit, S. (2009). Downsizing strategies and organizational performance: A longitudinal study. Management Decision, 47, 950–974. doi:10.1108/00251740910966677 Suarez, I. (1999). Decisiones de reducción de la plantilla en la gran empresa española. Investigaciones Europeas de Dirección y Economía de la Empresa, 5, 79–100. Suarez, I., & Vicente, J. D. (2000). Decisiones de reestructuración organizativa en la gran empresa española durante la década de los noventa [Organizational restructuring decisions in the big Spanish companies during the nineties]. Working paper, University of Salamanca, Salamanca, Spain. Van Dierendonck, D., & Jacobs, G. (2012). Survivors and victims, a meta-analytical review of fairness and organizational commitment after downsizing. British Journal of Management, 23(1), 96–109. Vicente, J., & Suarez, I. (2007). Ownership traits and downsizing behaviour: Evidence for the largest Spanish firms, 1990–1998. Organization Studies, 28, 1613–1638. Wayhan, V. B., & Werner, S. (2000). The impact of workforce reductions on financial performance: A longitudinal perspective. Journal of Management, 26(2), 341–362. Worrell, D. L., Davidson, W. N., & Sharma, V. M. (1991). Layoff announcements and stockholder wealth. Academy of Management Journal, 34(3), 662–678. Yoo, H., & Mody, B. (2000). Predictors of downsizing in the U.S. local telephone industry. Information Society, 16, 23–33. doi:10.1080/019722400128301 Yu, G., & Park, J. (2006). The effects of downsizing on the financial performance and employee productivity of Korean firms. International Journal of Manpower, 27, 230–250. doi:10.1108/01437720610672158.
(20)
Figure


+3

Documento similar
Keywords: Metal mining conflicts, political ecology, politics of scale, environmental justice movement, social multi-criteria evaluation, consultations, Latin
Recent observations of the bulge display a gradient of the mean metallicity and of [Ƚ/Fe] with distance from galactic plane.. Bulge regions away from the plane are less
For instance, (i) in finite unified theories the universality predicts that the lightest supersymmetric particle is a charged particle, namely the superpartner of the τ -lepton,
Given the much higher efficiencies for solar H 2 -generation from water achieved at tandem PEC/PV devices ( > 10% solar-to-H 2 energy efficiency under simulated sunlight) compared
Plotinus draws on Plato’s Symposium (206c4–5) – “procreate in what is beautiful” – 3 in order to affirm that mixed love (which is also a love of beauty) is fecund, although
Although some public journalism schools aim for greater social diversity in their student selection, as in the case of the Institute of Journalism of Bordeaux, it should be
In the “big picture” perspective of the recent years that we have described in Brazil, Spain, Portugal and Puerto Rico there are some similarities and important differences,
The absence of a legal bullion market with free prices was complemented with bans on the export of bullion 15 : “It is forbidden to any native or foreign individual to take out of
