Poly(ethyleneglycol) column for the determination of acetaminophen, phenylephrine and chlorpheniramine in pharmaceutical formulations / C Barbas [et al ]
7
0
0
Texto completo
(2) 238. ´ et al. / J. Chromatogr. B 785 (2003) 237–243 A. Garcıa. Table 1 Chemical structures of the assayed compounds. presence of impurities such as 4-aminophenol and 4-chloroacetanilide related to acetaminophen. The dosage forms also contain excipients. In a previous work [1] we carried out a detailed review of the analytical methods published for measuring some of these substances, alone or in different combinations. Phenylpropanolamine hydrochloride and acetaminophen have been determined in pharmaceutical preparations by Raman spectroscopy [2]; phenylpropanolamine and chlorpheniramine together with other active compounds have been measured by GC [3–5] and by HPLC [6]. Different analgesics including acetaminophen and chlorpheniramine have been analysed by HPLC with on-line postcolumn photochemical derivatization [7] and by GC [8]. Acetaminophen and chlorpheniramine in human plasma have been determined by LC–MS–MS and by HPLC in combination with codeine [9] and pheudoephedrine [10,11]. Acetaminophen, phenylpropanolamine, chlorpheniramine and dextromethorphan were separated by MECC [12,13] in cold medicines. Acetaminophen and chlorpheniramine have been determined by EKC employing bile salts in cold medicines [14]. Three methods in the literature report the quantitation of acetaminophen, chlorpheniramine and phenylpropanolamine. The method of Gupta et al.. [15] requires three different analysis with three different mobile phases. Indrayanto et al. [16] and Zhao et al. [17] developed a simultaneous assay of the three active compounds by HPLC. Krieger et al. developed a method for the separation of acetaminophen in analgesic preparations containing chlorpheniramine maleate, phenylephrine hydrochloride, and other active components by HPLC [18] but the method did not permit the separation of the impurities, although many modifications were tested. Some of the methods developed by column suppliers for several standards have also been included [19– 23]. However, none of the methods separates the three actives here proposed, and the impurities. In a previous work we developed and validated a HPLC method for the simultaneous determination of acetaminophen, phenylephrine and chlorpheniramine in pharmaceutical formulations such as capsules and sachets, including the separation of impurities and excipients with a gradient elution in a SymmetryShield RP8. The run lasted 20 min. The method has been employed for stability assays, but it presents problems related to gradient elution. The change in solvent composition cause baseline shifts because of the change in optical properties of the eluent, which causes trouble at low wavelengths. Moreover, it also generates the irregular elution of.
(3) ´ et al. / J. Chromatogr. B 785 (2003) 237–243 A. Garcıa. unknown retained compounds, usually coming from water, when the organic solvent proportion increases, which complicates the impurities analysis. During recent years, manufacturers have developed reversed-phase media suitable for analysing these types of samples. Reversed-phase media that use polar groups can yield more efficient analysis of samples that contain a wide range of polarities by reducing analysis times and avoiding gradient elution. Therefore, the objective of the present work was the development and validation, following ICH guidelines [24] of an isocratic and rapid HPLC method for the determination of acetaminophen, chlorpheniramine and phenylephrine and related impurities in capsules as pharmaceutical form, easy to be used in routine analysis both for quality and stability control.. 2. Experimental. 2.1. Apparatus An Agilent technologies 1100 series (Las Rozas, Madrid, Spain) provided with an automatic injector, a diode-array detection system and a column oven was used. The chromatographic analyses were performed on a 1530.46 cm, 5 mm, Discovery HS PEG poly(ethyleneglycol) column (Supelco, Alcobendas, Madrid, Spain) kept at 35 8C. Final chromatographic conditions were an isocratic elution with 20 mM phosphate buffer, pH 7.0–acetonitrile (90:10, v / v). The phosphate buffer was prepared from H 3 PO 4 by adding NaOH to reach pH 7.0. The flow-rate was 1 ml / min and the injection volume was 5 ml. UV detection was performed at 215 nm for phenylephrine and chlorpheniramine, because at this wavelength the sensitivity was higher than at other more characteristic wavelengths and it was necessary for the detection of these minor compounds. For acetaminophen 310 nm was employed. At this wavelength the absorbance for this compound is very low and the signal is not saturated with the large amount of acetaminophen present in the sample, and so can detect minor compounds simultaneously. Hold up time for the chromatographic system was. 239. measured by injecting methanol as unretained compound.. 2.2. Chemicals Standards of actives and impurities as well as capsules, and excipients of the specialities were kindly provided by Cinfa (Pamplona, Spain). NaOH was from Panreac (Barcelona, Spain), and H 3 PO 4 and acetonitrile from Merck (Darmstadt, Germany).. 2.3. Standard solutions and sample preparation for quantitation In all cases the solvent solution (SS) for standards and samples was 20 mM phosphate buffer, pH 7.0– acetonitrile (70:30, v / v). A stock solution of phenylephrine was prepared with 250 mg of phenylephrine hydrochloride exactly weighed and dissolved with SS in a 25-ml volumetric flask. For chlorpheniramine maleate stock solution, 100 mg were made up 25 ml with SS. For the reference stock standard, 500 mg of acetaminophen were weighed into a 50-ml volumetric flask and 1 ml of phenylephrine and chlorpheniramine solutions were added. The mixture was made up to the corresponding volume with SS and treated with magnetic stirring for 10 min. For capsules, 610 mg of sample (the approximate mass of one capsule) coming from a 20-capsules homogenate were dissolved in a 50-ml volumetric flask with SS. After 10 min of magnetic stirring an aliquot was filtered using a 0.45-mm syringe filtration disk to the vials for injection into the HPLC system. In all cases three replicates were processed.. 2.4. Validation The selectivity refers to the extent to which a method can determine particular analytes in mixtures or matrices without interferences from other components. In this assay it was tested by running solutions containing a placebo of the formulation. Moreover, solutions of the standards with the identified impurities, 4-aminophenol and chloracetanilide, at the 1% level added were also run to show both the resolution and selectivity of the method. In all cases.
(4) 240. ´ et al. / J. Chromatogr. B 785 (2003) 237–243 A. Garcıa. the spectra of the peaks were compared with those of the pure standards. The linearity study verifies that the sample solutions are in a concentration range where analyte response is linearly proportional to concentration. For main component assay methods, this study is generally performed by preparing standard solutions at five concentration levels, from 75 to 125% of the target analyte concentration. In this case, acetaminophen concentrations were from 7.5 to 12.5 mg / ml, phenylephrine hydrochloride from 0.15 to 0.25 mg / ml and chlorpheniramine maleate from 0.06 to 0.1 mg / ml. They were prepared in 50-ml volumetric flasks by weighing the exact amount of acetaminophen (from 375.0 to 625.0 mg) and by adding the corresponding volumes of phenylephrine and chlorpheniramine, stock standards (0.750–1.25 ml each) and making up the total volume with SS. Each point was analysed three times. The accuracy of a method is the closeness of the measured value to the true value for the sample. For pharmaceutical studies in drug products one method for determining accuracy is the application of the analytical procedure to synthetic mixtures of the drug components to which known quantities of the drug substances to be analysed have been added. It was tested in triplicate at three levels (80, 95 and 110%) and in parallel with the linearity assay for the three main components. The percent recovery and RSD values were then calculated. The precision of an analytical method is the amount of scatter in the results obtained from multiple analyses of an homogeneous sample. The first type is instrumental precision, which was tested by consecutively running ten injections of the same standard. Then, repeatability or intra-assay precision was tested. Intra-assay precision data were obtained by repeatedly analyzing, in one laboratory on one day, ten aliquots of a homogeneous sample, each of which was independently prepared according to the method procedure. The second type is inter-assay precision. These data were obtained by repeating the intra-assay experiment on a different day with newly prepared mobile phase and samples. The detection limit of a method is the lowest analyte concentration that produces a response detectable above the noise level of the system, typically, three times the noise level. The detection limit. needs to be determined where chromatographic peaks near the detection limit will be observed. The quantitation limit is the lowest level of analyte that can be accurately and precisely measured. Limits of detection were calculated following IUPAC recommendations [(a 1 3SB ) /b] (a, the intercept; b, the slope; SB , the standard deviation of the blanks in the standards linearity) for chromatographic methods [25] by extrapolating to zero concentration the standards deviation of the last three points of linearity and interpolating this value in the corresponding equation. Both quantification and detection limits are calculated by means of the study of statistical parameters of the analysis of standards in the range of 0.1% of the theoretical content of a sample, i.e. acetaminophen concentrations from 0.01 to 0.07 mg / ml phenylephrine hydrochloride from 0.0002 to 0.006 mg / ml, and chlorpheniramine maleate from 0.0001 to 0.002 mg / ml.. 3. Results and discussion Retention and selectivity in reversed-phase HPLC result from complex combinations of hydrophobic and polar interactions among the solute, mobile phase, and stationary phase. Stationary phases have evolved from simple alkyl hydrocarbon chains to alkyl hydrocarbon chains in combination with other moieties, typically polar functional groups. These groups change retention and selectivity, particularly for solutes that have specific interactions with the polar portion of the stationary phase. So-called polar reversed phase always provide different retention and selectivity compared to C 18 and frequently provide valuable improvements in separation. A PEG phase has ether groups that can attract other polar analytes. PEG provides a very different separation of phenols compared to C 18 —greater retention of some phenols (phenylephrine, acetaminophen, 4-aminophenol) that are poorly retained on C 18 and faster analysis, including the elution of chlorpheniramine that eluted late on C 18 . During the optimization of the method the percentage of acetonitrile was varied from 30 to 5% with the same aqueous buffer at pH 7.0. Phenylephrine was not affected by the variation, 4-amino-.
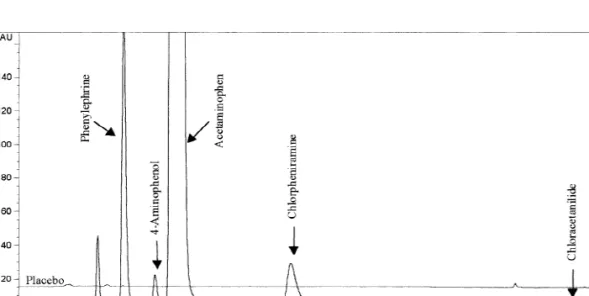
(5) ´ et al. / J. Chromatogr. B 785 (2003) 237–243 A. Garcıa. phenol and acetaminophen increased their retention times around 1 min in the whole range of acetonitrile proportion, while chlorpheniramine and chloracetanilide increased their retention times by 4 and 10 min, respectively, when acetonitrile was decreased from 30 to 5%. During development three pH values—2.5, 4.5 and 7.0—were tested. At more acidic pH phenylephrine and 4-aminophenol become protonated and their retention decreases to very short times with poor resolution. Buffer concentration was also tested and 20 mM provided the best peak symmetry. Therefore, the final chromatographic conditions were those quoted above in the previous section. Fig. 1 shows that there is no peak in the placebo of the speciality corresponding to the retention times of the analytes. The hold up time was 0.8 min and capacity factors were: phenylephrine 1.5, 4-aminophenol 2.2, acetaminophen 2.7, chlorpheniramine 5.4 and chloracetanilide 12.3. Acetaminophen, 4-aminophenol and 4-chloroacetanilide, which were run together with the standards, demonstrated both the resolution and selectivity of the method. The minor value obtained for resolution in the method corresponded to the 4-aminophenol–acetaminophen pair,. 241. and it was was 1.84. This means a baseline separation of both peaks. Validation parameters for linearity are shown in Table 2. It includes the experimental values plus the specifications to pass the test established following generally accepted criteria [31]. These parameters showed a good linearity, with correlation coefficients .0.999 for the three analytes, although only 0.99 would be enough for phenylephrine and chlorpheniramine due to their low concentration level in samples. A small bias was found in some of the regression lines (phenylephrine and acetaminphen), because the intercepts with their limits of confidence did not include the zero value. It could be mostly justified by the good fit of the points to the regression lines, which makes the limits of confidence for the intercept very narrow. Although statistically significant (Student-t test, P.0.05), the bias did not pose practical consequences, considering the results for the recoveries. Table 3 presents the results obtained for the precision tests plus the specification established to consider the result acceptable. RSD values in the intra-assay instrumental precision ranged from 0.13 to 0.37% for the three compounds when considering. Fig. 1. Chromatogram of standards of phenylephrine, chlorpheniramine maleate and acetaminophen at formulation levels plus 4aminophenol and chloracetanilide at the 0.1% level of acetaminophen. Peak at 1.5 min corresponds to maleate. The chromatogram in the upper level corresponds to the excipients. Supelco Discovery HS PEG column poly(ethyleneglycol), 5 mm, 1530.46 cm. The mobile phase was 20 mM phosphate buffer, pH 7.0–acetonitrile (90:10, v / v) at a flow-rate of 1 ml / min..
(6) ´ et al. / J. Chromatogr. B 785 (2003) 237–243 A. Garcıa. 242 Table 2 Validation parameters for linearity Range (mg / ml). Specification. Phenylephrine 0.15–0.25. Acetaminophen 7.5–12.5. Chlorpheniramine 0.06–0.10. Correlation coefficient (r). .0.999. 0.999. 0.99998. 0.999. Linearity test. ,5. 0.89 13.4 13.2–13.5 251.6554. 0.85 8.1 7.5–8.7 42.7373. 73.0 56.0–89.9 13.6993. 30.4 230.3–91.1 1.5944. Proportionality test. Response factor RSD (%) Slope Confidence interval Experimental t. 0 value not included t exp .t tab. 3.27 18.5 16.7–20.2 33.1878. Intercept Confidence interval Experimental t. 0 value included t exp ,t tab. 440.5 263.0–648.1 7.966. a single day, which means a very small variation due to instrumental causes, and from 0.80% to 2.91% when the areas of 2 different days were tested together. Chlorpheniramine did not pass the test, which means that calibration must be done daily, which is the usual practice. Chlorpheniramine’s RSD for inter-day instrumental precision is an unusually high value, in comparison to the other RSD values. For the intra-assay precision of the method RSDs for the three actives ranged from 0.93 to 1.91% on separate days and from 1.11 to 1.72% for inter-day precision. With these values and the intervals of acceptance established for the release of batches (95–105%), one replicate of each sample ought to be measured for quantification. Reproducibility was tested because the method will be employed in two different laboratories. As expected, the RSDs in each laboratory were similar. to the method’s RSDs and when considering results from both laboratories RSDs ranged from 1.83 to 2.16%, which passes the specification to consider a low influence in the results due to the laboratory where the measurement was performed. Recoveries were 98.860.4% for phenylephrine, 99.860.3% for acetaminophen and 100.260.8% for chlorpheniramine, which are not statistically significant (t-test, P,0.05). The detection limits were 0.12, 3 and 0.05 mg / ml for phenylephrine, acetaminophen and chlorpheniramine, respectively, which corresponds to 0.06, 0.03, and 0.06% of the theoretical content of each active in the formulation. The quantitation limit were 0.40, 10 and 0.16 mg / ml for phenylephrine, acetaminophen and chlorpheniramine, respectively, which corresponds to 0.2%, 0.1%, and 0.2% of the theoretical content of. Table 3 Validation parameters for sample precision in the quantitation level Specification. Instrumental precision. Intra-day (day 1) Intra-day (day 2) Inter-day. ,1.37%. Method precision. Intra-day (day 1) Intra-day (day 2) Inter-day. ,1.94%. Laboratory A Laboratory B Interlaboratory. ,1.94%. Reproducibility. ,1.94%. ,2.74%. ,2.74%. RSD (%) Phenylephrine. Acetaminophen. Chlorpheniramine. 0.13 0.21 1.11. 0.16 0.37 0.80. 0.17 0.26 2.91. 1.91 1.38 1.72. 0.98 1.29 1.11. 0.93 1.85 1.43. 1.91 1.42 2.16. 1.04 1.84 1.83. 0.93 1.87 1.96.
(7) ´ et al. / J. Chromatogr. B 785 (2003) 237–243 A. Garcıa. each active in the formulation. They were obtained by validating the method in these levels of concentration.. 4. Conclusion Polar reversed-phase materials can provide dramatically different separations compared to C 18 , yielding a more efficient analysis of samples that contain a wide range of polarities by reducing the analysis times and minimizing the necessity of gradient elution. This improvement is achieved by a combination of increased retention of polar species, which are retained away from the solvent front, and decreased retention of nonpolar compounds, which reduces the total analysis time. An isocratic HPLC method has been developed for acetaminophen, phenylephrine and chlorpheniramine and related impurities measurement in capsules in less than 6 min of total run for the three active compounds and less than 12 min if the impurity chloracetanilide is included in the measurement. With this system long chromatographic analysis times (.20 min) and the employ of gradient elution or two different analysis can be avoided. The method described in this study was found suitable to determine concentrations in the range 0.15–0.25 mg / ml for phenylephrine, 7.5–12.5 mg / ml for acetaminophen and 0.06–0.10 mg / ml for chlorpheniramine, precisely and accurately, in agreement with the validation parameters obtained. Limits of quantitation for the three actives were 0.40, 10 and 0.16 mg / ml for phenylephrine, acetaminophen and chlorpheniramine, respectively. Therefore the method can be considered adequate for the intended purpose.. References ´ E. Garcıa, ´ A. Garcıa, ´ C. Barbas, J. Pharm. [1] A. Marın, Biomed. Anal. in press. [2] T.H. King, C.K. Mann, T.J. Vickers, J. Pharm. Sci. 74 (1985) 443. [3] R.E. Madsen, D.F. Magin, J. Pharm. Sci. 65 (1976) 924. [4] F. De Fabrizio, J. Pharm. Sci. 69 (1980) 854.. 243. [5] E. Mario, L. Meehan, J. Pharm. Sci. 59 (1970) 538. [6] T.L. Sprieck, J. Pharm. Sci. 63 (1974) 591. [7] A.M. Di Pietra, R. Gatti, V. Andrisano, V. Cavrini, J. Chromatogr. A 729 (1996) 355. [8] X. Guo, W. Qian, C. Yang, X. Zhu, Se Pu 16 (1998) 164. [9] C.Y. Ko, F.C. Marziani, C.A. Janicki, J. Pharm. Sci. 69 (1980) 1081. [10] A.I. Gasco-Lopez, R. Izquierdo-Hornillos, A. Jimenez, J. Chromatogr. A 775 (1997) 179. [11] T.A. Biemer, J. Chromatogr. 410 (1987) 206. [12] L. Suntornsuk, Electrophoresis 22 (2001) 139. [13] S. Ji, Y. Chai, Y. Wu, D. Liang, Z. Xu, X. Li, Yaowu Fenxi Zazhi 18 (1998) 170. [14] H. Nishi, T. Fukuyama, M. Matsuo, S. Terabe, J. Chromatogr. 498 (1990) 313. [15] V. Das Gupta, A.R. Heble, J. Pharm. Sci. 73 (1984) 1553. [16] G. Indrayanto, A. Sunarto, Y. Adriani, J. Pharm. Biomed. Anal. 13 (1995) 1555. [17] X. Zhao, B. Tan, H. Zhang, Huaxi Yaoxue Zazhi 13 (1998) 271. [18] D.J. Krieger, J. Assoc. Off. Anal. Chem. 67 (1984) 339. [19] MAC-MOD. Zorbax HPLC columns. Application Briefs, The analysis of commercial over the counter cough and cold remedies using StableBond Cyano (SB-CN) columns [web page]. Available at www.mac-mod.com / ab / 96101-ab.html. [20] Phenomenex, MAXSIL HPLC columns [web page]. Available at http: / / www.phenomenex.com / Phen / Doc / zhmax.pdf. [21] Agilent Technologies, Zorbax HPLC method development hints [web page]. Available at http: / / www.selbybiolab.com.au / whats%20new / Zorbax%20April%20 May%20newsletter / Zorbax.html. [22] MAC-MOD. HPLC column companion, Section 11: what can you do to improve the peak shape of bases? [web page]. Available at www.mac-mod.com / cc / cc-11-bases.html. [23] Phenomenex, SYNERGI HPLC column. New HPLC columns and automated column selectors for fast HPLC method development [web page]. Available at www.phenomenex.com / Phen / Doc / zhpolr.pdf. [24] ICH: Q2B Analytical validation methodology, ICH Harmonised Tripartite Guideline, 1996, Step 4. [25] G.L. Long, J.D. Winefordner, Anal. Chem. 55 (1983) 712. [26] Numerical [web page]. Available at www.sunderland.ac.uk / |hs0dad / qm / cti4 / numerica.htm. [27] The Pharmaceutical Society of Great Britain, in: The Pharmaceutical Codex, 11th edition, The Pharmaceutical Press, London, 1979, p. 695. [28] The Merck Index. An Encyclopedia of Chemicals, Drugs, and Biomedicals. 13th Edition. Merck Research Laboratories. Division of Merck, Whitehouse Station, NJ, 2001. [29] Clarke’s Isolation and Identification of Drugs, 2nd edition, The Pharmaceutical Press, London, 1986. [30] Chemistry 130B [web page]. Available at www.chem.ucla.edu / |harding / 130B w99 final key.html. ] ] ] [31] G.P. Carr, J.C. Wahlich, J. Pharm. Biomed. Anal. 8 (1990) 613..
(8)
Figure
Documento similar
TPD discriminates between control factors, uncontrollable factors and experimental noise, treating them separately by means of special design matrices (orthogonal arrays) in
High-performance liquid chromatography- ultraviolet detection method for the simultaneous determination of typical biogenic amines and precursor amino acids. applications in
No obstante, como esta enfermedad afecta a cada persona de manera diferente, no todas las opciones de cuidado y tratamiento pueden ser apropiadas para cada individuo.. La forma
The expansionary monetary policy measures have had a negative impact on net interest margins both via the reduction in interest rates and –less powerfully- the flattening of the
In order to show the applicability of the HFBA-based SUPRAS proposed in this work, a novel analytical method for the determination of opiorphin in human saliva
In the previous sections we have shown how astronomical alignments and solar hierophanies – with a common interest in the solstices − were substantiated in the
In this context, one advantage of using the multiplicity instead of the Hilbert-Samuel function (the invariant used by Hironaka in [14]) is that, at least when the
As for table 4 but for the signal regions in the multi-jet + M J Σ stream for which the number of events in the control regions did not allow background determination using a fit
