TítuloBiofiltration of waste gases containing a mixture of formaldehyde and methanol
12
0
0
Texto completo
(2) Introduction Formaldehyde (HCHO) and methanol (CH3OH) are organic compounds commonly used in a variety of chemical processes. They are emitted to the atmosphere from different industrial sources (Prado et al. 2003) and have been detected in, among others, waste gases from synthetic resin-producing factories and off-gases from reactors used for the production of formaldehyde. At high concentrations, both pollutants are known to produce adverse effects on humans. Symptoms of exposure to formaldehyde include nausea, vomiting, abdominal pain and diarrhea. Formaldehyde is also considered to be a potential carcinogen. Similarly, the negative effects of methanol include headache, sleep disorders, gastrointestinal problems and optic nerve damage. Exposure to high concentrations of either of these pollutants may produce more critical effects, including death. This shows the importance of developing an efficient and reliable technology for the removal of such contaminants from industrial effluents. Traditionally, gas pollutants have been treated mainly by means of physico-chemical technologies, such as adsorption, absorption, condensation and incineration (Kennes and Veiga 2001). These technologies are relatively expensive and may produce undesirable side effects, like the generation of different toxic compounds or the transfer of the gas pollutants from the air to another phase in the case of absorption and adsorption processes. Over the past decades, biofiltration has been developed and quickly improved. Unlike traditional technologies, biofiltration is mainly based on biological principles, instead of physico-chemical ones. A number of studies prove that biofiltration minimizes the problems mentioned above for traditional technologies. Some studies have proved that either formaldehyde or methanol may be effectively removed from air by means of biological technologies (Adroer et al. 1990; Shareefdeen et al. 1993; Huckschlag 1992; Máckowiak 1992; Krailas et al. 2000; Ferranti 2001). Other authors have studied the simultaneous biodegradation of both pollutants, at laboratory-scale (Doronina et al. 1996; Prado et al. 2003), pilot-scale (Tautz and Rutenfranz 1992; Boswell et al. 2002) and industrial-scale (Garner 2002). Since formaldehyde and methanol are found in different industrial waste gases, the present study focused on developing and optimizing biological systems for formaldehyde and methanol abatement. The efficiency of biofilters and biotrickling filters was compared. Also, the effect of different operating parameters on performance was determined. Materials and methods Bioreactors Different cylindrical glass bioreactors were used and operated either as conventional biofilters or biotrickling filters (Fig. 1). Their height ranged from 50 cm to 60 cm and their internal diameter was between 8 cm and 10 cm. All connections were made using silicone or Viton tubing. An air compressor provided a dry airflow, regulated by means of flowmeters. Air coming from the compressor flowed through a closed carboy containing water. The bioreactors were operated at room temperature throughout the.
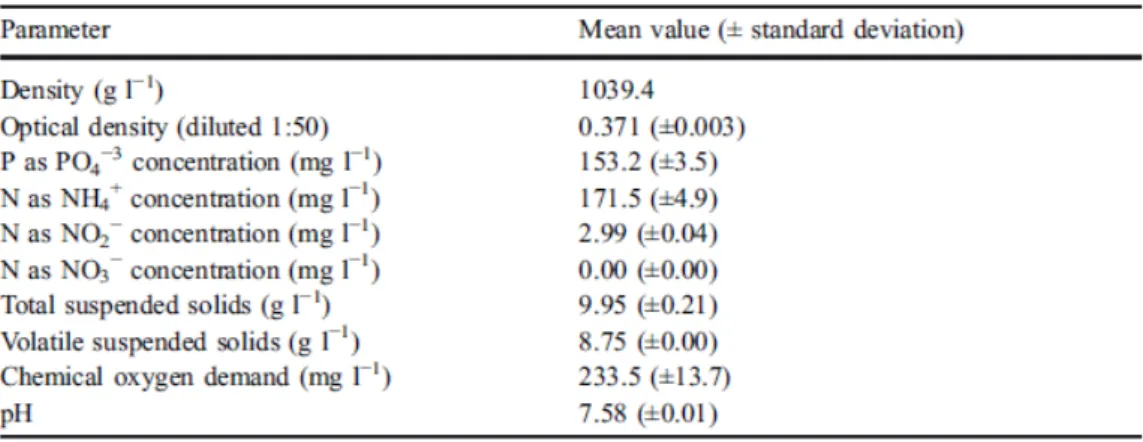
(3) study.. Fig. 1 Schemes of the bioreactor configurations used throughout the study. a Conventional biofilter, b biotrickling filter. 1 Compressor, 2 dehumidifier, 3 flowmeter, 4 mixing chamber, 5 pump, 6 pollutant reservoir, 7 reactor, 8 liquid reservoir. Inoculation Each reactor was inoculated with aerobic sludge obtained from the wastewater treatment plant of a synthetic resin-producing factory, in which both target pollutants were usually present (Cantó et al. 1998). The major physical and chemical characteristics of the sludge are given in Table 1 (Prado et al. 2003). Previous studies undertaken in batch and continuous liquid phase reactors showed the ability of the mentioned sludge to degrade mixtures of formaldehyde and methanol (Cantó et al. 1998; Eiroa et al. 2004). Inoculation of the reactors was performed as described by Prado et al. (2003). Table 1. Main physical and chemical characteristics of the sludge used for the inoculation.
(4) Analytical methods Formaldehyde and methanol concentrations were measured by means of a HP-6890 gas chromatograph equipped with a flame ionization detector (FID) and a HP-PLOT Q column (30 m long, 0.53 mm diam.), operating in splitless mode. The oven temperature was set at a constant value of 130°C, while the temperature of both the injector and detector was 150°C. Samples were injected using a 2.5 cm3 gas-tight Hamilton syringe. Under these conditions, the retention times of formaldehyde and methanol were 2.4 min and 3.5 min, respectively. Calibrations were performed as described by Prado et al. (2002). The pollutant concentration in the aqueous phase was estimated as described by Eiroa et al. (2004). A Warburg manometer was used to measure the pressure drop (Mendoza et al. 2004). Samples of the aqueous medium were taken periodically to measure pH, using an Ingold U455-S7 pH electrode connected to a Crison 507 pH meter. SEM photographs and chemical microanalysis of the filter beds were obtained, respectively, with a JEOL JSM-6400 SEM (working at a voltage of 20 kV and a working distance of 15 mm) and Oxford Instruments EDX equipment. Before the analysis, samples were dried for 24 h, placed on a metallic stub and covered with gold by means of a Balzers SCD-004 sputter coater. Results Selection of the best reactor configuration and filter bed material The aim of the first experiment was to compare the performance of bioreactors packed with different inert filter bed materials for the treatment of formaldehyde and methanol. Also, the performance of two different reactor configurations, a biofilter and a biotrickling filter, was compared. Systems 1, 2 and 3 were operated as conventional biofilters and were packed with lava rock, perlite and activated carbon, respectively. System 4 was a biotrickling filter packed with lava rock. The empty bed residence time (EBRT) was set at 80 s in all reactors. The characteristics of each filter bed material are given in Table 2. Table 2 Characteristics of the filter bed materials used in the experiment. Values given are averages ± standard deviation. Concentrations are given as weight-%. ND Not detected. During the present experiment, 750 ml sludge was continuously recirculated through the biotrickling filter at a flow rate of 3.0 l h−1, with no pH adjustment or nutrient addition..
(5) In the case of the biofilters, no nutrient, water or sludge was added after inoculation. All reactors started degrading formaldehyde and methanol already immediately after inoculation, on the first sampling day. The inoculated sludge obtained from a wastewater treatment plant containing formaldehyde explains this very short start-up phase. During the first week of operation, formaldehyde loads around 15 g m−3 h−1 were fed to all the reactors, with removal efficiencies of 63.2±10.9, 55.8±15.3, 57.0±13.9 and 68.1±2.3% for systems 1, 2, 3 and 4, respectively. Formaldehyde elimination capacity vs formaldehyde load is shown in Fig. 2. During the present experiment, variable methanol loads, ranging from 0.5 g to 26.0 g m−3 h−1, were fed to the reactors. In all cases, the methanol removal efficiency exceeded 80%. These results indicate that all four systems reached very similar efficiencies.. Fig. 2 Formaldehyde elimination capacity (FEC) vs formaldehyde loads (FL) obtained with system 1 (diamonds), system 2 (squares), system 3 (triangles) and system 4 (crosses) After 1 week of operation, the methanol load was increased in all bioreactors, up to 644.1, 374.3, 578.8 and 601.2 g m-3 h−1 for systems 1, 2, 3 and 4, respectively. Simultaneously, a dramatic decrease in the formaldehyde removal efficiency was observed. Formaldehyde removal was completely inhibited after 48 h, while the removal efficiency of methanol remained above 90% in all reactors. The addition of a nutrient solution during week 3 of operation did not improve the removal of formaldehyde. During the next days, the methanol load was varied daily, for a period of about 4 weeks, in order to simulate a real industrial situation. The average methanol loads during this stage were 243.9, 104.5, 184.1 and 159.6 g m−3 h−1 for systems 1, 2, 3 and 4, respectively. All biofilters operated efficiently during this phase, with average methanol removal efficiencies exceeding 89%, even though the inlet methanol concentrations were highly variable. Maximum methanol elimination capacities were 619.4, 368.2, 518.0 and 596.5 g m−3 h−1 in systems 1, 2, 3 and 4, respectively. Such high values were maintained for more than 1 week, proving the ability of the reactors to efficiently remove high methanol loads. Meanwhile, the biodegradation of formaldehyde remained inhibited. In the next experiments, lava rock was used as a support for the microorganisms, since there was no significant difference between the three packing materials regarding reactor performance..
(6) Optimization of bioreactor operation In this experiment, four different bioreactor configurations were compared (Fig. 1). System 5 is represented in Fig. 1a, while systems 6–8 correspond to Fig. 1b. Table 3 summarizes their main characteristics. All bioreactors were inoculated in the same way and operated for more than 1 month under similar conditions, except for the characteristics described in Table 3. As formaldehyde is usually present at higher concentrations than methanol in waste gases from synthetic resin-producing factories, its concentration was increased in the present experiment. Operating parameters and results obtained during the experiment are given in Table 4. Table 3 Main characteristics of each bioreactor. BF Biofilter, BTF biotrickling filter System. aNutrient solution composition (per liter): 0.12 g MgSO47H2O, 0.25 g KH2PO4, 1.18 g (NH4)2SO4, 1.00 g NaCl, 0.96 g NH4Cl, with vitamins and trace minerals solutions added as described by Prado et al. (2002).. Table 4 Operating parameters and results obtained with each system. Values given are averages ± standard deviation. FEC Formaldehyde elimination capacity, FL formaldehyde load, FRE formaldehyde removal efficiency, MEC methanol elimination capacity, ML methanol load, MRE methanol removal efficiency, Pdm maximum pressure drop System.
(7) The average formaldehyde load supplied to system 5 was higher than the formaldehyde load supplied to systems 6–8 (Table 4) as a result of the higher purity of the formaldehyde solution used for feeding that reactor. Liquid formaldehyde was added to the air stream by means of a pump at a constant flow rate. When higher concentrations of water were present in the solution, a lower amount of formaldehyde was mixed with air. Later, the amount of formaldehyde supplied to system 5 was reduced during a few days to an average load of 47.3 g m−3 h−1 in order to allow easy comparison between the systems, obtaining a formaldehyde removal efficiency of 65.6%. The average elimination capacity of formaldehyde during this step was 31.0 g m−3 h−1 in that reactor; and methanol removal efficiencies above 96% were reached, with high stability. The pressure drop slightly increased during the experiment, reaching a value of 18 mm water m−1 filter bed after more than 1 month of operation. Although satisfactory results were obtained with this reactor configuration, it was considered that one of the problems that may limit its efficiency was related to the amount and distribution of moisture in the filter bed. This problem is avoided in system 6 by operating the reactor as a biotrickling filter, in which distilled water was recirculated at a constant rate of 3.0 l h−1, with no addition of nutrient or pH adjustment. This allowed a slightly better performance at similar inlet pollutant loads as in system 5 (Fig. 3). However, a higher pressure drop was reached (Table 4).. Fig. 3 Effect of formaldehyde load on formaldehyde elimination capacity in all four systems. System 7 was similar to system 6, but a nutrient solution was continuously recirculated instead of distilled water and its flow rate was increased to 9.0 l h−1. The purpose of this modification was to check whether, in the previous systems, the lack of nutrient negatively affected their performance. The nutrient solution was not renewed during the experiment and the pH was not adjusted. However, the removal efficiencies of both formaldehyde and methanol were lower than in the previous case (Table 4). A possible explanation can be found in the low pH of this system, around pH 4.2, resulting from the supply of a non-buffered nutrient solution containing ammonium as nitrogen source. A series of batch experiments was performed in order to confirm this. Results proved that formaldehyde and methanol removal was slower than when a higher pH was used (data not shown). The high trickling rate used in this experiment may result in mass transfer limitations, as suggested by Jinsiriwanit et al. (2002). Moreover, the high liquid.
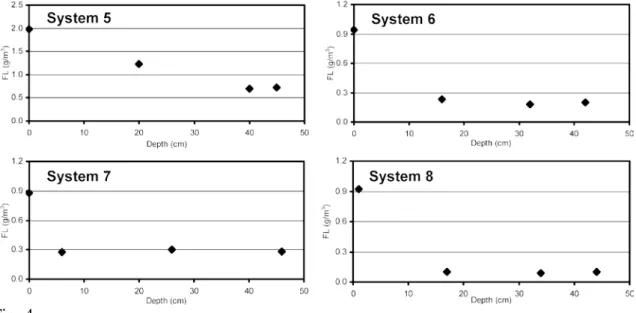
(8) flow rate contributed to the removal of some active biomass, maintaining a negligible pressure drop throughout the experiment. In system 8, the liquid flow rate was maintained at 3.0 l h−1, as in system 6, but the nutrient solution used was the same as in system 7; and in this case the aqueous phase was renewed weekly. pH was also adjusted weekly to pH 7.5–8.0, which was considered to be optimum for the sludge, but it started dropping after the supply of the nutrient solution, stabilizing a few hours later at a value around pH 6.0. This system proved to be the most efficient, with an average total elimination capacity of 43.5 g m−3 h−1. In this case, the pressure drop was moderate throughout the experiment (Table 4). The relationship between formaldehyde load and formaldehyde elimination capacity in the four systems is compared in Fig. 3. Figure 4 shows the elimination profile of formaldehyde in each bioreactor. As can be seen, there was a clear difference in the profile depending on the system. In the case of system 5 (a conventional biofilter) formaldehyde was removed linearly along the filter bed, while in the biotrickling filters the removal took part mainly close to the inlet zone of the reactor, due to the high mass transfer rate and biodegradation in that zone. Although formaldehyde is quite soluble in water, no formaldehyde was found in the aqueous phase collected at the outlet of the biotrickling filter.. Fig. 4 Formaldehyde elimination profiles in the four systems. Combined effect of EBRT and load on the performance of a formaldehyde-degrading biotrickling filter One parameter significantly affecting the performance of a bioreactor is the EBRT, defined as the relationship between the filter bed volume and the inlet gas flow rate (Kennes and Veiga 2001). If its value is lower than a critical value, the elimination efficiency will be below optimum. In the present experiment, the efficiency of a formaldehyde-degrading biotrickling filter was determined at different EBRTs. Formaldehyde and small amounts of methanol were fed to system 4, which had proven to be the most effective. The nutrient solution was renewed weekly, with the pH being adjusted to pH 7.5–8.0. In a first stage, a constant formaldehyde concentration of 0.9±0.1 g m−3 was supplied to the reactor. The performance was checked at the following EBRTs: 71.9, 46.5, 30.0 and 20.7 s. Changes in EBRT were performed by varying the gas flow rate. As the reactor volume was kept constant, the formaldehyde.
(9) load was different in each case. The formaldehyde load and EBRT used during the first experimental stage were similar to that in the previous study. Thus, the formaldehyde load did later increase because of the decreasing EBRT used in the later stages. The results, summarized in Table 5, confirm the data obtained with system 4 in the previous experiment, in which removal efficiencies of about 90% were obtained at formaldehyde loads of up to more than 60 g m−3 h−1 (Fig. 4). In the present experiment, the elimination capacity could be increased from 41 g to almost 112 g m−3 h−1 by reducing the EBRT from 71.9 s to 20.7 s. During the experiment, formaldehyde elimination capacities as high as 180 g m−3 h−1 were occasionally reached for a few hours. These values are much higher than those obtained in the previous studies, as a result of the higher formaldehyde load applied in this experiment. Figure 5 shows the influence of EBRT on the removal efficiency of formaldehyde. It can be concluded that the efficiency of the biofilter was high in all cases, decreasing slightly when the EBRT dropped to 20.7 s at the highest formaldehyde load.. Fig. 5 Effect of EBRT on formaldehyde removal efficiency, when supplying a constant formaldehyde concentration of around 0.9 g m−3, resulting in increasing loads while decreasing the EBRT. Table 5 Effect of EBRT on bioreactor performance when supplying a constant formaldehyde concentration. Values given are averages ± standard deviation. FIC Formaldehyde inlet concentration, FOC formaldehyde outlet concentration.
(10) At the end of the experiment, samples of the packing material were taken from regions located at different heights in the bioreactor in order to observe the microbial populations present in the filter bed. SEM photographs (Fig. 6) show that the microbial community was mainly composed of bacterial populations. A very few fungi were occasionally found as well, mainly in the upper zone. It was clearly visible that the microbial density was significantly higher near the inlet than near the outlet of the bioreactor, although it was not quantified. This is also consistent with the observed degradation profiles and the high removal rates found in the upper zone of the bioreactor.. Fig. 6 SEM photographs of a upper zone b lower zone of the reactor. Discussion The main objective of the present work was to optimize the treatment of a mixture of formaldehyde and methanol in bioreactors, selecting the most adequate packing material and evaluating the combined effect of EBRT and load on performance. For that purpose, different bioreactor systems were operated, each for several months. In a first experiment, the performance of three reactors packed with different inert filter bed materials (lava rock, perlite, activated carbon) was compared. The selection of the most suitable packing material is important in order to optimize biofilter performance and stability. Therefore, a wide variety of either inert or organic filter bed materials have been tested by different groups (Kennes and Veiga 2002). The former are more stable, present a defined composition and allow a more uniform gas distribution, although they are usually more expensive than organic carriers; and the bioreactors require a periodic supply of nutrients and inoculation with microorganisms before startup. Similar results were obtained with all the carrier materials used in the present work. Besides, the data suggest that the presence of methanol at high concentrations in the mixture of pollutants affects formaldehyde removal. Methanol seems to be a more accessible carbon source for the microorganisms, which may explain the inhibition of formaldehyde removal at high methanol loads. The comparison of the efficiency of four bioreactors proved that the pH and the liquid and nutrient supply can significantly affect the performance of bioreactors. The best results were obtained when using a biotrickling filter fed a nutrient solution that was renewed weekly. Bioreactors with an inadequate liquid or nutrient content, or with a low pH, reached a significantly lower efficiency (Kennes and Veiga 2001)..
(11) The effect of EBRT on formaldehyde degradation was also studied. A low EBRT may decrease the mass transfer rate of the pollutant in the biofilm and the gas phase boundary layer, affecting the removal efficiency (Arulneyam and Swaminathan 2000). Four EBRT values were used (71.9, 46.5, 30.0, 20.7 s), while keeping the rest of the operating parameters constant. The bioreactor efficiency was similar in the first three cases, decreasing slightly at the lowest EBRT of 20.7 s. This same pattern was also observed in previous experiments carried out with different pollutants (Hartmans et al. 1992; Deshusses and Hamer 1993; Arulneyam and Swaminathan 2000). During the present study, very high elimination capacities were obtained for both formaldehyde and methanol. The elimination capacity of formaldehyde reached 112 g m−3 h−1 when working at a residence time of 20.7 s, occasionally reaching 180 g m−3 h−1. Ferranti (2001) obtained formaldehyde elimination capacities around 18.0 g m−3 h−1 in a pilot-scale bioreactor, with removal efficiencies above 97%, at an EBRT of less than 9 s. In the same study, similar results were reported for an industrial-scale biofilter. Garner (2002) also worked with an industrial-scale biofilter and typically obtained removal efficiencies for formaldehyde and methanol above 95% and 90%, respectively. However, inlet loads were very low, reaching only 0.055 g m−3 h−1 for formaldehyde and 0.2 g m−3 h−1 in the case of methanol. The results obtained in our study also prove that methanol elimination capacities above 600 g m−3 h−1 can be reached and maintained for more than 1 week. Those values were obtained when working at an EBRT of 80 s. Shareefdeen et al. (1993) reached methanol elimination capacities up to 112.8 g m−3 h−1 in a biofilter packed with a mixture of peat and perlite (2:3, v/v). A maximum methanol elimination capacity of 301 g m−3 h−1 was achieved by Lee et al. (1996) in a biofilter packed with a mixture of compost and perlite. Krailas et al. (2000) reached a maximum elimination capacity of 101 g m−3 h−1 in two compost-packed biofilters. Good results were also obtained by Cornabé et al. (2002), who achieved a maximum methanol elimination capacity of 175 g m−3 h−1 in a biofilter packed with ceramic rings. Acknowledgements The present research was funded by projects PPQ 2001-0557 and PR 404E 2000/6-0. The doctoral research of Ó.J.P. is financed by the Xunta de Galicia (Spain). References Adroer N, Casas C, Mas C de, Solà C (1990) Mechanism of formaldehyde biodegradation by Pseudomonas putida. Appl Microbiol Biotechnol 33:210–220 Arulneyam D, Swaminathan T (2000) Biodegradation of ethanol vapour in a biofilter. Bioprocess Eng 22:63–67 Boswell JT, John P, Adams B (2002) Biofiltration of particleboard press vent emissions. In: Proceedings of the 96th annual AWMA conference and exhibition. Air and Waste Management Association, Baltimore, Md. Cantó M, Gómez J, Kennes C, Veiga MC (1998) Integrated anoxic-aerobic treatment of wastewaters from a synthetic resin producing factory. Proc Eur Conf New Adv Biol Nitrogen Phosphorus Removal Munic Ind Wastewater, pp 289–292 Cornabé T, Auria R, Christen P, Ferrer H, Revah S, Moukha S (2002) Biofiltration of methanol vapours by recombinant Pichia pastoris strain. In: Devinny JS, Reynolds FE Jr (eds) Proceedings of the 2002 USC-TRG conference on biofiltration. USC-TRG, Newport Beach, Calif..
(12) Deshusses MA, Hamer G (1993) The removal of volatile ketone mixtures from air in biofilters. Bioprocess Eng 9:141–146 Doronina NV, Ezhov VA, Trotsenko YA (1996) Aerobic biodegradation of formaldehyde, methanol and methylamine by immobilized Methylobacterium extorquens cells. Appl Biochem Microbiol 33:138–141 Eiroa M, Kennes C, Veiga MC (2004) Formaldehyde biodegradation and its inhibitory effect on nitrification. J Chem Technol Biotechnol 79:499–504 Ferranti MM (2001) Formaldehyde biological removal from exhaust air in the composite panel board industry from pilot tests to industrial plant. In: Proceedings of the 35th international particleboard composite materials symposium. Pullmann, Wash. Garner LG (2002) Biofiltration—a disruptive technology for sustainable air pollution control. In: Proceedings of the 96th annual AWMA conference and exhibition. Air and Waste Management Association, Baltimore, Md. Hartmans S, Leenen EJTM, Voskuilen GTH (1992) Membrane bioreactor with porous hydrophobic membranes for waste-gas treatment. In: Dragt AJ, Ham J van (eds) Biotechniques for air pollution abatement and odour control policies. Elsevier, Amsterdam, pp 103–106 Huckschlag W (1992) Biotechnologische Behandlung Phenol und Formalhydhaltiger Abluft. In: Dragt AJ, Ham J van (eds) Biotechniques for air pollution abatement and odour control policies. Elsevier, Amsterdam, pp 279–286 Jinsiriwanit S, Philip L, Deshusses MA (2002) Evaluation of a new biotreatment process for combustion gases. In: Devinny JS, Reynolds FE Jr (eds) Proceedings of the 2002 USC-TRG conference on biofiltration. USC-TRG, Newport Beach, Calif. Kennes C, Veiga MC (2001) Bioreactors for waste gas treatment. Kluwer, Dordrecht Kennes C, Veiga MC (2002) Inert filter media for the biofiltration of waste gases— characteristics and biomass control. Rev Environ Sci Biotechnol 1:201–214 Krailas S, Tuan Pham Q, Amal R, Jiang JK, Heitz M (2000) Effect of inlet mass loading, water and total bacteria count on methanol elimination using upward flow and downward flow biofilters. J Chem Technol Biotechnol 75:299–305 Lee BD, Apel WA, Walton MR, Cook LL (1996) Treatment of methanol contaminated air streams using biofiltration. In: Proceedings of the 89th annual AWMA meeting and exhibition. Air and Waste Management Association, Pittsburgh, Pa. Máckowiak J (1992) Abscheidung von Formaldehyd aus der Abluft im Biofilter. In: Dragt AJ, Ham J van (eds) Biotechniques for air pollution abatement and odour control policies. Elsevier, Amsterdam, pp 273–278 Mendoza JA, Prado ÓJ, Veiga MC, Kennes C (2004) Hydrodynamic behaviour and comparison of technologies for the removal of excess biomass in gas-phase biofilters. Water Res 38:404–413 Prado ÓJ, Mendoza JA, Veiga MC, Kennes C (2002) Optimization of nutrient supply in a downflow gas-phase biofilter packed with an inert carrier. Appl Microbiol Biotechnol 59:567–573 Prado ÓJ, Eiroa M, Veiga MC, Kennes C (2003) Bioreactors for the treatment of industrial waste gases containing formaldehyde and other aliphatic compounds. In: Agathos SN, Reineke W (eds) Focus on biotechnology. (Biotechnology for the environment, vol 3C) Kluwer, Dordrecht, pp 259–273 Shareefdeen Z, Baltzis BC, Oh Y-S, Bartha R (1993) Biofiltration of methanol vapor. Biotechnol Bioeng 41:512–524.
(13)
Figure
Documento similar