TítuloCharacterization of Coal by Thermal Analysis Methods
10
0
0
Texto completo
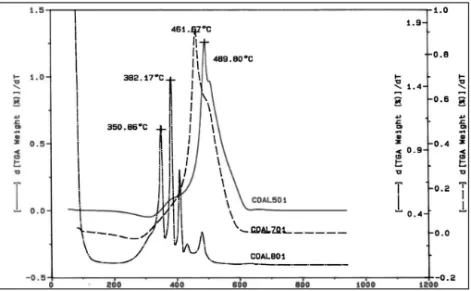
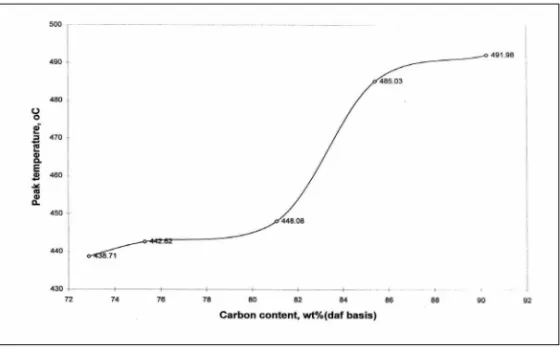
(2) 112. SEN LI, NATHAN WHITELY, WEIBING XU AND WEI-PING PAN. PT. ITFC BT. IT. Figure 1. Characteristic Points on DTG Curve of Coal Sample Coals of higher rank generally have a higher peak maximum temperature as shown by Figure 2.. Figure 2. DTG Curves of Coal Samples of Various Ranks This trend occurs because coals of higher rank contain less mineral matter effectively raising the calorific values. Figure 3 shows that the peak temperature follows a pattern as a function of carbon content..
(3) CHARACTERIZATION OF COAL BY THERMAL ANALYSIS METHODS. 113. Figure 3. Peak Temperature as a Function of Carbon Content For carbon contents in the range of 82-84%, the peak temperature would differ by a large amount. However, in the regions of 76-78% and 88-90% the peak temperature would vary by only a slight amount. The rate at peak temperature also follows a trend. Coals with 84-85% carbon content experience the highest rate at peak temperature; thus, burning more efficiently. Proximate analysis is the determination of the moisture, ash, and volatile matter. ASTM standard methods have been written for proximate analysis. Figure 4 shows how TGA can be used to perform the proximate analysis of a coal sample.. Figure 4. Proximate Analysis Using TGA.
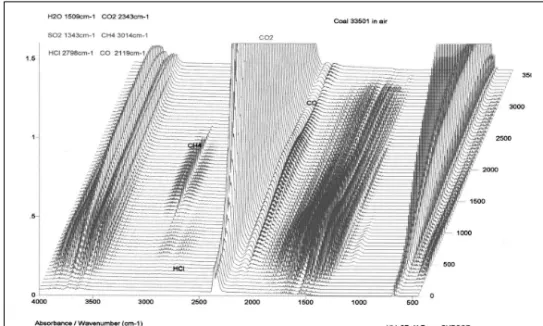
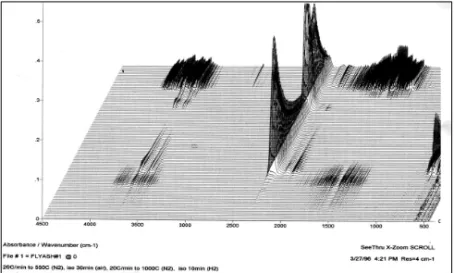
(4) 114. SEN LI, NATHAN WHITELY, WEIBING XU AND WEI-PING PAN. The furnace temperature is ramped to 110ºC and held isothermally. This ensures that any weight loss experienced is a direct effect of the moisture of the coal. The temperature is then ramped to 900ºC and held isothermally. Any weight loss occurring in this isotherm region is a direct result of the loss of volatiles. The previous two steps are performed in a nitrogen atmosphere. For the third part, the atmosphere is changed to oxygen. This creates an environment suitable for combustion. Once the coal is completely combusted, the residue is taken as the ash. Coal blends are used to make coal burning more environmentally considerate. Coals having high sulfur contents can be blended with low sulfur coal to decrease SO2 emissions, while retaining the efficiency. TGA is a very versatile instrument in assessing the feasibility of using coal blends. The linear additive rule can be used to estimate the theoretical composite value of a blend, but TGA must be used to estimate whether or not the properties of the blend are additive or not. A property is additive when the blend’s physical property can be predicted by the relative amounts of the component coals and their physical properties. The linear additive rule is a relationship defined by the properties of a coal in a blend and the amount of that coal in the blend. A series of coal blends were studied under isothermal and non-isothermal conditions in order to determine what physical properties of specific coal blends are additive or nonadditive [1]. Collectively the TG curves show that some TG parameters under nonisothermal combustion conditions are additive such as residue and weight loss while others such as peak temperature and maximum rate are not. For isothermal combustion the peak temperature and maximum rate are additive, while the residue and combustion end point temperature is not. TGA is utilized to such a great extent because TGA analysis of coal blends is fast, simple, and yields precise and accurate results. Chlorine in the form of HCl in coal has the potential to generate chlorinated hydrocarbons that can be released into the atmosphere that may be capable of causing corrosion [2]. TG-FTIR and TG-MS show good correlation to the temperatures where HCl is evolved. Figures 5 and 6 are the TG-FTIR and TG-MS plots, respectively.. Figure 5. TG-FTIR of Coal Blend.
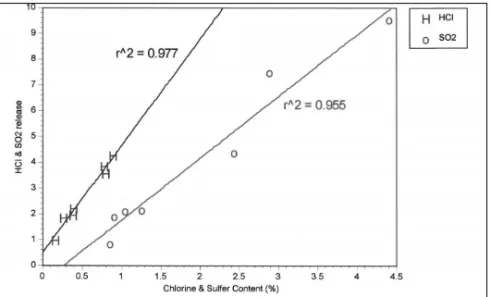
(5) CHARACTERIZATION OF COAL BY THERMAL ANALYSIS METHODS. 115. Figure 6. TG-MS of Coal Blend However, the TG-MS plot shows that the HCl evolution appears to occur in three regions. Figure 7 shows that the amount of HCl and SO2 released as determined by the integration of the FTIR curves correlate very well with the actual percentage of HCl and SO2 of the coal.. Figure 7. SO2 and HCl Emissions as a Function of Actual Sulfur and Chlorine Content Figure 7 shows the great precision and accuracy that TG-FTIR provides in determining the sulfur and chlorine content in coal. From Figure 8, it appears to show that HCl is evolved at lower temperatures for coals containing higher quantities of chlorine..
(6) 116. SEN LI, NATHAN WHITELY, WEIBING XU AND WEI-PING PAN. Figure 8. Maximum Temperature of HCl Release as a Function of Chlorine Content This trend occurs as HCl becomes less bound when present in higher concentrations. The temperature maximum of the second weight loss as determined by the DTG curve and the MS curve show good correlation. The intensity ratio is the ratio of the integration of the second peak to the integration of the first peak. The curve shows that British coal has a much higher intensity ratio than that of US coal, this supports that British coal is more corrosive than US coal. The particle size of the sample affects the temperature at which the HCl is evolved. Figure 9 shows that the two peaks shown in the TG/MS curve are definitely the result of HCl existing in two different forms within the coal.. Figure 9. TG-MS of Coal.
(7) CHARACTERIZATION OF COAL BY THERMAL ANALYSIS METHODS. 117. It can be concluded that the chlorine content of the coal is in good correlation with the amount of HCl evolved from the coal. Also it can be concluded that generally coals composed of smaller particle sizes evolve HCl at lower temperatures. HCl is released in three distinct regions. The first is due to HCl adsorbed on pore walls. The second represents more tightly bound HCl, and the third is the result from inorganic chlorides. Thermal analysis can be used to determine the components of combustion products in coal. Knowing the combustion products can help improve efficiency and increase environmental awareness. At the North American Thermal Analysis Society meeting in the fall of 1989, S. A. Mikhail and A. M. Turcotte initially proposed using TGA techniques for fly ash analysis [3]. The Mikhail and Turcotte method had shortcomings including low carbon percentage determination and uncertainty associated with the decomposition mechanism of CaSO4, which is used to determine the sulfur content of the fly ash. This new method refines the Mikhail and Turcotte TGA method to alleviate some of its drawbacks. Fly ash is a multi-component residue composed of carbonaceous material moisture, CaCO3, Ca(OH)2, CaSO4, and ash. The ASTM methods are not capable of determining multiple components in fly ash simultaneously; thus, the use of ASTM methods are time consuming and tedious. There are two key differences between the new method and the Mikhail-Turcotte method [3]. The Mikhail-Turcotte method burns the carbon in air prior to decomposing the CaCO3 in nitrogen. Because the carbon burns first in the Mikhail-Turcotte method, there is excess CO2 in the atmosphere. This CO2 can then combine with CaO to generate additional CaCO3. Because the two reactions overlap, the apparent carbon percentage using the Mikhail-Turcotte method is lower than the actual percentage. The new method converts CaO into CaCO3 prior to combusting the coal. This eliminates CaO from adsorbing CO2 produced by the combustion of the coal. This is rather insignificant for analyzing bed ash as the MikhailTurcotte method was developed, while it is very important for analyzing carbon-rich fly ash. The second difference in the two methods is the proposed decomposition mechanism of CaSO4. The new method shows a mechanism that CaSO4 in a H2 atmosphere reduces to CaS, while the Mikhail-Turcotte method has uncertainty in the decomposition mechanism. This conclusion was drawn from the TG/FTIR results shown in Figure 10.. Figure 10. TG-FTIR Using New Method to Show Sulfur Reduction Mechanism.
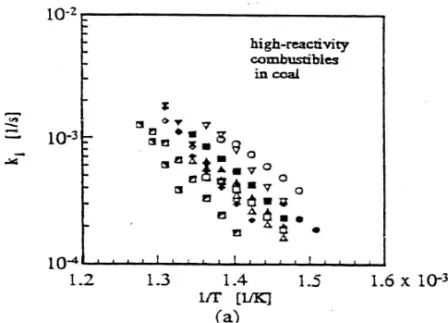
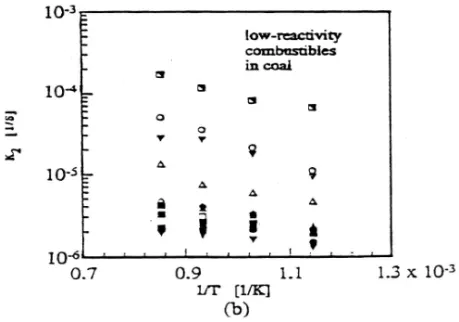
(8) 118. SEN LI, NATHAN WHITELY, WEIBING XU AND WEI-PING PAN. This is important because by measuring the residue of CaS, the initial sulfur content can be calculated, a limitation of the Mikhail-Turcotte method. Thermal analysis techniques provide a faster method that provides precise results as shown in Figure 11, a comparison of the TGA method results and the ASTM results.. Figure 11. Comparison of Sulfur Determination By New Method and ASTM The new method can accurately determine six components of an ash sample simultaneously. Coal combustion occurs as a two-step process. By modeling the combustion using Arrhenius relationships and autocatalytic reaction behavior, the rate constants for different ranks of coals can be generated [4]. The kinetic constant of low-reactivity combustibles is much smaller than the high-reactivity combustibles as seen in Figures 12 and 13.. Figure 12. Kinetic Constants for High-Reactivity Combustibles.
(9) CHARACTERIZATION OF COAL BY THERMAL ANALYSIS METHODS. 119. Figure 13. Kinetic Constants for Low Reactivity Combustibles Although both the high and low-reactivity constants show temperature dependence, that of low reactivity combustibles is lower. The ignition temperature increases with decreasing volatile matter of coal as seen in Figure 14.. Figure 14. Ignition Temperature as a Function of Volatile Matter Content The previous applications show how valuable TGA and evolved gas analysis are to the study of various coal systems. TGA provides a very rapid and precise method that most typically is accurate in predicting trends seen in large-scale applications providing a cheaper route for industry. It is very important that TGA’s shortcomings be fully understood so the instrument is not used for applications that TGA is not capable of performing..
(10) 120. SEN LI, NATHAN WHITELY, WEIBING XU AND WEI-PING PAN. References 1. Wei-Ping Pan, Yaodong Gan, Mohamad A. Serageldin, "A Study of Thermal Analytical Values for Coal Blends in Air Atmosphere," Thermochemica Acta, 1991, 180, 203-17. 2. J. Napier, J. Heidbrink, J. Keene, H. Li, W.P. Pan, J. T. Riley, "A Study of On-Line Analysis of Chlorine During Coal Combustion," Amer. Chem. Soc., Fuel Div. Preprints, 1996, 41(1), 56-61. 3. H. Li, X. Shen, B. Sisk, W. Orndorff, D. Li, W.P. Pan, J. Riley, "Studies of Fly Ash Using Thermal Analysis Techniques," J. of Thermal Analysis, 1997, 49, 943-51. 4. Y. Chou, S. Mori, W. P. Pan, "Estimating the Combustibility of Various Coals by TG/DTA," Energy & Fuels, 1995, 9, 71-74..
(11)
Figure
+5

Documento similar
SEM analysis in the coal refuse sample: (A) compact aggregates; (B) detail with clay aggregates containing different ions; (C) aggregates of phyllosilicates with folded edges;
La coordinación vertical debe apo11ar coherencia al conjunto del plan de estudios, estableciendo bien sus objetivos y adecuando a ellos todas las actividades docentes
Figure 41: Phase’s space diagram for a test at an angular velocity of 19.36 rpmm Figure 42 shows phase’s plane diagram corresponding to a test at an angular velocity of 14.86
For the second case of this study, the features for training the SVM will be extracted from the brain sources estimated using the selected SLMs MLE, MNE and wMNE. The scenario is
In this model the nuclear technology has been considered as generation option in several scenarios of costs of the fossil fuels, coal and natural gas.. Also, two
Example 8. For d > 1, are there towers with infinite genus over a number field K having an infinite number of trivial points of degree ≤ d?.. We will see in the next section that
Abstract: We study Heegner points on elliptic curves, or more generally modular abelian varieties, coming from uniformization by Shimura curves attached to a rather general type
This booklet includes top tips for those who experience a mental health condition to help improve their quality of life and think about their sense of belonging and place in
