Development of inhibitors of receptor protein tyrosine phosphatase β/ζ (PTPRZ1) as candidates for CNS disorders / M Pastor [et al ]
49
0
0
Texto completo
(2) KEYWORDS. PTPRZ1inhibitors. Pleiotrophin. CNS disorders. Drug addiction. Neurogenerative diseases. Molecular Dynamics. Organic synthesis. ABSTRACT. A new series of blood-brain barrier permeable molecules designed to mimic the activity of Pleiotrophin in the CNS has been designed and synthesized. These compounds exert their action by interacting with the intracellular domain PD1 of the Protein Tyrosine-Phosphatase Receptor Z1 (PTPRZ1), and inhibiting its tyrosine phosphatase activity. The most potent compounds 10a and 12b (IC50 = 0,1 M) significantly increase the phosphorylation of key tyrosine residues of PTPRZ1 substrates involved in neuronal survival and differentiation, and display protective effects against amphetamine-induced toxicity. Docking and molecular dynamics experiments have been used to analyze the binding mode and to explain the observed selectivity against PTP1B. In vitro and in vivo experiments have demonstrated that the most promising compounds can cross the BBB, thus promoting the possibility of moving forward these candidates for the development of drugs for the treatment of CNS disorders, such as drug addiction and neurodegenerative diseases.. INTRODUCTION. Pleiotrophin (PTN) and Midkine (MK) are neurotrophic factors that share over 50% identity in amino acid sequence.1 Both PTN and MK play important roles in development and repair of the central nervous system (CNS).2 The PTN and MK genes are widely expressed at different times in different cell types during development.3 However, their expression levels are highly restricted. 2.
(3) to a few cell types in adults.4 Both PTN and MK are upregulated at sites of injury, inflammation and repair in different cells of the CNS.5 It is important to note that both PTN and MK regulate neuroinflammation depending on the inflammatory stimulus and the brain area considered.6 In addition, MK and PTN are expressed in senile plaques of patients with Alzheimer’s disease7 and PTN upregulation has been also observed in the substantia nigra of Parkinson’s Disease (PD) patients.8 Both cytokines are also upregulated in different brain areas after administration of different drugs of abuse,9 suggesting PTN and MK signaling may be critical in different steps of wound repair in neurotoxic and neurodegenerative processes. Accordingly, in studies carried out in PTN knockout (PTN-/-) mice, it was shown that PTN prevents amphetamine-induced dopaminergic injury in the nigrostriatal pathway.10 In concordance with these data, striatal overexpression of PTN in different mouse models of dopaminergic injury exerts neuroprotective effects.11 These cytokines also modulate addictive behaviors. MK and PTN contribute to the extinction of cocaine- and amphetamine-seeking behaviors, respectively.10c, 12 PTN limits morphine withdrawal syndrome13 and both, PTN and MK, are potent regulators of behavioral effects induced by ethanol.14 Particularly, it has been demonstrated that PTN transgenic overexpression in the brain blocks the rewarding effects of alcohol.14a, 14b Overall, the data suggest that PTN and MK could be used for the treatment of neurodegenerative diseases, for prevention of drugs of abuse-induced neurotoxicity and for the treatment of a wide variety of drug addiction disorders. Like other proteins, PTN and MK exert suboptimal drug-like properties/inability to cross the blood-brain barrier (BBB). Although strategic drug delivery to the brain has been successfully used with other proteins,15 the risks in many occasions outweigh the benefits. If possible,. 3.
(4) pharmacological modulation of the signaling pathways triggered by PTN and MK may be preferred.9 Both PTN and MK bind to the Protein Tyrosine-Phosphatase Receptor Z1 (PTPRZ1; a.k.a. (R)PTPβ or RPTPβ/ζ), induce its oligomerization and inactivate its phosphatase activity.16 This leads to an increase in tyrosine phosphorylation of substrates critical for the effects of these cytokines such as β-catenin16b, Fyn kinase17 and Anaplastic Lymphoma Kinase (ALK).18 We hypothesize that PTN and MK actions on neurodegenerative diseases and drug addiction disorders described above can be reproduced with rationally designed small molecule inhibitors of PTPRZ1.5a, 9 PTPRZ1 inhibitors have been recently tested in tumor models.19 However, these molecules were unable to cross the cell membrane and required intracellular delivery by liposome carriers precluding use for the treatment of CNS diseases. In the present work, we propose to modulate the phosphatase activity of PTPRZ1 through the design and synthesis of small molecules that can cross the BBB and mimic the actions of PTN and MK. Many known phosphatase inhibitors contain multi-charged phosphate-mimicking components, and show poor cellular uptake. Huang et al.20 described, for the first time, one compound carrying an uncharged phosphate mimic (compound 1, Table 1) with a moderate activity against PTPRZ1 (IC50 = 3.5 µM), and a certain degree of selectivity against other related phosphatases. Considering 1 as a hit compound, we have followed a classical medicinal hit to lead optimization for the discovery of new PTPRZ1 inhibitors with a potential increased activity and selectivity and, more importantly, capable of crossing the BBB.. RESULTS AND DISCUSSION. 4.
(5) Design Rationale The structure of compound 1 and all the analogs synthesized in this work is depicted in Schemes 1-3. We have analyzed the effect of the substitution in the aromatic rings present in 1, and the nature and length of the connecting linker. In compounds 5a-c, the ether linkage was substituted by amides of different length (Scheme 1). Topological Polar Surface Area (TPSA) for these sulfoxides and the possibility of establishing ten hydrogen bond acceptors (see table 1) predict a low bioavailability for a successful CNS drug.21 To analyze whether the sulfoxide group is necessary for activity, and with the aim of improving pharmacokinetic properties, sulfides 4a-d, and 10a-b (Scheme 2) were also biologically tested. Calculated logP values for these sulfides are higher than the optimal 5 value. For this reason, sulfide 10c, where an aromatic ring was substituted by a pyridine, and sulfides 12a-e (Scheme 3) carrying an amino linker, were also selected for synthesis and biological evaluation. Chemistry The synthesis of compounds 4 and 5 is depicted in Scheme 1. Sulfides 4a and 4d were synthesized by reaction of 4-((trifluoromethyl)thio) benzoyl chloride (2a) and the corresponding amine 3. For the synthesis of amides 4b and 4c, a (EDCI) catalyzed coupling between 2-(4((trifluoromethyl)thio)phenyl)acetic acid (2b) and the corresponding amine 3 was followed. Oxidation of 4a-c with m-chloroperbenzoic acid provided sulfones 5a-c. Scheme 1. Synthetic route to 4 and 5a. 5.
(6) Z. O. H 2N. O. F3 C. n. m. S. O. a. N m H. +. S. S CF3. 2a: Z=Cl: m=0 2b: Z=OH; m=1. b. F3 C. S O. O N. n. S. n. m H. CF3. CF3 4a: m=0; n=0 4b: m=1; n=0 4c: m=1; n=1 4d: m=0; n=1. 3a: n = 0 3b: n = 1. O CF3 S O. 5a: m=0; n=0 5b: m=1; n=0 5c: m=1; n=1. a. Reagents and conditions: (a) for 4a and 4d: K2CO3, THF; for 4c and 4b: HOBt, EDCI, DMF; (b) MCPBA, DCM, 80 ºC, sealed tube.. Compounds 10 were synthesized by arylation of benzylic alcohols 8 and 9 with (4fluorophenyl)(trifluoromethyl)sulfane (6) or 1-fluoro-4-(trifluoromethylsulfonyl)benzene (7), using sodium hydride as base (Scheme 2). Sulfones 7 and 1 were obtained by oxidation of 6 and 10a with m-chloroperbenzoic acid. Scheme 2. Synthetic route to 1 and 10 O F 3C. S. a. F 3C. O S. F. F. 6. 7 b. HO S. F3 C. a O. CF3. b N 9. F3 C. F3 C. S O. 10a: X=S 10b: X=SO 2. 8 HO. O. O X. S. CF3. 1. S O. CF3 O. S. 10c. O N. a. Reagents and conditions: (a) MCPBA, DCM, 80 ºC, sealed tube; (b) NaH, DMF and compound 6 for 10a and 10c respectively, or compound 7 for 10b.. 6.
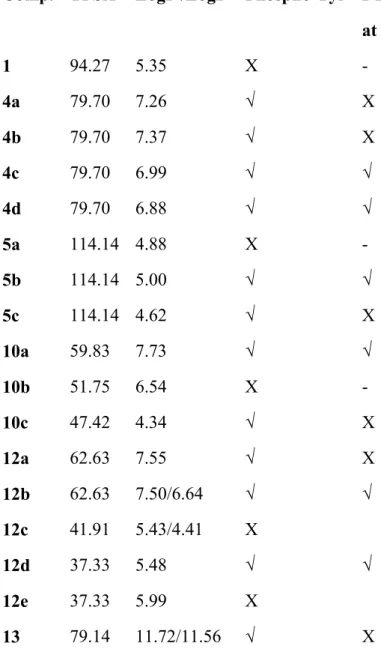
(7) Amines 12a-e were obtained by reductive amination of aldehydes 11 with amines 3 using sodium triacetoxyborohydride as reductive agent (Scheme 3). Scheme 3. Synthetic route to 12a-ea O F3C. n S. 3a: n=0 3b: n=1. NH2 +. a. H. F3 C. N nH S. R. SCF3. R 11a: R = SCF3 11b: R = Cl 11c: R = H. 12a: n=0; R=SCF 3 12b: n=1; R=SCF3 12c: n=1; R=H 12d: n=0; R=H 12e: n=0; R=Cl F3 CS. N. 13 SCF 3. a. Reagents and conditions: (a) NaBH(OAc)3, CH3CO2H or CF3CO2H, DCM.. Reductive amination of 11a with 3b gave, together with the expected compound 12b, a tertiary amine 13, which was also included for biological evaluation. Biological Evaluation As a preliminary screening, we tested the total levels of phosphorylation of tyrosine residues in HeLa cells treated with different concentrations (0.1, 1.0 and 10.0 µM) of all 17 compounds (Phospho-Tyr in Table 1). The compounds that induced at least a 10% increase of Phospho-Tyr levels at any of the used concentrations were selected for further evaluation of inhibition of the phosphatase activity of PTPRZ1 (Figure 1S, see supplementary material). The selected compounds were 4a-d, 5b-c, 10a, 12a-b, 12d, and 13. A limitation of this approach is that HeLa cells constitutively express other tyrosine phosphatases that may compensate for the inhibition of PTPRZ1 induced by these compounds. Thus, it is possible that some of the inhibitors of PTPRZ1 that we designed and synthesized were discarded as false negatives. This may be the case of. 7.
(8) compound 1, the PTP1B inhibitor synthesized by Huang et al.20 that also exerted some inhibition on PTPRZ1 (IC50 = 3.5 μM) and other phosphatases. However, we chose this strict selection criterion to select the most potent inhibitors for the next phase. Table 1. Values of calculated TPSA, logP/logD and results of the Phospho-Tyr and PTPRZ1 inhibition test at 1.0 µM Comp. TPSA. LogP /LogD Phospho-Tyr PTPRZ1 inhibition at 1.0 µM. 1. 94.27. 5.35. X. -. 4a. 79.70. 7.26. √. X. 4b. 79.70. 7.37. √. X. 4c. 79.70. 6.99. √. √. 4d. 79.70. 6.88. √. √. 5a. 114.14 4.88. X. -. 5b. 114.14 5.00. √. √. 5c. 114.14 4.62. √. X. 10a. 59.83. 7.73. √. √. 10b. 51.75. 6.54. X. -. 10c. 47.42. 4.34. √. X. 12a. 62.63. 7.55. √. X. 12b. 62.63. 7.50/6.64. √. √. 12c. 41.91. 5.43/4.41. X. 12d. 37.33. 5.48. √. 12e. 37.33. 5.99. X. 13. 79.14. 11.72/11.56. √. √. X. 8.
(9) Next, we performed an enzymatic assay of PTPRZ1 using the selected 11 compounds mentioned above. After optimizing the assay conditions, we performed a screening test to assess the capacity of a single concentration (1.0 µM) of each of these compounds to induce at least a 10% inhibition of the phosphatase activity of PTPRZ1. Six compounds, 4c-d, 5b, 10a, 12b and 12d, met this criterion and underwent concentration-response studies to calculate the halfmaximal inhibitory concentration (IC50). Among the remaining compounds, we found that 10a, 12b and 4c exhibited the most potent inhibition, with a range of IC50 values between 0.1 – 0.8 μM (Table 2). In contrast with the results of Huang et al.20, it should be noted that compound 1 failed to inhibit PTPRZ1 phosphatase activity in our assays. These apparent discrepancies may reflect significant methodological differences. First, while we have used a commercial PTPRZ1 protein, plasmids containing the PTPRZ1 active domain fragment were used in the previous report to subclone the fragment for expression in insect cells.20 Second, we have used a different method of detection of inorganic phosphate in the PTPRZ1 enzymatic assay, the phosphate sensor reagent that binds inorganic phosphate in a rapid, tight (Kd ~ 0.1 µM) and more sensitive manner.. Table 2: IC50 Values (in µM) of PTPRZ1 and PTP1B inhibition. Phosphatase 4c. 4d. 5b. 10a. 12b. 12d. PTPRZ1. 0.8. >100. >10. 0.1. 0.1. 5.0. PTP1B. NDª. -. -. NDª. 0.7. 1.0. ª ND = Non Detected. We also assessed the inhibitor selectivity of all six compounds for PTP1B. We selected PTP1B as the most prominent PTP currently investigated as a pharmacological target.22 As shown in. 9.
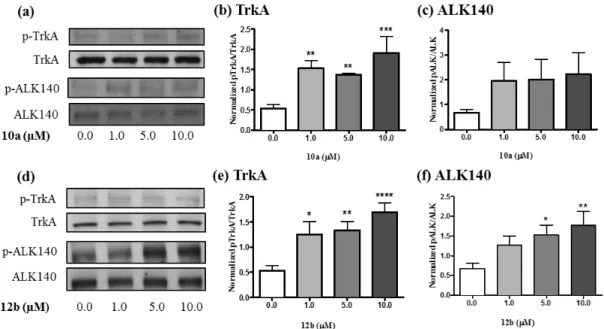
(10) table 2, 10a and 12b strongly and selectively inhibit PTPRZ1. Compound 4c, although less potent, displays a remarkable selectivity against PTP1B. To further study the selectivity of the most potent compounds, we decided to test their effects on the phosphorylation levels of specific substrates of PTPRZ1 in an in vitro biological assay. As relevant substrates of PTPRZ1, we chose TrkA23 and anaplastic lymphoma kinase (ALK)18 because they are known to be involved in the neuroprotective effects of PTN, the endogenous inhibitor of PTPRZ1.9 We used neuroblastoma SH-SY5Y cells, which are known to express PTPRZ1.24 We stimulated SHSY5Y cells with different concentrations of 10a and 12b (1.0, 5.0 and 10.0 µM) for 20 minutes, and evaluated using western blots the phosphorylation of those specific tyrosine residues in TrkA (Tyr490) and ALK (Tyr1278), which are involved in the activation of both proteins. It has to be noted that previous evidence suggests that PTPRZ1 preferentially dephosphorylates Y674 and/or Y675.23 However, we chose to study Y490 because phosphorylation of this residue results in a cascade of molecular events and survival effects in vitro that resembles the ones found in PTNstimulated cells.10c We chose to study ALK (Tyr1278) because treatment of SH-SY5Y cells with midkine (MK), the only other member of the PTN family of cytokines that also binds PTPRZ1 and inhibits its phosphatase activity,25, causes a significant increase in the phosphorylation of ALK (Tyr1278) in SH-SY5Y cells.26 We chose these concentrations of the inhibitors as relevant for the subsequent functional studies described below. Western blots probed with anti-phosphoTrkA antibodies demonstrated that steady state levels of tyrosine phosphorylation of TrkA increased 2-3-fold after treatment with both 10a and 12b (Figure 1). Western blots probed with anti-phospho-ALK antibodies demonstrated that both compounds caused a 2-fold increase in the phosphorylation of one isoform of ALK (the 140 kDa protein27) (Figure 1).. 10.
(11) Figure 1. (a) Representative western blots showing 10a-induced increases in phosphorylated TrkA (pTrkA) and the 140 kDa ALK isoform (pALK). Total TrkA and ALK western blots are shown below each phosphorylated protein blot for comparison. (b–c) Quantification of western blots using ImageJ. (d) Representative western blots showing 12b-induced increases in pTrkA and pALK. Total. (e-f) Quantification of western blots using ImageJ. Data are presented as mean ± S.E.M. *p < 0.05, **p < 0.01, ***p < 0.001, ****p < 0.0001 compared to vehicle controls (0.0 µM). The data clearly demonstrate that two of the inhibitors, 10a and 12b, significantly increase the phosphorylation of key tyrosine residues of the PTPRZ1 substrates TrkA and ALK, in agreement with their IC50 values (Table 2). It is interesting to note that TrkA is the high affinity nerve growth factor (NGF) receptor. NGF activates the kinase activity of TrkA by increasing the phosphorylation of Y490 in TrkA, which is critical for NGF-induced survival and neuroprotective effects.28 Increased phosphorylation of Y1278 in ALK is also involved in neuronal survival and differentiation.9 The data suggest that the ability of PTPRZ1 inhibitors to increase the. 11.
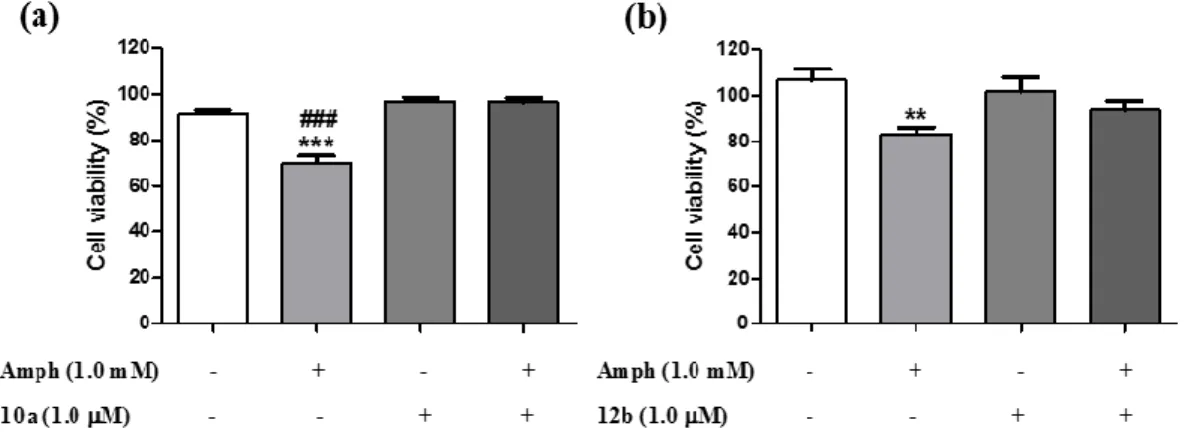
(12) phosphorylation of the same residues in TrkA and ALK, by inhibiting the phosphatase activity of PTPRZ1 on its substrates, will induce similar neuroprotective effects. Accordingly, the endogenous inhibitor of the phosphatase activity of PTPRZ1, PTN, has been shown to prevent amphetamine-induced neuronal injury in vitro and in vivo.10b,. 10c. To test the possibility that. PTPRZ1 inhibitors could protect cell cultures from amphetamine-induced toxicity, we used catecholaminergic PC12 cells, which express readable levels of PTPRZ1.29 PC12 cells were incubated for 24 hours with amphetamine (1 mM) and/or 10a or 12b (1.0 μM). Interestingly, 10a significantly prevented amphetamine-induced loss of PC12 cell viability (Figure 2a) and the same trend was observed with 12b (p = 0.06). These data demonstrate that PTPRZ1 inhibitors mimic the protective effects of PTN against amphetamine-induced toxicity in PC12 cells.10c. Figure 2. Effects of 10a and 12b on amphetamine-induced toxicity in PC12 cells. PC12 cells cultured with media supplemented with amphetamine (Amph; 1 mM) and/or 10a (1.0 μM) and/or 12b (1.0 μM) for 24 hours. Cellular viability was assessed by the MTT test. Results are expressed as mean ± S.E.M. **p < 0.01, ***p < 0.001 vs. vehicle-treated (control) cells.. ###. p<. 0.001 vs. Amph+10a-treated cells.. Permeability Studies. 12.
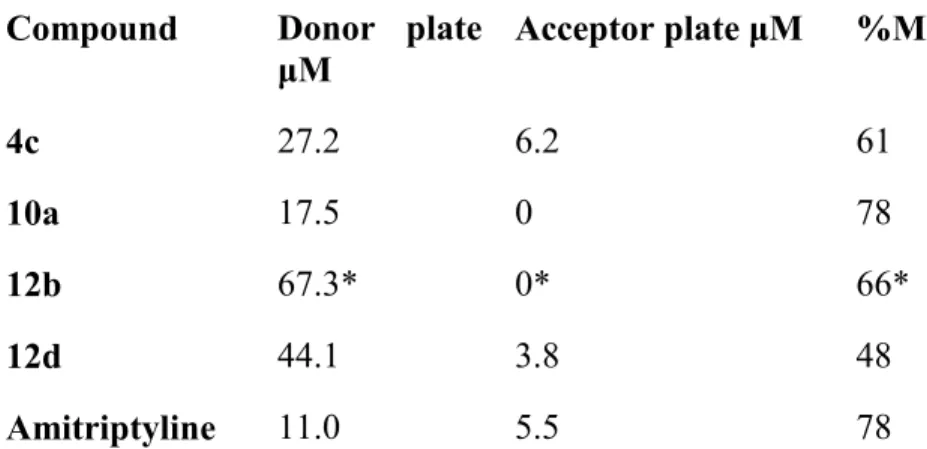
(13) To test the ability of the designed compounds to cross the BBB, two parallel experiments were performed. On one hand, compound 10a was selected for a direct detection in mice plasma and brain tissue samples. On the other hand, the most active compounds (4c, 10a, 12b and 12d) were selected to carry out the predictive, but more accessible, parallel artificial membrane permeability assay for the blood-brain barrier (PAMPA-BBB). For the direct detection, samples were obtained from mice sacrificed 1h post-gavage with 60 mg/kg of 10a and analyzed by GC-MS. Extracted ion chromatograms (EIC) showed the presence of a peak at the same retention time as a standard 10a solution, in both plasma and brain samples, while this peak was not present in samples from untreated mice. A preliminary quantification of the permeability has been carried out, showing that the estimated concentration of 10a in brain samples is of 500-1000 ng/mL, while the concentration in plasma is 100-300 ng/mL. This in vivo result clearly demonstrates that 10a can cross the BBB and penetrate the CNS. For the PAMPA-BBB assay, amitriptyline was used as a positive control. Compounds were added at 100 μM in the acceptor plate (200 μM for 12b) and after 4 h of incubation at 37 ºC, the final concentration in the donor plate, acceptor plate and the membrane retention (%MR) were measured by HPLC (Table 3). Compounds 4c and 12d exhibit amitriptyline-like permeation through the artificial membrane. However, compounds 10a and 12b appear not to be permeable under the used conditions. Considering that the in vivo experiment described above demonstrates that 10a reaches plasma and brain tissue, we are confident that, at least compounds 4c, 10a and 12d would be suitable for the development of orally administered CNS drugs. This is clearly supported by behavioural studies from our group. We have recently shown that treatment with 10a completely blocked alcohol-induced reward in mice30 and modulation of the rewarding effects of drugs of abuse such alcohol, requires direct actions in the brain.. 13.
(14) Table 3. PAMPA-BBB assay for compounds 4c, 10a, 12b and 12d. Compound. Donor plate Acceptor plate μM μM. %MR. 4c. 27.2. 6.2. 61. 10a. 17.5. 0. 78. 12b. 67.3*. 0*. 66*. 12d. 44.1. 3.8. 48. Amitriptyline. 11.0. 5.5. 78. *. 200 μM concentration of the compound in the donor plate.. Computational studies Despite its biological interest, PTPRZ1 has not been thoroughly studied to date as a druggable target. The first crystal structure obtained for PTPRZ1 was deposited as 5AWX.19 However, inhibitors failed to crystalize along with the protein. To consider several conformations of the target macromolecule, together with the available apo form (5AWX), a computational study was carried out. Since no crystal structure was available for holo conformations of PTPRZ1, homology models were built using Receptor-type Tyrosine-Protein Phosphatase Gamma (PTPRG)19 as a template, based on the 73.61% of sequence homology between both phosphatases.31 PTPRZ1 belongs to the receptor-associated Class I PTP subfamily, which contains a highly conserved phosphatase domain (PD1) and a cysteine in the active site.32 The general structure of the PD1 is constituted by an active site motif C(X)5R33 and several surrounding loops implicated in the catalytic cycle and substrate recognition process. The WPDloop plays an acid-base role, carried out by the Trp-Pro-Asp motif and therefore is implicated in the recycling of the active site. The pTyr-loop34 is implicated in the recognition of the. 14.
(15) phosphotyrosine substrate; and the Q-loop, has a relevant role in the activation of a key water molecule during the catalytic cycle. The templates used for the homology modeling can be classified according to the different conformations of the WPD-loop as follows: i) closed conformation: when the phosphatase domain is bound to a substrate-like ligand35 or a competitive inhibitor (PDB code 3QCC)35,36 ii) a “superopen” conformation: when the phosphatase is bound to an inhibitor that alters the overall conformation of the WPD-loop (PDB code 3QCH)35 by acting as a wedge between the WPD-loop and the rest of the protein; and iii) open conformation: when the protein is in the apo form (PDB code 5AWX).33,37 Models for PTPRZ1 were generated with the SWISS-MODEL web server38 as described elsewhere.31 They were subsequently used for docking experiments carried out as described in the experimental section, using compounds 4c, 4d, 5b, 10a, 12b and 12d, as ligands. The highest docking scores for all compounds inside the different conformations of PTPRZ1 were obtained for the “superopen” conformation. The general binding mode predicted for these compounds implies the enclosing of the trifluoromethylthiobenzyl moiety within the hydrophobic pocket that is accessible by the displacement of the WPD-loop. Among the amino acids that line the hydrophobic pocket, the main van der Waals interactions are established between the trifluoromethylthiobenzyl moiety and the aromatic side chains of Trp1989 and Phe1984, and the aliphatic and cycloaliphatic side chains of Arg1939 and Pro1905, respectively. The rest of the molecule, in all cases, interacts with the surroundings of the WPD-loop and the active site, with no direct interaction with the catalytic site (Table S1 and Figures S2, see Supporting Information). To assess the stability of the proposed binding modes, 10 ns molecular dynamics (MD) simulations were carried out for all complexes. Binding energies were analyzed making use of. 15.
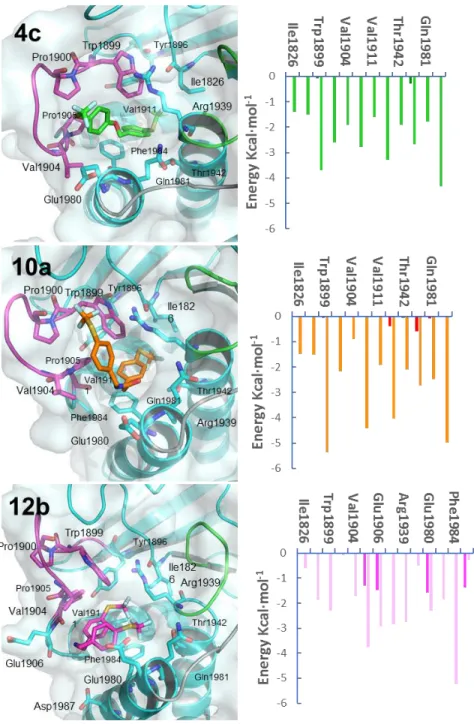
(16) the fast and versatile MM-ISMSA program.39 Results confirm the complexes stability in the “superopen” conformation for all compounds bound to PTPRZ1 as can be seen by the stable RMSD values (Table S2 and Figure S3, see Supporting Information). Given their high selectivity and drug-like properties, the binding modes for 4c, 10a and 12b were intensively inspected, and the most populated conformations explored during 97% (4c), 78% (10a) and 77% (12b) of the simulation time, respectively, were selected for the per-residue energy decompositions (Figure 3). Results show that the previously described van der Waals interactions established with the hydrophobic pocket in the initial docking binding models are maintained during most of the simulation time for the three complexes and that those having a higher energetic contribution are the π–π stacking and T-shaped interactions established between the trifluoromethylthiobenzyl moiety of the ligands and the aromatic side chains of Phe1984 and Trp1889. Furthermore, compound 4c interacts strongly with the side chains of Pro1900, Val1904 and the aliphatic part of the side chain of Glu1980 of the WPD-loop. In addition, the amide moiety of 4c stablishes alternating hydrogen bonding interactions to either the side chain NH of Gln1981 or the backbone carbonyls of Pro1905 and Glu1980. In the complex of 10a with PTPR1Z, the hydrophobic interactions persist, whereas electrostatic interactions are weaker, since the previously described hydrogen bonds cannot be established. This binding mode is shared by all the other studied compounds in their most populated conformers except for 12b-PTPRZ1 complex, because of its protonated state. Compound 12b can stablish strong interactions between the positively charged amine moiety and the side chains of Glu1980 and Asp1987 and with the backbone carbonyl of Glu1906, all three located at the entrance of the hydrophobic pocket. Furthermore, compound 12b, due to its high flexibility, folds to establish an intramolecular π–π interaction between the two trifluoromethylthiobenzyl moieties. In this folded conformation,. 16.
(17) compound 12b establishes van der Waals interactions between the trifluoromethylthiobenzyl moieties and the hydrophobic residues that line the hydrophobic pocket, some of which are located in the WPD-loop (Figure S4, see Supporting Information). With the aim of rationalizing the high selectivity displayed by 4c, 10a and 12b, the same computational approach was carried out for PTP1B. The PTP1B structures were obtained from the PDB in the closed and open conformation (PDB codes 1PTY and 3A5J, respectively) and a homology model for the “superopen” conformation was built using as template PDB structure 3QCH. Docking calculations were carried out as described previously and, in this case, the highest docking scores were obtained for all compounds bound to the closed conformation of PTP1B (Table S1, see Supporting Information) where they share an overall similar binding mode (Figure S5, see Supporting Information). Corresponding 10 ns MD simulations were carried out and the binding modes were further analyzed. Lower affinity towards PTP1B were found, as demonstrated by the unstable binding modes calculated through MM-ISMSA and the shifting RMSD values, that are comparatively higher than the ones obtained for the PTPRZ1 complexes (Table S2 and Figure S3, see supplementary material). It is noteworthy that the only stable binding modes in PTP1B, which have the most similar RMSD fluctuations if compared to those of PTPRZ1 complexes, are shown by compounds 4d and 5b along with 4c. The other compounds fluctuate during the MD simulation and slowly unbind from the original binding mode, resulting in completely different conformations that can be extracted from the MD simulations (Figure S6, see Supporting Information). The per-residue energy decompositions of the complexes between PTP1B and 4c, 10a and 12b were also carried out. The 4c-PTP1B complex showed worse energy interactions compared to those found for PTPRZ1. The main interactions established by compound 4c are with Tyr46, Asp48 and Val49 from the described P-. 17.
(18) loop, Phe182 from the WPD-loop, Ser216 and Ala217 from the active site, and Gln262 from the Qloop (Figure S7, see Supporting Information). Meanwhile, compound 10a in complex with PTP1B, presented no stable binding mode during the simulations, which resulted in an unbounding from the active site, clearly observed by the rising RMSD values after 1.4 ns of the MD simulation and the reduced per-residue interactions of the binding. The complex of 12b and PTP1B rendered no stable binding within the active site during the simulation. Nevertheless, after ~ 2.5 ns 12b moves away from the active site and establishes a strong hydrogen bonding interaction between the protonated amine and the side chain of the Gln262 present in the Q-loop, which is maintained throughout the rest of the simulation (Figures S4 and S7, Supporting Information). These results clearly account for the lower affinity towards PTP1B displayed by compounds 4c, 10a and 12b, and most importantly, they are in complete agreement with the remarkable PTPRZ1/PTP1B selectivity profile described above.. 18.
(19) Figure 3. Proposed binding modes of 4c, 10a and 12b inside PTPRZ1. (Left) PyMOL stick and cartoon representation of the proposed binding modes for 4c, 10a and 12b inside PTPRZ1. Structures shown correspond to the most populated conformations along the MD simulations in the PTPRZ1 superopen conformation. 4c, 10a and 12b are shown in green, orange and light pink sticks, respectively. Residues involved in interactions are shown as sticks. The protein is colored. 19.
(20) cyan and the active site, WPD-loop and Q-loop are highlighted in green, magenta and grey, respectively. (Right) Per-residue energy decomposition of each complex with PTPRZ1. Orange, green and pale magenta bars represent the van der Waals contributions and deep green, red and magenta bars represent electrostatic binding energies for 4c, 10a and 12b.. CONCLUSION. PTN has a protective role in the CNS through its interaction with PTPRZ1. The interaction of PTN with PTPRZ1 inactivates its intrinsic tyrosine phosphatase activity, increasing the phosphorylation level of substrates which are crucial to prevent neurodegenerative and drug addiction disorders. In this work, we have designed and synthesized a series of small molecules capable of mimicking the activity of PTN, by interacting with the active site of the intracellular domain PD1 of PTPRZ1. The most active compounds 10a and 12b (IC50 = 0,1 M) are selective against PTP1B, and significantly increase the phosphorylation of key tyrosine residues of TrkA and ALK, two PTPRZ1 substrates involved in neuronal survival and differentiation. Moreover, both compounds mimic the PTN protective effects against amphetamine-induced toxicity in PC12 cells. Docking and MD experiments have allowed to propose the binding mode of all these compounds inside PTPRZ1 and assess the stability of the corresponding complexes along the simulation time. More importantly, these methods have allowed to explain the remarkable PTPRZ1/PTP1B selectivity displayed by 4c and 10a.. 20.
(21) We have demonstrated that these compounds can cross the BBB and, therefore, we propose them as promising candidates for the development of new drugs for the treatment of CNS disorders, such as addictive and neurodegenerative diseases.. EXPERIMENTAL SECTION. Chemistry Materials. All reagents and solvents were obtained from different commercial sources (SigmaAldrich, Fluka, Acros Organics, Alfa Aesar or Scharlab) and used without further purification. Tetrahydrofuran and dichloromethane were dried by the solvent purification system Technical Bulletin AL-258. General. Methods.. Reaction. progress. was. monitored. using. analytical. thin-layer. chromatography (TLC) on Merck silica gel 60 F-254 plate. Visualization was achieved by UV light (254 nm). Flash chromatography was performed with Scharlau silica gel 60 (0.04-0.06 mm) packing. 1H and. 13. C spectra were recorded on a Bruker Advance III 400 MHz instrument.. Signals are quoted as s (singlet), d (doublet), t (triplet), q (quartet) or m (multiplet). Chemical shifts (δ) are expressed in parts per million relative to solvent resonance as the internal standard. Coupling constants (J) are in hertz (Hz). Elemental analyses were performed by the Microanalytical Service Laboratory of the Universidad Complutense (Madrid) on a LECO CHNS-932 apparatus. Melting points were determined on a Stuart Scientific (BIBBY) melting point apparatus. Mass spectrometry was performed by the CEMBIO Analytical Service Laboratory of the Universidad CEU San Pablo on a MS/IT Esquire 3000 Bruker Daltonics apparatus. All final products were analyzed for purity by reverse-phase high-performance liquid. 21.
(22) chromatography (HPLC) on Agilent Technologies 1260 Infinity II apparatus. HPLC methods used for each compound shown in supporting information. 1-((Trifluoromethyl)sulfonyl)-4-((4-((trifluoromethyl)sulfonyl)benzyl)oxy)benzene (1). To a solution of 10a (153 mg, 0.39 mmol) in dry DCM (10 mL) was added MCPBA (688 mg, 3.98 mmol). The reaction mixture was stirred at 80 ºC for 48 h in a sealed tube. The crude was washed with NaOH 1M, brine and dried (MgSO4). The drying agent was filtered off and the solvent was evaporated. The crude was purified by column chromatography on silica gel using hexane-EtOAc as eluent (8 : 2 v/v) to afford 120 mg (67%) of 1 as a white solid. Mp. 139-141 ºC. 1H NMR (400 MHz, CDCl3): δ 8.11 (d, J = 8.2 Hz, 2H, ArH), 8.02 (d, J = 8.9 Hz, 2H, ArH), 7.76 (d, J = 8.2 Hz, 2H, ArH), 7.21 (d, J = 8.9 Hz, 2H, ArH), 5.33 (s, 2H, -CH2). 13C NMR (100 MHz, CDCl3): δ 164.6, 144.9, 133.5, 131.4, 131.4 (“q”, J = 2 .0 Hz), 128.3, 123.4 (q, J = 2.0 Hz), 112.0 (q, JCF = 325.8 Hz), 112.0 (q, JCF = 325.8 Hz), 116.1, 69.3. HPLC Purity >98%, tR= 4.436, Method 1. Anal. calcd for C15H10F6O5S2 requires C, 40.18; H, 2.25; S, 14.30; found C, 40.39; H, 2.42; S, 14.12. 4-((Trifluoromethyl)thio)-N-(4-((trifluoromethyl)thio)phenyl)benzamide. (4a).. To. a. solution of K2CO3 (174 mg, 1.26 mmol) in 4 mL of dry THF at 0 ºC were subsequently added 11a (100 mg, 0.42 mmol) and aniline 3a (128 mg, 0.66 mmol). The resulting mixture was stirred at RT under argon till completion was seen by TLC (20 h). The solvent of the reaction was evaporated and the residue was suspended in H2O. The aqueous layer was extracted with EtOAc, and the combined organic layers were washed with 1M HCl and brine, dried (MgSO4), filtered and evaporated to give 4a as a white solid (31 mg, 19%). Mp. 162-164 ºC (hexane/EtOAc). 1H NMR (400 MHz, CDCl3): δ 7.91 (d, J = 8.4 Hz, 2H, ArH), 7.87 (s, 1H, -NH), 7.80 (d, J = 8.4 Hz, 2H, ArH), 7.73 (d, J = 8.8 Hz, 2H, ArH), 7.68 (d, J = 8.8 Hz, 2H, ArH).. 13. C NMR (100. 22.
(23) MHz, CDCl3): δ 164.8, 140.2, 137.8, 136.7, 136.4, 129.6(q, JCF = 308.3 Hz), 129.4 (q, JCF = 308.3 Hz), 129.3 (q, J = 2.0 Hz), 128.2, 120.8, 119.9(q, J = 2.0 Hz). HPLC Purity >98%, tR= 4.734, Method 5. LC/MS (ESI) m/z 398.0 [M+H]+. Anal. calcd for C15H9F6NOS2 requires C, 45.34; H, 2.28; N, 3.52; S, 16.14; found C, 44.58; H, 2.22; N, 3.74; S, 15.92. N-2-Bis(4-((trifluoromethyl)thio)phenyl)acetamide (4b). To a solution of acid 2b (200 mg, 0.64 mmol) in 2.5 mL of DMF were added HOBt (104 mg, 0.77 mmol), EDCI (139 mg, 0.90 mmol) and the corresponding aniline 3a (247 mg, 1.28 mmol). The resulting mixture was stirred at RT till completion was seen by TLC (72 h). The mixture was then diluted with EtOAc and washed with NaHCO3 saturated solution, NH4Cl and brine. The organic layer was dried (MgSO4), filtered and evaporated to give 4b as a white solid (208 mg, 78%). Mp. 163-165 ºC (hexane/EtOAc). 1H NMR (400 MHz, CDCl3): δ 7.69 (d, J = 7.9 Hz, 2H, ArH), 7.59 (d, J = 8.5 Hz, 2H, ArH), 7.54 (d, J = 8.5 Hz, 2H, ArH), 7.41 (d, J = 7.9 Hz, 2H, ArH), 7.18 (s, 1H, -NH), 3.78 (s, 2H, -CH2). 13C NMR (100 MHz, CDCl3): δ 168.3, 140.1, 137.6, 137.1, 130.7, 129.6 (q, JCF = 308 Hz), 129.6 (q, JCF = 308 Hz), 124.1 (q, J = 2.0 Hz), 120.4, 119.5 (q, J = 2.0 Hz), 44.5. HPLC Purity >98%, tR= 3.690, Method 5. LC/MS (ESI) m/z 412.00 [M+H]+. Anal. Calcd. For C16H11F6NOS2 requires C, 46.71; H, 2.70; N, 3.40; S, 15.59; found C, 46.39; H, 2.72; N, 3.74; S, 15.40. N-(4-((Trifluoromethyl)thio)benzyl)-2-(4-((trifluoromethyl)thio)phenyl)acetamide. (4c).. To a solution of 2b (200 mg, 0.64 mmol) in 2.5 mL of DMF were added HOBt (104 mg, 0.77 mmol), EDCI (139 mg, 0.90 mmol) and amine 3b (199 mg, 0.96 mmol). The resulting mixture was stirred at RT till completion was seen by TLC (72 h). The mixture was then diluted with EtOAc and washed with NaHCO3 saturated solution, NH4Cl and brine. The organic layer was dried (MgSO4), filtered and evaporated to give 4c as a white solid (105 mg, 39%). Mp. 124-126. 23.
(24) ºC (hexane/EtOAc). 1H NMR (400 MHz, CDCl3): δ 7.65 (d, J = 8.1 Hz, 2H, ArH), 7.59 (d, J = 8.1 Hz, 2H, ArH), 7.35 (d, J = 8.2 Hz, 2H, ArH), 7.25 (d, J = 8.1 Hz, 2H, ArH), 5.75 (s, 1H, NH), 4.47 (d, J = 6.0 Hz, 2H, -CH2-NH-), 3.65 (s, 2H, -CH2CO). 13C NMR (100 MHz, CDCl3) δ 170.1, 141.3, 137.9, 137.0, 136.8, 130.6, 129.6 (q, JCF = 308.2 Hz), 129.6 (q, JCF = 308.2 Hz), 128.6, 123.7 (q, J = 2.1 Hz), 123.6 (d, J = 2.1 Hz), 43.2, 43.1. HPLC Purity >97%, tR= 3.073, Method 6. LC/MS (ESI) m/z 425.9 [M+H]+. Anal. Calcd. For C17H13F6NOS2 C, 48.00; H, 3.08; N, 3.29; S, 15.07 found C, 48.22; H, 3.18; N, 3.51; S, 15.06. 4-((Trifluoromethyl)thio)-N-(4-((trifluoromethyl)thio)benzyl)benzamide. (4d).. To. a. solution of K2CO3 (87 mg, 0.63 mmol) in 2 mL of dry THF at 0 ºC were subsequently added chloride 2a (50 mg, 0.21 mmol) and amine 3b (68 mg, 0.33 mmol). The resulting mixture was stirred at RT under argon till completion was seen by TLC (20 h). The solvent of the reaction was evaporated and the residue was suspended in H2O. The aqueous layer was extracted with EtOAc, and the combined organic layers were washed with 1M HCl and brine, dried (MgSO4), filtered and evaporated. To give 4d as a white solid (119.5 mg, 34%). Mp. 117-119 ºC (hexane/EtOAc). 1H NMR (400 MHz, CDCl3): δ 7.84 (d, J = 8.3 Hz, 2H, ArH), 7.74 (d, J = 8.3 Hz, 2H, ArH), 7.65 (d, J = 8.1 Hz, 2H, ArH), 7.41 (d, J = 8.1 Hz, 2H, ArH), 6.48 (s, 1H, -NH), 4.70 (d, J = 5.9 Hz, 2H, -CH2). 13C NMR (100 MHz, CDCl3) δ 166.5, 141.2, 136.9, 136.3, 129.7 (q, JCF = 308.3 Hz), 129.4 (q, JCF = 308.3 Hz), 128.9, 128.7 (q, J = 2.0 Hz), 128.1, 123.8 (q, J= 2.0 Hz), 43.7. HPLC Purity >98%, tR= 4.534, Method 5. LC/MS (ESI) m/z 412.00 [M+H]+. Anal. calcd for C16H11F6NOS2 requires C, 46.71; H, 2.70; N, 3.40; S, 15.59; found C, 46.92; H, 2.68; N, 3.52; S, 15.47. 4-((Trifluoromethyl)sulfonyl)-N-(4-((trifluoromethyl)sulfonyl)phenyl)benzamide. 24.
(25) (5a). To a solution of 4a (65 mg, 0.16 mmol) in dry DCM (10 mL) was added MCPBA (276 mg, 1.6 mmol). The resulting mixture was stirred at 100 ºC in a sealed tube until the reaction was completed (TLC) (72 h). The reaction mixture was washed with NaOH 2M, NaCl sat. and H2O. The organic layer was then dried (MgSO4), filtered and evaporated to give 5a as a white solid (40.6 mg, 55%). Mp. 194-196 ºC (hexane/EtOAc). 1H NMR (400 MHz, CDCl3): δ 8.23 (d, J = 8.4 Hz, 2H, ArH), 8.17 (d, J = 8.4 Hz, 2H, ArH), 8.08 (d, J = 8.8 Hz, 2H, ArH), 8.00 (d, J = 8.8 Hz, 2H, ArH). 13C NMR (100 MHz, DMSO) δ 165.0, 147.0, 142.3, 132.4, 132.2, 131.2, 130.2, 123.0, 120.9, 119.5 (“q”, J = 324.11), 119.4 (“q”, J = 326.40) . HPLC Purity >97%, tR= 4.277, Method 5. LC/MS (ESI) m/z 461.9 [M+H]+. Anal. calcd for C15H9F6NO5S2 requires C, 39.05; H, 1.97; N, 3.04; S, 13.90 found C, 39.17; H, 2.02; N, 3.34; S, 13.68. N,2-bis(4-((trifluoromethyl)sulfonyl)phenyl)acetamide (5b). To a solution of 4b (102 mg, 0.248 mmol) in dry DCM (10 mL) was added MCPBA (428 mg, 2.48 mmol). The resulting mixture was stirred at 100 ºC in a sealed tube until the reaction was completed (TLC) (24 h). The reaction mixture was washed with NaOH 2M, NaCl sat. and H2O. The organic layer was then dried (MgSO4), filtered and evaporated to give 5b as a white solid (80 mg, 68%). Mp. 171-173 ºC (hexane/EtOAc). 1H NMR (400 MHz, CDCl3): δ 8.07 (d, J = 8.3 Hz, 2H, ArH), 8.00 (d, J = 8.9 Hz, 2H, ArH), 7.83 (d, J = 8.9 Hz, 2H, ArH), 7.67 (d, J = 8.3 Hz, 2H, ArH), 7.57 (bs, 1H, NH), 3.97 (s, 2H, -CH2).;. 13. C NMR (100 MHz, CDCl3) δ 167.6, 144.9, 143.0, 132.6, 131.5,. 131.1, 130.8, 125.9,119.9, 119.9 (q, JCF = 325.7 Hz), 119.8 (q, JCF = 325.7 Hz), 44.4. HPLC Purity >97%, tR= 5.674, Method 3. LC/MS (ESI) m/z 475.9 [M+H]+. Anal. Calcd. For C16H11F6NO5S2 requires C, 40.42; H, 2.33; N, 2.95; S, 13.49 found C, 40.14; H, 2.32, N, 3.16; S, 13.32.. 25.
(26) N-(4-((trifluoromethyl)sulfonyl)benzyl)-2-(4-((trifluoromethyl)sulfonyl)phenyl)acetamide (5c). To a solution of 4c (42 mg, 0.1 mmol) in dry DCM (10 mL) was added MCPBA (260 mg, 1.5 mmol). The resulting mixture was stirred at 100 ºC in a sealed tube until the reaction was completed (TLC) (48 h). The reaction mixture was washed with NaOH 2M, NaCl sat. and H2O. The organic layer was then dried (MgSO4), filtered and evaporated to give 5c as a white solid (33 mg, 67%). Mp. 164-170 ºC (hexane/EtOAc). 1H NMR (400 MHz, CDCl3): δ 8.03 (d, J = 8.0 Hz, 2H, ArH), 7.99 (d, J = 8.0 Hz, 2H, ArH), 7.63 (d, J = 7.9 Hz, 2H, ArH), 7.54 (d, J = 7.9 Hz, 2H, ArH), 6.03 (bs, 1H, -NH), 4.60 (d, J = 6.1 Hz, 2H, -CH2NH), 3.77 (s, 2H, -CH2CO).. 13. C NMR. (100 MHz, CDCl3) δ 169.1, 147.7, 140.03, 131.4, 131.0, 130.5, 130.47, 128.95, 119.9 (q, JCF = 323.7 Hz), 43.5, 43.3. HPLC Purity 95%, tR= 4.549, Method 3.. LC/MS (ESI) m/z 489.9. [M+H]+. Anal. Calcd. For C17H13F6NO5S2 requires C, 41.72; H, 2.68; N, 2.86; S, 13.10 found C, 41.58, H, 2.64, N, 3.07; S, 12.99 1-Fluoro-4-((trifluoromethyl)sulfonyl)benzene (7). To a solution of 6 (100 mg, 0.51 mmol) in dry DCM (10 mL) MCPBA (440 mg, 2.55 mmol) was added and the mixture was heated at 80 ºC in a sealed tube for 6 h. The reaction crude was diluted with DCM (10 mL) and the organic layer was washed with NaOH 1 M, brine and dried (MgSO4). The drying agent was filtered off and the solvent was removed at vacuum to give 7 as a light-orange oil. The compound was used in the next reaction without further purification. (Trifluoromethyl)(4-((4-((trifluoromethyl)thio)benzyl)oxy)phenyl)sulfane (10a). To a solution of 8 (303 mg, 1.46 mmol) in 5 mL of dry THF, was added NaH (60%) (42 mg, 1.75 mmol) at 0 ºC under an argon atmosphere. After stirring for 15 min, compound 6 (0.22 mL, 1.53 mmol) was added and the mixture was stirred at RT. The reaction was monitored with TLC until completion (24 h). The solvent was evaporated, the residue was solved in EtOAc, washed with. 26.
(27) brine and H2O, dried (MgSO4), filtered and evaporated. The crude was purified by column chromatography on silica gel using hexane-EtOAc as eluent (9.75 : 0.25 v/v) to afford 10a as a white solid (175 mg, 31%). Mp. 114-116 ºC. 1H NMR (400 MHz, CDCl3): δ 7.69 (d, J = 8.2 Hz, 2H, ArH), 7.59 (d, J = 8.8 Hz, 2H, ArH), 7.48 (d, J = 8.2 Hz, 2H, ArH), 6.99 (d, J = 8.8 Hz, 2H, ArH), 5.12 (s, 2H, -CH2). 13C-NMR (100 MHz, CDCl3): δ 160.8, 139.5, 138.5, 136.8, 129.8 (q, JCF = 308 Hz), 129.7 (q, JCF = 308 Hz), 128.3, 124.4 (q, J = 2.1 Hz), 115.9, 115.8 (q, J = 2.1 Hz), 69.4. HPLC Purity >98%, tR = 5.215, Method 1. Anal. calcd for C15H10F6OS2 requires C, 46.87; H, 2.62; S, 16.68; found: C, 46.82; H, 2.64; S, 16.59. (Trifluoromethyl)(4-((4-((trifluoromethyl)sulfonyl)phenoxy)methyl)phenyl)sulfane (10b). To a solution of 8 (106 mg, 0.51 mmol) in 5 mL of dry DMF, was added NaH (60%) (15 mg, 0.61 mmol) at 0 ºC under an argon atmosphere. After stirring for 15 min, fluorine derivative 7 (116 mg, 0.51 mmol) was added, the mixture was stirred at RT and the reaction was monitored with TLC until completion (2 h). The reaction mixture was poured into a mixture of HCl (1M) / H2O (1:1) and then extracted with DCM. The organic layer was dried (MgSO4), filtered and evaporated. The crude was purified by column chromatography on silica gel using hexane-DCM as eluent (9:1 v/v) to afford 10b as a white solid (121 mg, 31%). Mp. 110-112 ºC. 1H NMR (400 MHz, CDCl3): δ 7.98 (d, J = 8.9 Hz, 2H, ArH), 7.72 (d, J = 8.1 Hz, 2H, ArH), 7.49 (d, J = 8.1 Hz, 2H, ArH), 7.18 (d, J = 8.9 Hz, 2H, ArH), 5.22 (s, 2H, -CH2). 13C NMR (100 MHz, CDCl3): δ 164.8, 138.2, 136.7, 133.4, 129.5 (q, JCF = 308 Hz), 128.3, 124.7 (q, J = 2.0 Hz), 122.7 (q, J = 2.0 Hz), 119.9 (q, JCF = 308 Hz), 115.9, 69.8. HPLC Purity >97%, tR = 7.296, Method 2. Anal. calcd for C15H10F6O3S2 requires C, 43.27; H, 2.42; S, 15.40; found: C, 42.91; H, 2.42; S, 15.28. 4-((4-((Trifluoromethyl)thio)phenoxy)methyl)pyridine (10c). To a solution of 9 (111 mg, 1.02 mmol) in 5 mL of dry DMF, was added NaH (60%) (29 mg, 1.23 mmol) at 0 ºC under an. 27.
(28) argon atmosphere. After stirring for 15 min, derivative 6 (0.15 mL, 1.02 mmol) was added, the mixture was stirred at RT until the reaction was completed (TLC) (72 h). The reaction mixture was poured into a mixture of H2O/Ice and the solution was taken to pH=7 with NaHCO3 saturated solution. The precipitate was then filtered and washed with H2O. The crude was purified by column chromatography on silica gel using hexane-EtOAc as eluent (2: 8 v/v) to afford 10c as a white solid (66 mg, 23%). Mp. 97-99 ºC. 1H NMR (400 MHz, CDCl3): δ 8.63 (d, J = 4.6 Hz, 2H, ArH), 7.59 (d, J = 8.7 Hz, 2H, ArH), 7.34 (d, J = 5.2 Hz, 2H, ArH), 6.98 (d, J = 8.7 Hz, 2H, ArH), 5.11 (s, 2H,-CH2). 13C NMR (100 MHz, CDCl3): δ 160.4, 150.2, 145.3, 138.4, 129.6 (q, JCF = 308.2 Hz), 121.4, 115.9 (q, J = 2.0 Hz), 115.7, 68.3. HPLC Purity >98%, tR = 4.674, Method 3. LC/MS (ESI) m/z 286.0 [M+H]+ . Anal. calcd for C13H10F3NOS requires C, 54.73; H, 3.53; N, 4.91; S, 11.24; found: C, 54.39; H, 3.69; N, 4.95; S, 10.79. 4-((Trifluoromethyl)thio)-N-(4-((trifluoromethyl)thio)benzyl)aniline (12a). To a solution of aldehyde 11a (200 mg, 1.04 mmol) and aniline 3a (214 mg, 1.04 mmol) in dry DCM (10 mL) were added, under argon, NaBH(OAc)3 (438 mg, 2.07 mmol) and CH3COOH (59 μL). The resulting solution was stirred at RT until the reaction was completed (TLC) (6 h). The reaction mixture was neutralized with NaOH 1M aqueous solution, and the organic phase was washed with brine and H2O, dried (MgSO4), filter and evaporated. Column chromatography on silica gel using as eluent hexane-EtOAc (9.5 : 0.5 v/v) gave 12a as a white solid (207 mg, 52%). Mp. 8789 ºC. 1H NMR (400 MHz, CDCl3): δ 7.65 (d, J = 8.1 Hz, 2H, ArH), 7.43 (d, J = 8.8 Hz, 2H, ArH), 7.41 (d, J = 8.1 Hz, 2H, ArH), 6.61 (d, J = 8.8 Hz, 2H, ArH), 4.42 (s, 2H, -CH2). 13C NMR (100 MHz, CDCl3): δ 149.9, 141.9, 138.5, 137.0, 130.0 (q, JCF = 308.1 Hz), 129.8 (q, JCF = 308.1 Hz), 128.5, 123.7 (q, J = 1.8 Hz), 113.6, 111.0 (q, J = 1.8 Hz), 47.6. HPLC Purity >98%, tR=. 28.
(29) 5.010, Method 4. Anal. calcd for C15H11F6NS2 requires C, 46.99; H, 2.89; N, 3.65; S, 16.73; found C, 47.04; H, 2.94; N, 3.72; S, 16.77. Bis(4-((trifluoromethyl)thio)benzyl)amine. hydrochloride. (12b). &. tris(4-. ((trifluoromethyl)thio)benzyl)amine (13). To a solution of aldehyde 11a (237 mg, 1.15 mmol) and amine 3b (0.18 mL, 1.15 mmol) in dry DCM (10 mL) were added, under argon, NaBH(OAc)3 (1459 mg, 6.88 mmol) and CH3COOH (66 µL). The resulting solution was stirred at RT until the reaction was completed (TLC) (72 h). The reaction mixture was neutralized with NaOH 1M aqueous solution, and the organic phase was washed with brine and H2O, dried (MgSO4), filter and evaporated. Column chromatography on silica gel using hexane-EtOAc (gradient from 9.25:0.75 to pure EtOAc) as eluent, gave amines 13 (40 mg, 6%) and 12b (80 mg, 17%). For 13: 1H NMR (400 MHz, CDCl3) δ 7.62 (d, J = 7.9 Hz, 6H, ArH), 7.45 (d, J = 7.9 Hz, 6H, ArH), 3.61 (s, 6H, 3x -CH2). Bubbling HCl(g) through an ethereal solution of the compound and isolation by filtration gave the corresponding hydrochloride (84%). Mp. 115-117 ºC. HPLC Purity >94%, tR= 6.346, Method 5. LC/MS (ESI) m/z 588 [M+H]+ Anal. calcd for C24H19ClF9NS3 requires C, 46.19; H, 3.07; N, 2.24; S, 15.41 found C, 45.23; H, 3.14; N, 2.63; S, 14.81. For 12b: 1H NMR (400 MHz, CDCl3): δ 7.59 (d, J = 7.9 Hz, 4H, ArH), 7.42 (d, J = 7.9 Hz, 4H, ArH); 3.60 (s, 4H, 2 x -CH2). 13C NMR (100 MHz, CDCl3): δ 142.1, 135.5, 128.6 (q, JCF= 309.0 Hz), 128.1, 121.8 (q, JCF= 2.0 Hz), 51.5. Bubbling HCl(g) through an ethereal solution of the compound and isolation by filtration gave the corresponding hydrochloride (87%). Mp. 197-199 ºC. HPLC Purity >98%, tR= 5.108,. 29.
(30) Method 5. LC/MS (ESI) m/z 398.00 [M+H]+. Anal. calcd for C16H14ClF6NS2 requires C, 44.29; H, 3.25; N, 3.23; S, 14.78 found C, 43.82; H, 3.33; N, 3.50; S 14.16. N-benzyl-1-(4-((trifluoromethyl)thio)phenyl)methanamine (12c). To a solution of aldehyde 11c (0.048 mL, 0.483 mmol) and amine 3b (0.08 mL, 0.48 mmol) in dry DCM (5 mL) were added, under argon, NaBH(OAc)3 (204 mg, 0.97 mmol) and CF3COOH (96 µL). The resulting solution was stirred at RT until the reaction was completed (TLC) (48 h). The reaction mixture was neutralized with NaOH 1M aqueous solution, and the organic phase was washed with brine and H2O, dried (MgSO4), filtered and evaporated. Column chromatography on silica gel using as eluent hexane-DCM (gradient from 4:6 v/v to 1:1 v/v) gave 12c (50 mg, 34%). 1H NMR (400 MHz, CDCl3): δ 7.62 (d, J = 8.1 Hz, 2H), 7.42 (d, J = 8.1 Hz, 2H), 7.35-7.27 (m, 5H), 3.85 (s, 2H) 3.82 (s, 2H). 13C NMR (100 MHz, CDCl3): δ 143.5, 139.9, 136.6, 129.8 (q, JCF = 307.0 Hz), 129.3, 128.6, 128.3, 127.3, 122.8 (q, J = 2.0 Hz), 53.3, 52.5. Bubbling HCl(g) through an ethereal solution of the compound and isolation by filtration gave the corresponding hydrochloride (53%). Mp. 244-246 ºC. HPLC Purity >97%, tR= 3.020, Method 4. LC/MS (ESI) m/z 298.00 [M+H]+. Anal. Calcd. For C15H15ClF3NS requires C, 53.97; H, 4.53; N, 4.20; S, 9.61 found C, 53.41; H, 4.40; N, 4.32; S, 9.53. N-benzyl-4-((trifluoromethyl)thio)aniline (12d). To a solution of aldehyde 11c (329 mg, 3.11 mmol) and aniline 3a (0.15 mL, 1.04 mmol) in dry DCM (10 mL) were added, under argon, NaBH(OAc)3 (1974 mg, 9.32 mmol) and CH3COOH (59 µL). The resulting solution was stirred at RT until the reaction was completed (TLC) (72 h). The reaction mixture was neutralized with NaOH 1M aqueous solution, and the organic phase was washed with brine and H2O, dried (MgSO4), filtered and evaporated. Column chromatography on silica gel using as eluent hexaneEtOAc (9.7:0.4 v/v) gave the 12d (83 mg, 73%). 1H NMR (400 MHz, CDCl3): δ 7.45 (d, J = 8.6. 30.
(31) Hz, 2H, ArH), 7.39-7.33 (m, 5H, ArH), 6.63 (d, J = 8.6 Hz, 2H, ArH), 4.37 (s, 2H, -CH2). 13C NMR (100 MHz, CDCl3): δ 150.3, 138.5, 138.3, 129.9, (q, JCF = 308.0 Hz), 128.9, 127.7, 127.6, 113.3, 110.1 (q, J = 2.0 Hz), 48.0. Bubbling HCl(g) through an ethereal solution of the compound and isolation by filtration gave the corresponding hydrochloride (27%). Mp. 146-148 ºC. HPLC Purity >98%, tR= 4.601, Method 5. LC/MS (ESI) m/z 284.00 [M+H]+. Anal. calcd for C14H13ClF3NS requires C, 52.58; H, 4.10; N, 4.38; S, 10.03; found C, 52.22; H, 4.04; N, 4.48; S, 10.12. N-(4-chlorobenzyl)-4-((trifluoromethyl)thio)aniline (12e). To a solution of aldehyde 11b (437 mg, 3.11 mmol) and aniline 3a (0.15 mL, 1.04 mmol) in dry DCM (10 mL) were added, under argon, NaBH(OAc)3 (1091 mg, 5.18 mmol) and then CH3COOH (1.05 mL). The resulting solution was stirred at RT until the reaction was completed (TLC) (48 h). The reaction mixture was neutralized with NaOH 1M aqueous solution, and the organic phase was washed with brine and H2O, dried (MgSO4), filtered and evaporated. Column chromatography on silica gel using as eluent hexane-DCM (9.8:0.2 v/v) gave 12e (160 mg, 49%). 1H NMR (400 MHz, CDCl3): δ 7.44 (d, J = 8.6 Hz, 2H, ArH), 7.34 (d, J= 8.5 Hz, 2H, ArH), 7.29 (d, J = 8.5 Hz, 2H, ArH), 6.60 (d, J = 8.7 Hz, 2H, ArH) 4.39 (“t”, J= 5.4 1H, -NH), 4.39 (d, J= 5.42 Hz, 2H, -CH2). 13C NMR (100 MHz, CDCl3): δ 150.0, 138.4, 137.1, 133.4, 129.8 (q, JCF = 308 Hz), 128.7, 128.4, 110.4 (q, J = 2 Hz), 47.3. Bubbling HCl(g) through an ethereal solution of the compound and isolation by filtration gave the corresponding hydrochloride (68%). Mp. 170-172 ºC. HPLC Purity >98%, tR= 4.787, Method 5. LC/MS (ESI) m/z 318.00 [M+H]+. Anal. calcd for C14H12Cl2F3NS requires C, 47.47; H, 3.41; N, 3.95; S, 9.05; found: C, 48.16; H, 3.26; N, 4.07; S, 9.18.. Molecular Modelling. 31.
(32) The crystal structure of PTPRZ1 in the open conformation was obtained from the Protein Data Bank deposited under the accession code 5AWX. Homology models for the closed and “superopen” conformations of PTPRZ1 were built using the SWISS-MODEL web server40 and using the phosphatase domain (PD1) of PTPRG in the PDB structures 3QCC and 3QCH, respectively, as templates. The crystal structures of the open (PDB code 3A5J) and closed (PDB code 1PTY) conformations of PTP1B were used, and the homology model of the “superopen” conformation of PTP1B was also built using the PDB structure 3QCH as template. Using. the. Protein. Preparation. Wizard. module. of. the. Schrödinger. Suite. (http://www.Schrodinger.com), missing chains and residues were added to the crystal structures and the receptor geometries were optimized. The protonation states of charged amino acids were calculated with the PROPKA module of the Schrödinger Suite, and the catalytic cysteine is protonated in all PTPRZ1 and PTP1B structures. The described ligands were built with the LigPrep module of Maestro, generating all possible states at pH 7 +/- 2. Receptor grid was calculated using the catalytic cysteine as the center of the 13Å-size box that enclosed the catalytic site and the induced pocket from the superopen conformation, ensuring all possible ligand poses. Docking calculations were performed using extra precision (XP) mode of the GLIDE module and a van der Waals radii scale factor of 1.0/0.8. The best ligand poses were considered for further analysis of the ligand-receptor interactions using molecular dynamics (MD) simulations. For the selected compounds, geometry optimization and charge distributions were calculated quantum mechanically (RHF/3-21G*//RHF/6-31G**) with Gaussian 03.41 MD simulations for each complex in the lowest energy docking pose for PTPRZ1 and PTP1B were carried out with the general AMBER14 (http://ambermd.org/) force field and the GAFF force field for the. 32.
(33) parametrization of the small molecules.42 Systems were introduced in a truncated octahedron box of approximately 10 000 TIP3P water molecules with 13 Å cut-off distance and adding from 2 or 15 chlorine ions depending on the system. Smooth particle mesh Ewald (PME)43 method with a spacing grid of 1Å was used for electrostatic interactions and SHAKE algorithm applied to all hydrogen bonds with 2.0 fs integration step.44 An initial energy minimization of the water molecules and counter-ions was carried out on each system. The systems were further heated from 100K to 300K in 25 ps, and solvent molecules progressively allowed to move freely. To explore the complex between ligand and macromolecule 10 ns MD simulations where carried out without any restraints, generating snapshots each 20 ps for further analysis. The trajectories were collected and the cpptraj module45 of AMBER14 was used to calculate the root mean square deviation (RMSD) of the atomic positions of the ligands and the most populated conformers. The MM-ISMSA program was used to calculate the total binding energies for each complex 39 giving the complex per-residue energy decomposition.. Biological Assays ELISA HeLa cells were cultured in RPMI-1640 medium (Sigma, Spain) supplemented with 10% fetal bovine serum (FBS; Sigma-Aldrich, Madrid, Spain), 0.005% Penicillin-Streptomycin and 0.005% Glutamine. Trypsin/EDTA (Sigma-Aldrich, Madrid, Spain) was used to release cells for subculturing. When cells reached 90% confluence they were seeded in 96 well-plates at 2 x 10⁴ cells per well in triplicates. After 24 h of serum starvation, HeLa cells were treated for 10 min with 50 ng/mL epidermal growth factor (EGF; Sigma-Aldrich, Madrid, Spain) as a positive control to induce tyrosine phosphorylation. Cells were treated for 10 min with three different. 33.
(34) concentrations of each compound (10.0, 1.0 and 0.1 µM) and control 0.25% DMSO. A tyrosine phosphorylation ELISA Kit (Raybiotech, Norcross, GA, USA) was used following the manufacturer’s instructions.. In vitro dephosphorylation assays Human recombinant PTPRZ1 and PTP1B proteins were purchased from Sigma (Madrid, Spain). The inhibitory activities of the studied compounds were determined using the phosphate sensor reagent (Thermofisher, Waltham, MA, USA),46 using p-NPP (Sigma-Aldrich, Madrid, Spain) as substrate. PTPRZ1 and PTP1B were used at a concentration of 0.1 µM. Increasing concentrations of the different compounds were used (0.001-100 µM) to calculate the IC50. In each experiment, the hydrolysis of the p-NPP residue was determined as an increase in fluorescence at 450 nm (excitation at 430 nm) using a Hitachi F4500 Fluorescence Spectrometer.. Western-blots The human neuroblastoma cell line SH-SY5Y was purchased from American Type Culture Collection (ATCC, Manassas, VA, USA) and was incubated at 37 °C in 5% CO2. SH-SY5Y cells were cultured in a 1:1 mixture of Eagle’s minimum essential medium (EMEM) and F12 medium containing 10% FBS. Just before treatments, medium was changed to 1:1 mixture of EMEM and F12 medium without serum. Cells were treated with 10a and 12b (1.0, 5.0 and 10.0 µM) and DMSO vehicle for 20 min. Cells were lysed in 20 mM Tris-HCl, pH 7.5, 150 mM NaCl, 1 mM EDTA, 1 mM EGTA, 1% Triton X-100, 2.5 mM sodium pyrophosphate, 1 mM βglycerophosphate, leupeptin, 1 µg/mL aprotinin, and EDTA-free Complete Protease Inhibitor Cocktail tablets (Roche Diagnostics, Indianapolis, IN, USA). Lysate protein concentration was. 34.
(35) determined using the BCA Protein Assay Kit (Pierce, Rockford, IL, USA) and equal amounts of protein (20 µg) were subjected to sodium dodecyl sulfate–polyacrylamide gel electrophoresis and transferred to polyvinylidene difluoride membranes. Membranes incubated with antiphospho-TrkA (Y490) and anti-phospho-ALK (Y1278) antibodies and reprobed with anti-TrkA (Upstate, Charlottesville, VA) and anti-ALK (Life Technologies, Carlsbad, CA) antibodies to confirm the identities of the proteins. Secondary antibodies were horseradish peroxidaseconjugated goat anti-mouse or anti-rabbit IgG. The membranes were developed with enhanced chemiluminescence detection reagents (Pierce, Rockford, IL, USA). Films were scanned using a Chemidoc System (Bio-Rad, Madrid, Spain) and densitometry was performed with ImageJ software.. Cell viability Rat pheochromocytoma PC12 cells (ATCC, Manassas, VA, USA) were cultured with RPMI1640 Medium supplemented with 10% FBS in 96-well plates (104 cells/well). To test the effects of 10a and 12b on amphetamine-induced toxicity in cell cultures, PC12 cells were incubated for 20 h with amphetamine (1.0 mM) and 10a or 12b (1.0 μM). Cellular viability was studied with the MTT assay (Sigma-Aldrich, Madrid, Spain). Briefly, cells were washed with PBS and incubated in fresh medium including 20 µL of 5 mg/mL MTT. MTT solution was removed after 4 h of incubation, DMSO added into each well and the plate was shaken for 10 min at RT. Absorbance was determined at 570 nm in a Versamax microplate reader (Bionova, Madrid, Spain).. Statistics. 35.
(36) Data from Western blots and cell viability assays are presented as mean ± standard error of the mean (S.E.M.). Data were analyzed using one-way ANOVA followed by post-hoc comparisons with Tukey’s post-hoc tests. P < 0.05 was considered as statistically significant. All statistical analyses were performed using Graph-Pad Prism program (San Diego, CA, USA).. In vivo compound detection Compound detection in plasma and brain tissue was performed using GC-MS analysis (Agilent 7890A gas chromatograph coupled to an Agilent 7200 accurate mass high resolution GC/QToF). Separation was performed using an Agilent DB-5ms + DG capillary column (30 m x 0.25 mm i.d., 0.25 µm film thickness + 10 m Duraguard) using Helium as carrier gas. Mass analysis was operated on EI conditions, recording data in full-scan mode at 70 eV in a mass range of m/z 50 to 600. Ion source, quadrupole and transfer line temperatures were 250 ºC, 150 ºC and 290 ºC respectively. The oven temperature program was: from 60 ºC (1 min) to 325 ºC (hold 10 min) at 20 ºC/min. Reliability of the method was based on the detection of a standard solution of 10a at a concentration of 2 mg/mL in ethanol. Then, a working standard solution was prepared by dilution of this stock solution at 5 μg/mL in heptane. Subsequent working solutions of the analyte were prepared by serial half dilution with heptane. Biological samples were processed depending on their nature: i) frozen mouse brain tissues (50–100 mg) were placed in tubes containing CK14 ceramic beads from Precellys. ethyl acetate was added to each sample as extraction solvent and homogenization performed in a Precellys 24 Dual system equipped with a Cryolys cooler. Supernatants were evaporated to dryness in a speedvac concentrator and reconstituted in heptane before injection; ii) 100 μL of mouse plasma. 36.
(37) samples were subjected to standard protein precipitation. For this, three volumes of cold methanol were added and then samples maintained at -2 °C for 20 min. After centrifugation, supernatants were dried in a speedvac concentrator and the residue was reconstituted in heptane for further analysis. Detection of 10a was performed on extracted ion chromatograms (EIC) at m/z 191.0137, corresponding to the fragment C8H6F3S. The 10a peak presented a limit of quantification (LOQ) in standards of 70 ng/mL, approximately.. PAMPA-BBB assay The method published by Muller et al. was followed for the PAMPA assay.47 Solutions of each compound were prepared in dimethyl sulfoxide (DMSO) at 2 mM and then diluted with 0.01M PBS (Phosphate Buffer Saline; pH = 7.4) buffer to obtain the donor drug solution with the final nominal concentration of 100 μM in 5% DMSO (200 μM for 12b). In the acceptor plate (96-well PTFE acceptor plates (Multiscreen Acceptor Plate, MSSACCEPTOR; Millipore)) 300 L of 0.01 M PBS 5% DMSO were added. The donor plate (96-well polycarbonate based filter donor plates (Multiscreen™-IP, MAIPNTR10, pore size 0.45 μm; Millipore) was covered with 5 L of polar brain lipid extract solution (PBLE), prepared by solution of 2 mg of PBLE in 20 L of dodecane and 60 L of hexane. Afterwards, 150 L of the 100 μM solution of the test compounds were added over the lipid layer. The donor plate was fitted over the acceptor, covered with wet filter paper and the lid. The system was incubated and shaken for 4 h at 37 °C (Vortemp 57EVC, Labnet International Inc.). The final concentration in the donor plate, acceptor plate and the membrane retention (%MR) were measured by HPLCDAD (20 L of volume injection, Agilent InfinityLab Poroshell 120 EC-C18 4.6x150mm. 37.
(38) column, HPLC Agilent 1260 Infinity II). Data were measured in 3 replicates on every single plate.. ASSOCIATED CONTENT HPLC data; 13C NMR and 1H NMR of spectra of compounds 1, 4a-d, 5a-c, 10a-c and 12a-e; Tyrosine phosphorylation levels in HeLa cells; Glide docking scores; MM-ISMSA binding energies; Pymol representations of complexes between PTPRZ1 or PTP1B and compounds 4c, 4d, 5b, 10a, 12b, and 12d; RMSD evolution for MD simulations. AUTHOR INFORMATION Corresponding Author * Ana Ramos: [email protected]. * Gonzalo Herradón: [email protected]. * Beatriz de PascualTeresa: [email protected] Author Contributions The manuscript was written through contributions of all authors. All authors have given approval to the final version of the manuscript. ‡M. P. and R. F-C contributed equally. ACKNOWLEDGMENTS This work was supported by Spanish MSSSI (PNSD2015I001), MINECO (CTQ2014-52604-R and SAF2014-53977-R) and the United States National Institute on Alcohol Abuse and Alcoholism (NIAAA, INIA consortium grant AA020912 to A.W.L.). B. di G, R. F-C and M. V-. 38.
(39) R thank Fundación Universitaria San Pablo CEU for FPI fellowships. B. di G. also thanks the Spanish MINECO for a FPU fellowship. ABBREVIATIONS EDCI, 1-Ethyl-3-(3-dimethylaminopropyl)carbodiimide; HOBt, hydroxybenzotriazole; MCPBA, meta-chloroperbenzoic acid; MK, Midkine; PAMPA-BBB, membrane permeability assay for the blood-brain barrier; PTN, Pleiotrophin; PTPRZ1, Protein Tyrosine-Phosphatase Receptor Z1; SDDB, strategic drug delivery to brain; TPSA, topological polar surface area. REFERENCES 1.. Kadomatsu, K.; Muramatsu, T. Midkine and pleiotrophin in neural development and. cancer. Cancer Lett. 2004, 204, 127-143. 2.. Kadomatsu, K.; Kishida, S.; Tsubota, S. The heparin-binding growth factor midkine: the. biological activities and candidate receptors. J. Biochem. 2013, 153, 511-521. 3.. Deuel, T. F.; Zhang, N.; Yeh, H. J.; Silos-Santiago, I.; Wang, Z. Y. Pleiotrophin: a. cytokine with diverse functions and a novel signaling pathway. Arch. Biochem. Biophys. 2002, 397, 162-171. 4.. (a) Li, Y. S.; Milner, P. G.; Chauhan, A. K.; Watson, M. A.; Hoffman, R. M.; Kodner, C.. M.; Milbrandt, J.; Deuel, T. F. Cloning and expression of a developmentally regulated protein that induces mitogenic and neurite outgrowth activity. Science 1990, 250, 1690-1694; (b) Yeh, H. J.; He, Y. Y.; Xu, J.; Hsu, C. Y.; Deuel, T. F. Upregulation of pleiotrophin gene expression in developing microvasculature, macrophages, and astrocytes after acute ischemic brain injury. J. Neurosci. 1998, 18, 3699-3707; (c) Kadomatsu, K.; Tomomura, M.; Muramatsu, T. cDNA cloning and sequencing of a new gene intensely expressed in early differentiation stages of. 39.
(40) embryonal carcinoma cells and in mid-gestation period of mouse embryogenesis. Biochem. Biophys. Res. Commun. 1988, 151, 1312-1318. 5.. (a) Alguacil, L. F.; Herradon, G. Midkine and Pleiotrophin in the Treatment of. Neurodegenerative Diseases and Drug Addiction. Recent Pat. CNS Drug Discov. 2015, 10, 2833; (b) Martin, Y. B.; Herradon, G.; Ezquerra, L. Uncovering new pharmacological targets to treat neuropathic pain by understanding how the organism reacts to nerve injury. Curr. Pharm. Res. 2011, 17, 434-448; (c) Muramatsu, T. Midkine: a promising molecule for drug development to treat diseases of the central nervous system. Curr. Pharm. Res. 2011, 17, 410-423. 6.. (a) Vicente-Rodriguez, M.; Rojo Gonzalez, L.; Gramage, E.; Fernandez-Calle, R.; Chen,. Y.; Perez-Garcia, C.; Ferrer-Alcon, M.; Uribarri, M.; Bailey, A.; Herradon, G. Pleiotrophin overexpression regulates amphetamine-induced reward and striatal dopaminergic denervation without changing the expression of dopamine D1 and D2 receptors: Implications for neuroinflammation. Eur. Neuropsychopharm. 2016, 29, 1794-1805; (b) Vicente-Rodriguez, M.; Fernandez-Calle, R.; Gramage, E.; Perez-Garcia, C.; Ramos, M. P.; Herradon, G. Midkine is a novel regulator of amphetamine-induced striatal gliosis and cognitive impairment: evidence for a stimulus-dependent regulation of neuroinflammation by midkine. Mediators Inflamm. 2016, 2016, 9894504; (c) Fernandez-Calle, R.; Vicente-Rodriguez, M.; Gramage, E.; Pita, J.; PerezGarcia, C.; Ferrer-Alcon, M.; Uribarri, M.; Ramos, M. P.; Herradon, G. Pleiotrophin regulates microglia-mediated neuroinflammation. J. Neuroinflammation 2017, 14, 46. 7.. (a) Wisniewski, T.; Lalowski, M.; Baumann, M.; Rauvala, H.; Raulo, E.; Nolo, R.;. Frangione, B. HB-GAM is a cytokine present in Alzheimer's and Down's syndrome lesions. NeuroReport 1996, 7, 667-671; (b) Yasuhara, O.; Muramatsu, H.; Kim, S. U.; Muramatsu, T.;. 40.
(41) Maruta, H.; McGeer, P. L. Midkine, a novel neurotrophic factor, is present in senile plaques of Alzheimer disease. Biochem. Biophys. Res. Commun. 1993, 192, 246-251. 8.. Marchionini, D. M.; Lehrmann, E.; Chu, Y.; He, B.; Sortwell, C. E.; Becker, K. G.;. Freed, W. J.; Kordower, J. H.; Collier, T. J. Role of heparin binding growth factors in nigrostriatal dopamine system development and Parkinson's disease. Brain Res. 2007, 1147, 7788. 9.. Herradon, G.; Perez-Garcia, C. Targeting midkine and pleiotrophin signalling pathways. in addiction and neurodegenerative disorders: recent progress and perspectives. Br. J. Pharmacol. 2014, 171, 837-848. 10. (a) Soto-Montenegro, M. L.; Vicente-Rodriguez, M.; Perez-Garcia, C.; Gramage, E.; Desco, M.; Herradon, G. Functional neuroimaging of amphetamine-induced striatal neurotoxicity in the pleiotrophin knockout mouse model. Neurosci. Lett. 2015, 591, 132-137; (b) Gramage, E.; Rossi, L.; Granado, N.; Moratalla, R.; Herradon, G. Genetic inactivation of pleiotrophin triggers amphetamine-induced cell loss in the substantia nigra and enhances amphetamine neurotoxicity in the striatum. Neuroscience 2010, 170, 308-316; (c) Gramage, E.; Putelli, A.; Polanco, M. J.; Gonzalez-Martin, C.; Ezquerra, L.; Alguacil, L. F.; Perez-Pinera, P.; Deuel, T. F.; Herradon, G. The neurotrophic factor pleiotrophin modulates amphetamine-seeking behaviour and amphetamine-induced neurotoxic effects: evidence from pleiotrophin knockout mice. Addict. Biol. 2010, 15, 403-412. 11. (a) Gombash, S. E.; Manfredsson, F. P.; Mandel, R. J.; Collier, T. J.; Fischer, D. L.; Kemp, C. J.; Kuhn, N. M.; Wohlgenant, S. L.; Fleming, S. M.; Sortwell, C. E. Neuroprotective potential of pleiotrophin overexpression in the striatonigral pathway compared with. 41.
(42) overexpression in both the striatonigral and nigrostriatal pathways. Gene Ther. 2014, 21 (7), 682693; (b) Gombash, S. E.; Lipton, J. W.; Collier, T. J.; Madhavan, L.; Steece-Collier, K.; ColeStrauss, A.; Terpstra, B. T.; Spieles-Engemann, A. L.; Daley, B. F.; Wohlgenant, S. L.; Thompson, V. B.; Manfredsson, F. P.; Mandel, R. J.; Sortwell, C. E. Striatal pleiotrophin overexpression provides functional and morphological neuroprotection in the 6hydroxydopamine model. Mol. Ther. 2012, 20, 544-554. 12. Gramage, E.; Perez-Garcia, C.; Vicente-Rodriguez, M.; Bollen, S.; Rojo, L.; Herradon, G. Regulation of extinction of cocaine-induced place preference by midkine is related to a differential phosphorylation of peroxiredoxin 6 in dorsal striatum. Behav. Brain Res. 2013, 253, 223-231. 13. Gramage, E.; Vicente-Rodriguez, M.; Herradon, G. Pleiotrophin modulates morphine withdrawal but has no effects on morphine-conditioned place preference. Neurosci. Lett. 2015, 604, 75-79. 14. (a) Vicente-Rodriguez, M.; Perez-Garcia, C.; Haro, M.; Ramos, M. P.; Herradon, G. Genetic inactivation of midkine modulates behavioural responses to ethanol possibly by enhancing GABA(A) receptor sensitivity to GABA(A) acting drugs. Behav. Brain Res. 2014, 274, 258-263; (b) Vicente-Rodriguez, M.; Perez-Garcia, C.; Ferrer-Alcon, M.; Uribarri, M.; Sanchez-Alonso, M. G.; Ramos, M. P.; Herradon, G. Pleiotrophin differentially regulates the rewarding and sedative effects of ethanol. J. Neurochem. 2014, 131, 688-695; (c) Chen, H.; He, D.; Lasek, A. W. Midkine in the mouse ventral tegmental area limits ethanol intake and Ccl2 gene expression. Genes Brain Behav. 2017, Apr 11. doi: 10.1111/gbb.12384.. 42.
(43) 15. Banks, W. A.; Gertler, A.; Solomon, G.; Niv-Spector, L.; Shpilman, M.; Yi, X.; Batrakova, E.; Vinogradov, S.; Kabanov, A. V. Principles of strategic drug delivery to the brain (SDDB): development of anorectic and orexigenic analogs of leptin. Physiol. Behav. 2011, 105, 145-149. 16. (a) Maeda, N.; Nishiwaki, T.; Shintani, T.; Hamanaka, H.; Noda, M. 6B4 proteoglycan/phosphacan, an extracellular variant of receptor-like protein-tyrosine phosphatase zeta/RPTPbeta, binds pleiotrophin/heparin-binding growth-associated molecule (HB-GAM). J. Biol. Chem. 1996, 271, 21446-21452; (b) Meng, K.; Rodriguez-Pena, A.; Dimitrov, T.; Chen, W.; Yamin, M.; Noda, M.; Deuel, T. F. Pleiotrophin signals increased tyrosine phosphorylation of beta beta-catenin through inactivation of the intrinsic catalytic activity of the receptor-type protein tyrosine phosphatase beta/zeta. Proc. Natl. Acad. Sci. U. S. A. 2000, 97, 2603-2608. 17. Pariser, H.; Ezquerra, L.; Herradon, G.; Perez-Pinera, P.; Deuel, T. F. Fyn is a downstream target of the pleiotrophin/receptor protein tyrosine phosphatase beta/zeta-signaling pathway: regulation of tyrosine phosphorylation of Fyn by pleiotrophin. Biochem. Biophys. Res. Commun. 2005, 332, 664-669. 18. Perez-Pinera, P.; Zhang, W.; Chang, Y.; Vega, J. A.; Deuel, T. F. Anaplastic lymphoma kinase is activated through the pleiotrophin/receptor protein-tyrosine phosphatase beta/zeta signaling pathway: an alternative mechanism of receptor tyrosine kinase activation. J. Biol. Chem. 2007, 282, 28683-28690. 19. Fujikawa, A.; Nagahira, A.; Sugawara, H.; Ishii, K.; Imajo, S.; Matsumoto, M.; Kuboyama, K.; Suzuki, R.; Tanga, N.; Noda, M.; Uchiyama, S.; Tomoo, T.; Ogata, A.;. 43.
(44) Masumura, M. Small-molecule inhibition of PTPRZ reduces tumor growth in a rat model of glioblastoma. Sci. Rep. 2016, 6, 20473. 20. Huang, P.; Ramphal, J.; Wei, J.; Liang, C.; Jallal, B.; McMahon, G.; Tang, C. Structurebased design and discovery of novel inhibitors of protein tyrosine phosphatases. Bioorg. Med. Chem. 2003, 11, 1835-1849. 21. Pajouhesh, H.; Lenz, G. R. Medicinal chemical properties of successful central nervous system drugs. NeuroRx 2005, 2, 541-553. 22. Verma, M.; Gupta, S. J.; Chaudhary, A.; Garg, V. K. Protein tyrosine phosphatase 1B inhibitors as antidiabetic agents - A brief review. Bioorg. Chem. 2017, 70, 267-283. 23. Shintani, T.; Noda, M. Protein tyrosine phosphatase receptor type Z dephosphorylates TrkA receptors and attenuates NGF-dependent neurite outgrowth of PC12 cells. J. Biochem. 2008, 144, 259-266. 24. Abbott, K. L.; Matthews, R. T.; Pierce, M. Receptor tyrosine phosphatase beta (RPTPbeta) activity and signaling are attenuated by glycosylation and subsequent cell surface galectin-1 binding. J. Biol. Chem. 2008, 283, 33026-33035. 25. Maeda, N.; Ichihara-Tanaka, K.; Kimura, T.; Kadomatsu, K.; Muramatsu, T.; Noda, M. A receptor-like protein-tyrosine phosphatase PTPzeta/RPTPbeta binds a heparin-binding growth factor midkine. Involvement of arginine 78 of midkine in the high affinity binding to PTPzeta. J. Biol. Chem. 1999, 274, 12474-12479.. 44.
(45) 26. He, D.; Chen, H.; Muramatsu, H.; Lasek, A. W. Ethanol activates midkine and anaplastic lymphoma kinase signaling in neuroblastoma cells and in the brain. J. Neurochem. 2015, 135, 508-521. 27. Moog-Lutz, C.; Degoutin, J.; Gouzi, J. Y.; Frobert, Y.; Brunet-de Carvalho, N.; Bureau, J.; Creminon, C.; Vigny, M. Activation and inhibition of anaplastic lymphoma kinase receptor tyrosine kinase by monoclonal antibodies and absence of agonist activity of pleiotrophin. J. Biol. Chem. 2005, 280, 26039-26048. 28. Mok, S. A.; Campenot, R. B. A nerve growth factor-induced retrograde survival signal mediated by mechanisms downstream of TrkA. Neuropharmacology 2007, 52, 270-278. 29. Gramage, E.; Alguacil, L. F.; Herradon, G. Pleiotrophin prevents cocaine-induced toxicity in vitro. Eur. J. Pharmacol. 2008, 595, 35-38. 30. Vicente-Rodriguez, M.; Fernandez-Calle, R.; Gramage, E.; Perez-Garcia, C.; Zapico, J. M.; Coderch, C.; Pastor, M.; Di Geronimo, B.; De Pascual-Teresa, B.; Ramos, A.; Lasek, A. W.; Herradon, G. Preclinical development and evaluation of inhibitors of Receptor Protein Tyrosine Phosphatase beta/zeta for the treatment of alcohol use disorder. Alcohol. Clin Exp. Res. 41, Suppl 1: 110A, 2017. 31. Di Geronimo, B.; Coderch, C.; Herradón, G.; Ramos, A.; de Pascual-Teresa, B. Exploring the Protein Tyrosine Phosphatase Receptor Z1 (PTPRZ1) in the search for new selective inhibitors for the prevention of alcohol abuse. Presented at 6th EUCHEMS Chemistry Congress, Seville, Spain, September 11-15, 2016; Abstract 999.. 45.
Figure
+2
Documento similar
The organic phase was washed with saturated aqueous solutions of NaHCO 3 and NaCl, dried over Na 2 SO 4 , and the solvent was removed under reduced pressure to obtain the
The policy iteration was a result of the application of the Markov chain environment and it was an important contribution to the development of optimization techniques
To a solution of this diastereomeric mixture (31.19 mmol) in acetone at 273 K was added the O-Ethylxanthic acid potassium salt (46.78 mmol) and the reaction was stirred at
The turbid yellow supernatant was removed and the black solid was washed twice with 9 mL of acetone and twice with 9 mL of THF, isolating it by means of centrifugation for 5 min at
The reaction mixture was diluted with AcOEt (50 mL) and washed with water (3 × 50 mL), dried (Na 2 SO 4 ) and concentrated in vacuo and the crude mixture was purificated by
The organic layer was separated, dried with MgSO 4 , the solvent evaporated to dryness and the residue purified by column chromatography (SiO 2 : DCM). The solvent
Protein tyrosine phosphatase 1B (PTP1B) is a negative regulator of insulin signaling and a therapeutic target for type 2 diabetes (T2DM). In this study, we have evaluated the role
(c) A candidate for the Knesset who has been sentenced as stated in Section (a) and whose sentence was finalized after the submission of the list of candidates and before he has
