Effects of resistance exercise training during hemodialysis on physical performance and health quality of life / tesis doctoral presentada por Dña Eva Segura Ortí ; dirigida por [el] Dr D Juan Francisco Lisón [y la] Dra Dña Evelyn Kouidi
122
0
0
Texto completo
(2) 1.
(3) 2.
(4) 3.
(5) 4.
(6) 5.
(7) 6.
(8) 7.
(9) CONTENTS LIST. Contents List CONTENTS LIST ............................................................................................... 8 TABLES INDEX ............................................................................................... 11 FIGURES INDEX ............................................................................................. 12 PHOTOGRAPHIES INDEX .............................................................................. 13 CHAPTER 1: INTRODUCTION ....................................................................... 16 1.1. END-STAGE RENAL DISEASE AND RENAL REPLACEMENT THERAPIES. .... 16 1.2. COMPLICATIONS OF KIDNEY FAILURE ........................................................... 19 1.2.1. CARDIOVASCULAR COMPLICATIONS ...................................................................... 19 1.2.2. MUSCULOSKELETAL ABNORMALITIES ................................................................... 21 1.2.3. HEMATOLOGICAL COMPLICATIONS ........................................................................ 22 1.2.4. NEUROLOGIC COMPLICATIONS ............................................................................... 24 1.2.5. METABOLIC COMPLICATIONS .................................................................................. 25 1.2.6. HORMONAL COMPLICATIONS .................................................................................. 26 1.2.7. OSTEODISTROPHY .................................................................................................... 27 1.2.8. GASTROINTESTINAL COMPLICATIONS ................................................................... 28 1.2.9. OTHER ALTERATIONS: LUNGS, SKIN AND JOINTS ................................................ 28. 1.3. FACTORS INFLUENCING SURVIVAL IN ESRD PATIENTS ............................... 29 1.4. PSYCHOLOGICAL FEATURES OF PATIENTS ON HEMODIALYSIS ................. 32 1.5. PHYSICAL ACTIVITY AND PHYSICAL FUNCTIONING IN HEMODIALYSIS PATIENTS .................................................................................................................. 33 1.5.a. Objective laboratory measures ..................................................................................... 35 1.5.b. Physical performance testing ........................................................................................ 37 1.5.c. Self-reported measures ................................................................................................. 38. 1.6. EVIDENCE ON EXERCISE BENEFITS FOR ESRD PATIENTS .......................... 39 1.6.1. AEROBIC TRAINING PROGRAMS.............................................................................. 39 1.6.2. PROGRESSIVE RESISTANCE TRAINING PROGRAMS ........................................... 44 1.6.3. COMBINED TRAINING PROGRAMS .......................................................................... 46. 8.
(10) CONTENTS LIST. CHAPTER 2: AIMS AND HYPOTHESIS ......................................................... 54 CHAPTER 3: METHODOLOGY ...................................................................... 58 3.1. PATIENTS ........................................................................................................... 58 3.2. DESIGN ............................................................................................................... 59 3.3. OUTCOMES ........................................................................................................ 60 3.3.a. Sit to Stand to Sit Test (STS 10 and STS 60) ............................................................... 60 3.3.b. 6 Minutes Walking Test (6MWT)................................................................................... 60 3.3.c. Dinamometry ................................................................................................................. 61 3.3.d. Graded Exercise test (GXT) .......................................................................................... 61 3.3.e. Medical Outcomes Survey short form (SF-36) ............................................................. 62 3.3.f. Dry weight, Blood Pressure, KtV and Hematologic Assessments ................................. 62. 3.4. INTERVENTION .................................................................................................. 63 3.5. ADHERENCE TO EXERCISE PROGRAM .......................................................... 66 3.6. STATISTICAL ANALYSIS .................................................................................... 66. CHAPTER 4: RESULTS .................................................................................. 70 4.1. STUDY PATIENTS .............................................................................................. 70 4.2. PHYSICAL FUNCTIONING, GRADED EXERCISE TEST AND DYNAMOMETRY ................................................................................................................................... 72 4.3. HEALTH RELATED QUALITY OF LIFE (SF-36) .................................................. 77 4.4. CHANGES IN DRY WEIGHT, BODY MASS INDEX, BLOOD PRESSURE AND KTV ............................................................................................................................ 79 4.5. CHANGES IN HEMATOLOGICAL ASSESSMENT .............................................. 80. CHAPTER 5: DISCUSION ............................................................................... 86 5.a. Six minutes walking test ................................................................................................... 86 5.b. Sit to Stand to Sit Tests ................................................................................................... 88 5.c. Exercise Capacity............................................................................................................. 89 5.d. Lower limb strength .......................................................................................................... 90 5.e. Health Related Quality of Life .......................................................................................... 91. 9.
(11) CONTENTS LIST. CHAPTER 6: CONCLUSIONS ........................................................................ 96 ACKNOWLEDGMENTS .................................................................................. 98 REFERENCES ............................................................................................... 102. 10.
(12) TABLES INDEX. TABLES INDEX Table I. Aerobic Training Programs ...................................................... 40 Table II. Progressive Resistance Training Programs ............................ 45 Table III. Combined Training Programs ................................................ 47 Table IV. Summary of the literature reviewed ....................................... 50 Table V. Patient characteristics ............................................................. 72 Table VI. Changes in Physical Functioning from baseline to 6 months 73 Table VII. Changes in Graded Exercise Test and Dynamometry from baseline to 6 months.............................................................................. 75 Table VIII. Changes in SF-36 components and subscales from baseline to 6 months ............................................................................................ 78 Table IX. Changes in Dry weight, BMI, Blood Pressure and KtV from baseline to 6 months.............................................................................. 79 Table X. Changes in Hematologic Assessments from baseline to 6 months ................................................................................................... 81. 11.
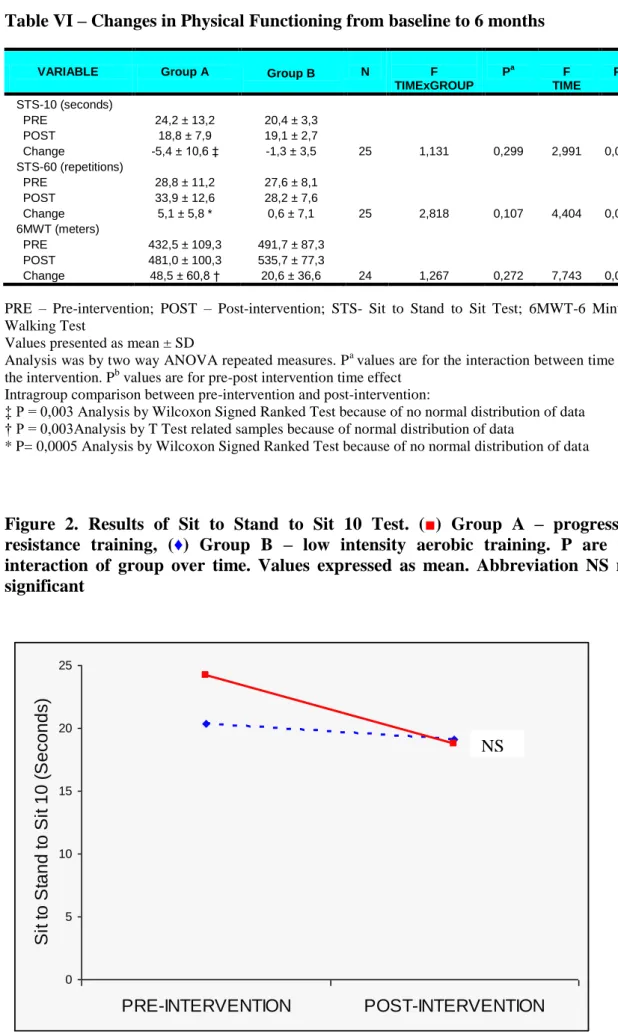
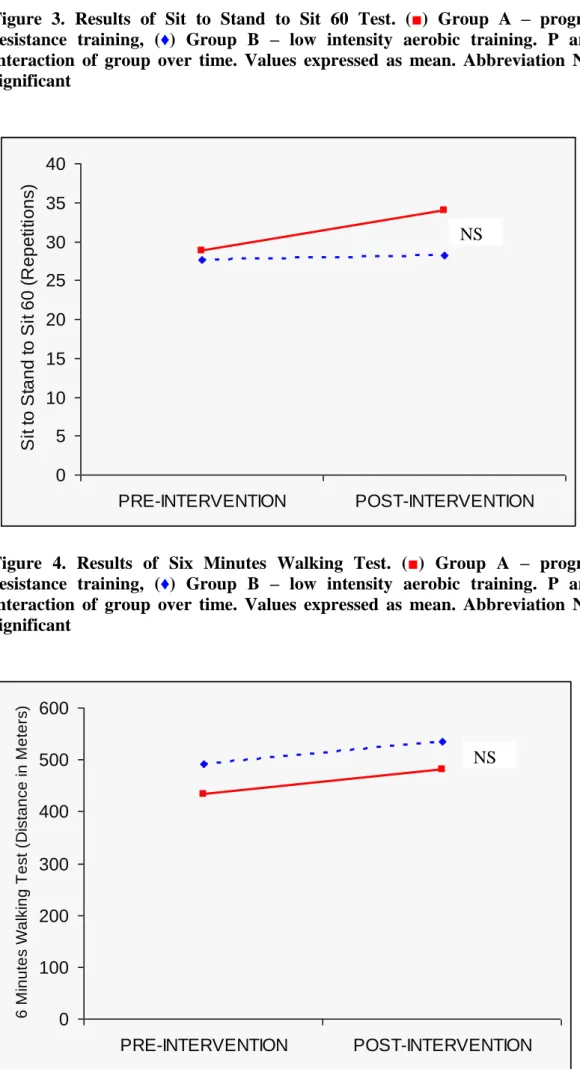
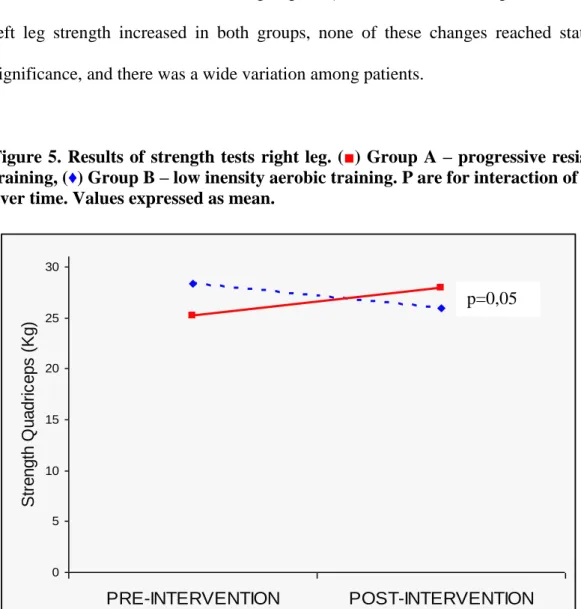
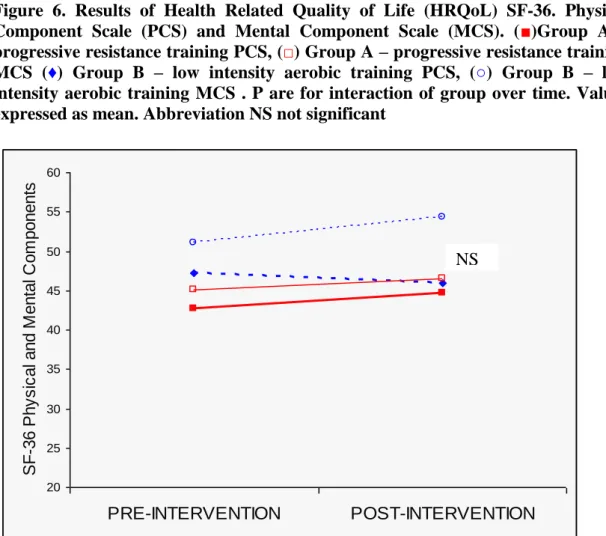
(13) FIGURES INDEX. FIGURES INDEX Figure 1. Participants Flowchart ........................................................... 71 Figure 2. Results of Sit to Stand to Sit 10 ............................................. 73 Figure 3. Results of Sit to Stand to Sit 60 ............................................. 74 Figure 4. Results of Six Minutes Walking Test ..................................... 74 Figure 5. Results of strength tests ........................................................ 76 Figure 6. Results of Healt Related Quality of Life SF-36 ...................... 77. 12.
(14) PHOTOGRAPHIES INDEX. PHOTOGRAPHIES INDEX Photography 1. Knee Extension Exercise .......................................... 64 Photography 2. Triple Extension Exercise ........................................... 65 Photography 3. Isometric Exercise ...................................................... 65. 13.
(15) 14.
(16) 15.
(17) INTRODUCTION. CHAPTER 1: INTRODUCTION. This chapter defines chronic renal failure stages until achieving End Stage Renal Disease. The different replacement therapies are reviewed, so as the health side effects that dialysis is not able to correct. Physical activity, physical function and survival of the cohort are reviewed. Finally, the literature on training modalities and its effects on patients’ health are summarized. Gap in the literature and hypothesis are finally stated at the end of the chapter.. 1.1.. END-STAGE. RENAL. DISEASE. AND. RENAL. REPLACEMENT. THERAPIES.. Chronic renal failure (CRF) results from structural renal damage and diminished renal function, and may be caused by hypertension, diabetes mellitus, autoimmune reactions, infection, unknown cause, etc (1).. The kidneys’ major functions include control of extracellular fluid volume, regulation of serum osmolarity, electrolyte and acid-base balances, secretion of hormones and excretion of uremic toxic substances (1-3). Kidney function is often measured by the Glomerular Filtration Rate (GFR), amount of filtration flux from blood to the Bowman’s capsule generated at the glomerular capillaries of the nephrone (4). The normal rate is 90 ml/min/1,73m2 and the stages of CRF are established according to the lost GFR, so that GFR between 60 and 89 ml/min/1,73m2 corresponds to mild CRF, 30 to 59 ml/min/1,73m2 corresponds to moderate CRF and less than 29 ml/min/1,73m2 corresponds to severe CRF. End-stage renal disease (ESRD), in which there is. 16.
(18) INTRODUCTION. inadequate or nonexistent kidney function (1), occurs when GFR is bellow 15 ml/min/1,73m2 (5).. When decreased GFR occurs the capacity of urine concentration of solutes is diminished, at first term poliuria occurs as a compensation mechanism and in last stages the kidney losses the capacity of urine excretion, so that fluid accumulation occurs (3). Sodium and potassium show a trend to increase in the last stages, what may be aggravated by diet intake, drugs, traumatisms, blood transfusions, etc. Metabolic acidosis due to the lack of capacity to excrete hydronium ions (H+) occurs at the last stages, when bicarbonate decreases (3).. At the moment patient reaches a GFR bellow 5ml/min, frequently combined with plasmatic creatinine reaching 12-15 mg/dL and symptomatology of nausea, anorexia, asthenia and vomiting, one of the options of replacement therapy for renal function is needed. Conditions such as pericarditis, HTA, polineuropathy, diabetes and congestive heart failure accelerate the initiation of replacement therapy. The different replacement modalities are: dialysis techniques (hemodialysis, peritoneal dialysis, hemofiltration), that partially substitute kidney functions, or kidney transplantation that substitutes the whole functions of the kidney (3).. Hemodialysis (HD), the most common renal replacement therapy, is a process that replaces the excretory functions of the kidney through the use of a filter that contains a semipermeable membrane separating a rinsing solution from blood to filter out toxic waste substances from the blood. Additionally, HD allows for control of fluid and electrolyte balance (2,6). HD requires a vascular access, preferably long term, the most common being the arteriovenous fistula by anastomoses of radial artery and vein 17.
(19) INTRODUCTION. at the forearm (2,6). In case of failure, graft may be required to get other accesses. The aim is to achieve a wide venous network with arterial blood, at a blood flux around 200 mL/min (6). Patients receive the treatment during 3 to 5 hours per session, 3 times per week, depending on residual renal function, body surface, HD technique and patient’s disorders (2,6). The most common procedure to calculate the amount of HD per patient is by the calculation of Kt/V around 1.2, where K is urea clearance, t is length of HD session and V is patient’s water volume (6). HD treatment is administered in hospital, in out-patient clinics or at home, after a training period and adaptation at home.. In Peritoneal Dialysis (PD), peritoneum acts as the semipermeable membrane that separates blood at the mesenteric capillaries and the periodically renewed fluid through an intraabdominal catheter. The total amount of solute excretion depends on the volume of liquid introduced per day at the peritoneal cavity, and compared to HD higher extraction of median molecules and lower extraction of small molecules is achieved. Patients requiring chronic PD follow most of the times a manual continuous technique (CAPD) that consists of introduction of 1.5 to 2.5 liters of dialysis solution four times per day. PD is specially recommended for patients suffering from ischemic cardiopathy, children and elderly, diabetics, and when troubles with vascular access are present (6).. Finally, renal transplantation from cadaver or form living donor is the most convenient replacement therapy for ESRD (6). If the intervention is successful, poliuria and normalization of nitrogen metabolism occurs and hydroelectrolitic reposition is required. Patients are at risk of acute or chronic rejection, infections due to inmunosupressor chronic treatment, cancer, arterial hypertension, cardiovascular complications, hyperparathyroidism, nephropathy of the transplanted kidney etc. 18.
(20) INTRODUCTION. Survival of the transplanted kidney is about 90% at the first year, but decreases to 20% 20 years after the transplantation, and chronic nephropathy of the new kidney is the main cause for implant death (3).. The next section analyses how the uremic syndrome occurring at the ESRD by the impairment in renal function affects every other body system (2,3), and dialysis is not able to fully substitute the original kidney.. 1.2. COMPLICATIONS OF KIDNEY FAILURE. 1.2.1. CARDIOVASCULAR COMPLICATIONS. Cardiovascular complications are the main reasons for death in end-stage renal disease patients on HD, with mortality rates ranging from 30.4% in healthy HD patients to 56% in samples including diabetics older than 60 years (7-10). Left ventricular hypertrophy and coronary artery disease are reported in 30 to 70% of HD patients (1113).. Cardiac morphological abnormalities described in HD patients (11) include higher size of right ventricle and left atrium, and higher left ventricular mass. Both the echocardiography at rest and the stress echo study show significantly greater end diastolic and systolic volume index, and lower ejection fraction (11) in HD patients compared to normal. While at rest patients achieve higher heart rate (11), at submaximal exercise heart rate is lower (11,14) and have lower increments of systolic blood pressure (14) compared to healthy subjects. 19.
(21) INTRODUCTION. Risk factors capable of promoting the accelerated development of left ventricular hypertrophy and coronary atherosclerosis are prevalent in uremic patients receiving chronic maintenance HD (15-17). These include hypertension, arrhythmias, hemodinamic instability, pressure overload, anaemia, reduced levels of high-density lipoprotein (HDL) cholesterol, hypertriglyceridemia, commorbid diabetes mellitus and sedentary life-style.. Hypertension (HTA) is reported by 63 to 86% of HD patients (11,18,19), presenting higher values on systolic (16%) and diastolic (10%) pressure (11). It constitutes a major risk for cardiovascular morbidity and mortality in this cohort (20). Sustained activation of sympathetic nerve system mediates HTA in moderate and chronic renal insufficiency patients (20), and contributes to cardiovascular problems (left ventricular hypertrophy, arrhythmias) and kidney damage (21). The increased activity seems to be mediated by signals arising in the native kidneys that are independent of circulating uremia related toxins (22). HTA is associated with younger age, diabetes mellitus or HTA as cause of end-stage renal disease, less obese patients, fewer years in HD and higher number of medications (inadequate HTA control) (18).. Reduced heart rate variability (HRV) found in this cohort is associated with higher incidence of arrhythmias, clinical signs of uremic peripheral neuropathy (19) and sudden cardiac death in those HD patients who present signs of coronary artery disease (12). By the other hand, HRV index correlates with maximal oxygen consumption (19).. Other cardiovascular complications commonly found in ESRD patients are pericarditis, endocarditis, aortic valve stenosis and mitral valve calcification (17).. 20.
(22) INTRODUCTION. Therefore, a wide variety of cardiovascular risk factors commonly found in HD patients are eventually responsible for coronary artery disease and left ventricular hypertrophy that lead to death in a high percentage of ESRD patients.. 1.2.2. MUSCULOSKELETAL ABNORMALITIES. Most of patients reaching ESRD are experiencing weakness, fatigue and lack of energy (23-29) which are considered the most important limiting factors for functional capacity (11,30). Decreased muscle strength and endurance on ESRD patients (28) are already present at the predialysis stage (26). Several morphological and metabolic alterations on the patient’s skeletal muscle explain altered muscle function.. Both morphological and degenerative muscle abnormalities have been described in the literature. Morphological abnormalities include reduction in cross-sectional area (24,31), that predominantly affects anaerobic type IIb fibres (25,32-35), and that are not present earlier at predialysis stage (26). Nevertheless, in young CRF patients Wagner et al. (36) did not find those abnormalities. Degenerative changes reported in the uremic skeletal muscle include loss of myofilaments, and capillaries and mitochondrial changes, suggesting neuropathic atrophy (34,37,38), although Bradley et al. (33) findings did not support alterations in mitochondria’s structure.. The uremic miopathy consists of muscle metabolism abnormalities that result in electromyographic changes and weakness (39). Two reviews highlighted the factors related with uraemic myopathy in patients with CRF (37,40). First, ESRD patients present central activation failure and decreased phosphorilation of creatine to creatine phosphate, as shown by Johansen et al. (23), despite previous studies did not 21.
(23) INTRODUCTION. demonstrate abnormal creatine phosphokinase levels (32). Additionally, increased parathormone (PTH) as a result of decreased vitamin D leads to muscle weakness and fatigability by impairing energy production (32). Third, oxidative metabolism in the uremic muscle is altered (23). Oxygen transport from muscle capillaries into mitochondria is impaired (36,41). Uremic muscle presents fewer capillaries per fiber (36) and a significant decreased blood flow as a response to exercise (33) but not limited mitochondrial oxidative activity is found (36,41). Altered blood calcium levels may be responsible for capillary abnormalities that result in decreased skeletal muscle blood flow (37). Whereas, diminished oxygen transport contributes to the impaired oxidative metabolism that leads to exercise limitation in CRF patients.. In HD patients, muscle wasting occurs as a result of additional factors, both dialysis and non-dialysis-related, such as decreased dietary intake, impaired protein synthesis, sedentary lifestyle, and HD associated catabolism (25,42).. Summarizing, morphological (decreased type II cross-sectional area and degenerative changes) and metabolic abnormalities explain the impaired muscular function in ESRD patients.. 1.2.3. HEMATOLOGICAL COMPLICATIONS. ESRD patients present 27% lower hematocrit compared with healthy subjects (37). Renal anaemia, which is normochromic and normocytic (17), is mainly due to decreased production of glycoprotein hormone erythropoietin (EPO) by endothelial cells in proximity of renal tubules that accompanies decreased GFR (43). Secondary factors contributing to anemia are faster destruction of red blood cells caused by uremic 22.
(24) INTRODUCTION. environment and decreased erythropoiesis (3,43). It accounts for fatigue, dyspnea and increased cardiac output and left ventricular hypertrophy as a heart’s compensatory mechanism for reduced oxygen delivery to tissues (17,43,44). Renal anemia emerges as an important factor affecting maximal exercise capacity in the patient with ESRD failure, and EPO administration increases maximal exercise capacity by increasing peak VO2, showing positive central hemodynamic effects with reduction in left ventricular mass, volume and function (25).. Platelet quantity is usually normal in ESRD, but aggregation is impaired presenting disturbances at the level of endothelial contact (3,17,43), that may lead to bleeding at superficial sites such as skin and mucoses. Deep bleeding on muscles or joints does not occur because the coagulation system is not affected (17,43). The low hematocrit itself probably contributes to prolonged bleeding times (3,43).. Additionally deteriorated lymphocyte action is responsible for the decreased immunity found in this cohort (3), leading to higher risk of reactivation of tuberculosis and herpes zoster, a failure to clear hepatitis B, and a poor response to immunization with hepatitis B vaccines (17,45). Granulocites function in ESRD is also altered, so that the bacterizide action is impaired and infections incidence increase (3) mainly caused by violation of normal skin and mucosal barriers and not by immune system dysfunction (17,45).. 23.
(25) INTRODUCTION. 1.2.4. NEUROLOGIC COMPLICATIONS. Uremia is accompanied by disordered functioning of both the central and peripheral nervous systems (3,17,46), and normalization occurs after restoration of normal biochemistry by transplantation (46). Neurologic problems arise in dialyzed patients as a complication of treatment, from metabolic derangements, or from disordered homeostasis (46).. Uremic encephalopathy may appear when GFR decreases to 10% of the normal value and typically leads to mental fatigue, confusion, impaired consciousness, difficulty concentrating, lethargy, myoclonic twitching of distal muscle groups and, preterminally, coma, all of them improving with dialysis (3,46). Other common abnormalities are the syndrome of neurologic dysfunction, which appears in the last part of HD and PD or shortly afterwards when uraemia is corrected rapidly, and chronic dementia in dialysis patients caused by aluminum poisoning or by progressive cerebrovascular disease from widespread atheromatous plaques that predispose patients to develop multi-infarct dementia (3,46). Brain swelling is believed to be the cause of restlessness, headache, nausea, vomiting and confusion.. Sleep disorder is a common complain of dialysis patients, and objective disorder in polysomnography is found in 50% of those patients (46). Most commonly seen alterations include insomnia, excessive daytime sleepiness, sleep apnea, periodic leg movements in sleep and restless legs (46).. Uremic neuropathy affects 70% of HD patients (11). It may manifests as a distal, symmetric, mixed motor and sensory polyneuropathy that typically involves the legs. 24.
(26) INTRODUCTION. more than the arms (3,17,46). This neuropathy presents as paresthesia in the feet, painful dysesthesia, ataxia and eventually weakness with foot drop, also loss of power in the small muscles of the hand, and is characterized by slowing of motor nerve conduction and sensory action potentials (3,46). A specific mononeuropathy of renal failure involves the median nerve at the wrist (carpal tunnel syndrome) (17,46), caused by β2-microglobulin-derived amyloid deposition (17). Autonomic neuropathy is responsible for abnormal responses in blood pressure and heart rate, so hypotension and tachycardia are commonly found during dialysis (11,17).. Despite renal failure can lead to many neurological problems, as detailed above, differential diagnosis for drug accumulation and vascular disorders is required before attributing problems to uraemia (17).. 1.2.5. METABOLIC COMPLICATIONS. Several metabolic disturbances are associated with ESRD. First, carbohydrate metabolism is altered in renal failure due to glucose intolerance produced by resistance to insulin-mediated glucose uptake in skeletal muscle (3,17,47). Uremic skeletal muscle present reduced glycolisis and increased glucose muscle content (37,40) with glycogen deposition being more prominent in Type II fibres (34).. Second, there are complex effects on lipid metabolism, including reduction in catabolism of lipoproteins (3), which result in an increased concentration of very lowdensity lipoproteins (VLDL) and triglicerides, and a decrease in high-density lipoproteins (HDL) (3,15,44). ESRD patients present decreased carnitine content in uremic muscle (37,40), what results in impaired mitochondrial fatty acids oxidation and 25.
(27) INTRODUCTION. in accumulation of acyl groups out of the mithocondria (48). Despite carnitine seems to affect skeletal muscle growth (25) and its deficiency negatively correlates with exercise performance (37,48), Rogerson et al. (49) could not demonstrate that L-carnitine supplementation results in improvement in muscle function or improvement in plasma lipid profile. The hyperlipidaemia of renal disease contributes to the high incidence of cardiovascular disease (15,44).. Finally, chronically uremic patients receiving any form of uremia therapy present lean tissue depletion and reduction of total body amount of albumin and other proteins (3,50,51). Factors contributing to net proteolysis in ESRD are metabolic acidosis (17,25,52), impaired protein synthesis, malnutrition and decreased energy intake (37,40,50).. 1.2.6. HORMONAL COMPLICATIONS. Both intrarenal and extrarenal hormones are affected by ESRD (3,14,17,53). By one side, production of 1,25-dihydroxy vitamin D and erythropoietin is reduced (3,17,53), and by the other side, alterations on production, control, protein binding, catabolism, and tissue effect of extrarenal hormones in renal failure may be present (3,17,44). Hormone concentrations may be elevated as a result of reduced degradation (insulin, glucagon, cortisol, prolactine and growth hormone) (3,14,17,47,53), reduced renal excretion (norepinephrine and epinephrine) (53), or increased secretion in appropriate response to metabolic alterations (parathormone, plasma luteinising hormone, prolactine, growth hormone) (3,17,53). Hormone concentrations may be reduced owing to impaired production, as occurs with oestrogens and testosterone that lead to amenorrhea and impotence (3,17,53). Reductions in hormone-binding proteins 26.
(28) INTRODUCTION. are most commonly a consequence of protein loss in nephrotic patients or in those on continuous ambulatory PD (17).. 1.2.7. OSTEODISTROPHY. Renal bone disease, characterized by abnormal calcium/phosphate metabolism, is a result of the combination of secondary hyperparathyroidism (54), decreased metabolits of vitamine D and hyperphosphataemia (3,39,44). Failing of excretory function of the kidney when GFR declines leads to hyperphosphataemia, what has been directly associated to hyperparathyroidism (lost of calcium from bone), and indirectly due to inhibition of calcitriol (intermediate metabolit of vitamin D) (54). Other factors contributing to hyperparathyroidism are lack of calcitriol inhibition in parathyroid cells (54), lost of vitamin D metabolites bound to plasma-binding protein by urine, and to the tendency to hypocalcaemia (54,55). Calcitriol deficiency by decreased endocrine function of the kidney results in hypocalcaemia (44). Other factors contributing to hypocalcaemia are reduced calcium resorption in the intestine by insufficient active vitamine D (44,54), and partial resistance of the skeleton to PTH to release bone mineral and calcium. All these alterations are responsible for the appearance of osteitis fibrosa (increased bone turnover that results in rarefaction of trabeculae in bone) (54), osteomalacia (decreased mineralization of the bone matrix) (3,54), adynamic bone disease (decreased bone turnover that predisposes to hypercalcaemia) (54), osteopenia or osteoporosis. Pain (44), extra-osseus calcifications in the presence of local tissue lession (3,54) and fractures (56) are some of the consequences of bone disease in this cohort.. 27.
(29) INTRODUCTION. 1.2.8. GASTROINTESTINAL COMPLICATIONS. A wide variety of gastrointestinal system disorders are commonly found in ESRD patients. Anorexia and nausea, associated with inadequate dialysis or hypotension (57), are commonly found in uraemic patients, both leading to decreased caloric intake and malnutrition (3,17). By the other side, many factors contribute to constipation found in ESRD patients, such as limitation on patients’ fluid intake (17,57), decreased fiber intake due to potassium present in fruits an vegetables, calciumcontaining phosphate binders and iron supplements intake, patient inactivity and narcotic analgesics. Constipation may predispose dialysis patients to diverticular disease (17,57). Patients suffering from diverticular disease, amyloidosis and constipation are more prone to present spontaneous colon perforation. Diarrhea may appear associated with dietary intake or viral disorder, as a consequience of prolonged antimicrobial therapy, due to infection (17,57). Hepatitis B, when contracted in the presence of renal failure is likely to become chronic due to the depression in cell-mediated immunity. Hepatitis C is common in renal units because of exposure to blood transfusions (17).. Other alterations affecting the gastrointestinal tract are metallic taste in the mouth, dyspepsia, angiodysplasia at submucosal and mucosal blood vessels, gastroparesis, isquemic bowel disease and bowel infarction, and acute pancreatitis (3,17,57).. 1.2.9. OTHER ALTERATIONS: LUNGS, SKIN AND JOINTS. Pulmonary manifestations appear in ESRD patients because they are prone to develop pulmonary oedema with relatively small increases in extracellular fluid due to 28.
(30) INTRODUCTION. increased capillary permeability in uremic syndrome. Pleuritis may appear combined with pericarditis (3,17) and pneumonia is an important cause of mortality in this population (58).. Concerning the skin, it presents a yellow-brown pigmentation in sun-exposed areas of ESRD patients, attributed to the retention of melanocyte-stimulating hormone, vegetable-derived lipochrome and carotenoids, and iron (3,17). Pruritus, an exasperating symptom associated with xerosis (dry skin) and warm skin, has a multifactioral origin that. includes. raised. calcium. phosphate. product. sensitivity. to. histamines,. hyperparathyroidism, peripheral polyneuropathy and uraemia itself.. Finally, ESRD patients may present β2-microglobulin amyloidosis, that results in arthropaty by deposits on large joints and spine, bone erosion, pathological fractures and tenosynovitis (3,17).. In summary, ESRD affects the whole body systems, and dialysis techniques are not able to fully normalize all of them. Survival of this cohort is not only affected by these body disturbances, but by other factors analysed in the following section.. 1.3. FACTORS INFLUENCING SURVIVAL IN ESRD PATIENTS. Survival in HD patients has been found to correlate with factors of different nature.. 29.
(31) INTRODUCTION. The relationship between demographic and socioeconomic factors and survival has been analysed in the literature. Older age (7,10,59), male gender (10), smoking (10) and white race (59,60) have been associated with lower survival, although some studies did not support some of these findings (61,62). Variables that are not related with survival are educational level and marital status (61). Conversely, employment immediately before entering dialysis is associated with better survival (59).. Laboratory parameters and nutrition indicators also predict survival. Lower serum albumin level, as a sign of malnourished status, is associated with lower survival in HD (10,59,60,63) and in PD patients (64). While some studies found that low levels of other biochemical indicators of visceral and somatic protein content (serum albumin, prealbumin, creatinine and cholesterol), predicted mortality in maintenance HD patients (60), others did not find so (7,8,61). Liu et al. (8) clarified that, despite higher cholesterol is associated with higher mortality risk in the absence of inflammation in the general population, in HD patients lower cholesterol is associated with presence of inflammation, and thus the relationship between high cholesterol and better survival in HD patients is masked by inflammation. Friend at al (61) found that survival was related to higher blood urea nitrogen. The presence of chronic inflammation (brain natriuretic peptid and C-reactive protein) decreases survival (10). In predialysis patients, elevated serum levels of cellular adhesion molecules correlate with signs of inflammation, malnutrition and cardiovascular disease clinical signs, and are independent predictors of mortality once entering dialysis treatment (13). Several reviews highlight that low hematocrit level is associated to higher morbidity and mortality. According to Gómez y Carrera (65) proper hematocrit levels prevent from left ventricular hypertrophy, improve cognitive capacity, quality of life and physical functioning. Collins (66) concluded that low hematocrit of ESRD at entrance to HD 30.
(32) INTRODUCTION. should be increased until levels ranging from 33 to 39%, unless patients present cardiac disease. In Elderly CKD patients risk of death after a myocardial infarction was higher if the hematocrit was low (67).. Diabetes, cardiovascular disease and longer time on HD treatment decreases survival (7,59,60,63,68). At predialysis stage, comorbidity is also associated with lower survival (13).. Hemodialysis adecuacy influences survival. Thus, Owen et al. (63) concluded, after analysing retrospectively 13.473 patients on HD, that urea reduction ratios during dialysis bellow 60% were associated with increased odds ratios for death. They found that diabetic patients had lower serum albumin concentrations and urea reduction ratios than non diabetic patients. According to Desmeules et al. (69) creatinine-based indices better predict survival than traditional urea kinetic models (KtV).. Physical activity (PA) level and physical functioning of HD patients predicts survival. Sedentary behaviour has been associated with increased risk of death at 1 year (59). Similarly, exercise capacity measured by VO2 peak is a powerful predictor of survival over 3.5 years follow-up (7). Finally, higher handgrip strength increases probability of survival (64).. Health related quality of life (HRQoL) is defined as subject’s subjective perception of level of wellbeing and satisfaction associated to life, and how it is affected by illness, accidents and treatments (77). HRQoL, as measured by the Medical Outcomes Survey short form (SF-36) subscales and components, has been analysed in relation to survival. By one hand, DeOreo (70) reported that physical function (PF) 31.
(33) INTRODUCTION. scores were predictive of outcomes, so that patients scoring <34 on the physical component scale (PCS) had increased the probability to die or to be hospitalized. This measure predicted mortality so as catabolic rate or Kt/V. PF and general health, both subscales included in the PCS, have been associated with better survival (59). Additionally, the PCS in diabetic HD patients, and the mental component scale (MCS) in both diabetic and nondiabetic HD patients independently predicted mortality and morbidity in a Spanish study including 34 different hospitals (9). By the other side, attendance to group activities aimed to teach coping skills to HD and CRF through group discussions increase survival (61).. Concerning morbidity, Stehman-Breen et al. (56) found a higher risk of hip fracture on ESRD patients compared to general population, which was worsened in case of older age, female, Caucasian race, lower body mass index (BMI), and presence of peripheral vascular disease.. Therefore, survival is influenced by some modifiable factors, such as HRQoL, PA, and physical functioning, and interventions should address them in order to improve survival and decrease morbidity of ESRD patients in HD.. 1.4. PSYCHOLOGICAL FEATURES OF PATIENTS ON HEMODIALYSIS. Evidence on three basic psychological features is found in this cohort: depression, anxiety and low HRQoL.. 32.
(34) INTRODUCTION. According to the literature, depression is found in 20 up to 66% of patients on HD (71-75), and it is a principal cause of fatigue upon arising (76). Concerning anxiety, rates on the literature range from 20 to 52% (71-73,75). Both depression and anxiety are associated with severity of symptoms such as vascular pain and restless legs (71).. HRQoL has been compared between general population and HD patients, and one of the most popular general tools to measure it is the Medical Outcomes Survey short form (SF-36), which gives measures of 8 subscales and two components, physical and mental. All subscales of SF-36 are significantly lower in HD patients compared to healthier counterparts (24,70,78-81), and this difference is more important in the physical function subscales (82). Factors such as diabetes (9), poor sleep (83), older age (84), female sex and diagnosis of musculoskeletal disease (81) are associated with lower HRQoL. Hemoglobin normalization so as nutritional status indicators (appetite, dietary energy intake, serum albumin and serum creatinine) have been found to be positively associated with HRQoL (85).. 1.5.. PHYSICAL. ACTIVITY. AND. PHYSICAL. FUNCTIONING. IN. HEMODIALYSIS PATIENTS. This section reviews the PA level in ESRD patients on HD and the factors influencing it. Physical functioning is defined, and evidence on HD patients is presented, measured with objective laboratory tests, functional performance tests and self-reporting measures.. PA is the movement of any part of the body produced by the contraction of the muscles that increases the energy expenditure (86). PA level has been found to be low 33.
(35) INTRODUCTION. in HD patients, so that 60% are unable to perform any kind of activity apart from activities of daily living (ADL), 12,5% are unable to deambulate or transfer (59), and only 12% report the recommended levels of cardiovascular exercise (78). Additionally, only 6.6% of patients that are working at initiation of dialysis keep their job after 1 year (87).. PA measured directly by accelerometry in ESRD patients in HD is low compared to healthy counterparts (35% less active HD patients compared to sedentary healthy counterparts) (88). Indirect measure by PA questionnaires, as the seven-day recall questionnaire, showed lower activity levels is some studies (24,88,89) while in others (90) significant differences between PA in HD, CAPD and healthy controls were not found. It seems that activity questionnaires are designed for use in healthy populations and may be less sensitive to differences at the lower end of spectrum of activity (88).. Age is an important factor when looking at PA level of HD patient (59,88), so that PA declines in the dialysis patients at a rate of 3.4% per month over one year period (88). Other factors increasing the probability of low PA level are being woman, prevalence of cardiac disease and peripheral arterial disease, low predialysis systolic and diastolic blood pressure, HD treatment compared to PD, low educational level, and lack of employment before starting dialysis (59). A qualitative study identified mental and physical fatigue and low functional capacity as the main factors explaining the low PA level found in CRF patients (91). Creatinine and albumin concentration, as measures of nutritional status, correlate with PA level (92). Interventions giving specific information and encouragement to increase PA in HD patients result in increased activity level in this cohort (79). 34.
(36) INTRODUCTION. Physical functioning is defined as an individual’s ability to perform activities required in their daily living (93), and is determined by many factors, including physical fitness. Physical fitness is a set of attributes (cardiovascular fitness, strength and flexibility) that people have or achieve that relates to the ability to perform PA (86). Cardiorespiratory fitness is often referred to as exercise capacity, and it relates to the ability of the cardiac, circulatory, and respiratory systems to supply and use oxygen during sustained PA (86).. Physical Functioning can be measured using objective laboratory measures, physical performance testing or self-reported measures. It needs to be measured with different instruments to cover all areas, and tools should be tailored to specific population needs (94).. 1.5.a. Objective laboratory measures. The graded exercise test (GXT) is a tool that objectively measures cardiorespiratory fitness, either measured by maximal oxygen uptake (VO2 max), exercise time or METS (1 MET is the level of energy expenditure equal to 3,5 ml O2/kg/min) achieved. Most ESRD patients stop this test due to muscular fatigue (11,34,85,95-97). In such cases the intensity achieved is not enough to stress the cardiorespiratory system and the test gives a measure of VO2 peak (94). According to Sangkabutra et al. (98), a possible explanation of early muscle fatigue is the poor extrarrenal regulation of potassium during and following an incremental exercise test, although previous studies did not support this finding (96).. 35.
(37) INTRODUCTION. Exercise capacity has been found to be low in ESRD patients on HD. In their review Deligiannis et al. (11) concluded that reduction in peak VO2 may achieve 50% of the general population values, with values around 15-25 ml/kg/min that are lower than other chronic diseases. Compared to renal transplant patients, HD patients present lower VO2 peak values (95). Before EPO treatment was part of the patient’s care routine, several studies showed a reduction on time (15,99-102) and VO2 peak (14,15,47,99,100) attained on the GXT by young HD patients (29 to 38,5 years mean age, and Hemoglobin 7 to 8 g/dL), with mean values on HD patients showing a reduction of 44 to 50% compared to sedentary health controls.. Posterior studies with partial correction of anemia (39% lower hematocrit in HD group) by EPO, including samples of young HD patients (26 years old), showed reductions of 44% in VO2 peak values compared to healthy sedentary controls (95,98). Studies where anemia correction achieved higher levels, reported as 27% lower hematocrit (11) or 15% lower hemoglobin (27,103,104), in HD patients (aged 44 to 63 years) still showed lower VO2 peak values in HD patients that ranged from 61% to 19% (11,19,27,103-105). Several studies (85,106) compared patients with high (13 to 14g/dl) and low (10g/dl) hemoglobin levels and concluded that normalized hemoglobin level was associated with higher VO2 peak both in young and old HD patients, although it remained below that predicted for comparable sedentary controls. The modest in VO2 peak values after hemoglobin normalization could be explained by the significant reduction in peak blood flow to exercising muscle and remaining abnormally low values of O2 conductance from muscle capillary to the mitochondria (107). This idea is supported by the fact that several studies report no improvement on exercise capacity after hemoglobin normalization (106,108). Painter et al. (106) found that increasing hematocrit using recombinant human EPO did not change VO2 peak unless the patients 36.
(38) INTRODUCTION. were involved in exercise training. Nevertheless exercise may not restore VO2 peak normal values (11,27,30,105,106,109).. 1.5.b. Physical performance testing. As highlighted by Painter (94), it is possible that more than 50% of dialysis patients are physically not capable of performing a symptom-limited exercise test. Rigor of progressive exercise testing as an outcome measure limits studies to only healthiest dialysis patients. Additionally, changes in VO2 peak may not be sensitive measures of overall improvement in physical functioning as a result of interventions such as exercise training (110). The interest on physical functioning of older and diseased populations has lead to development of tests that measure physical performance of pre-determined tasks, such as walking during 6 minutes (6 minutes walking test, 6MWT), rising from a chair (‘sit to stand’ tests, STS 10 measuring time to perform 10 repetitions and STS 60 measuring repetitions performed on 60 seconds), stair climbing and gait speed. These tests are referred to as physical performance tests and are not direct measures of cardiovascular fitness, flexibility or strength but are indicators of physical fitness measures (94). Additionally, these tests referred by Mercer et al. (111) as functional capacity assessments may enhance information on the patient’s nutritional status.. ESRD patients on HD present lower levels in physical performance tests compared to healthy sedentary counterparts (29,78,112-115) that are already evident on the predialysis stage (116). STS 10 in patients aged 43 to 60 years shows values that range from 50% (113,115) to 85% (78,117) bellow the sedentary population. Concerning 6MWT, values reported in the literature on patients of different ages (43 to 60 years old) range from 522 to 347 meters (29,78,114,115) which are bellow normal 37.
(39) INTRODUCTION. values for sedentary healthy counterparts (118). General fatigue and weakness in the legs is reported by patients at tests termination (113).. Factors influencing performance tests are not only age and comorbidity, but also dialysis related factors such as Kt/V and albumin concentration (112,113). The relationship found between muscle cross sectional area, muscle strength and physical performance measures suggest that weakness from muscle atrophy is an important cause of reduced physical function (24).. 1.5.c. Self-reported measures. Last possibility to measure physical functioning is by self-reported measures. Self-reported physical function can be assessed by the physical function (PF) subscale of the SF-36 (94), that measures to which extent the patient has limitation on daily PA. PF subscale deteriorates over time on the general population, and is lower in females than in males (119,120). Literature show lower PF in HD compared to healthy counterparts, with values that range from 11 to 47% (9,70,78,80,114,117,121,122) of those in healthy population. Physical scales deteriorate over time among HD patients (79).. Thus, PA level on HD patients is lower than sedentary healthy population. Physical functioning of ESRD population on HD is low when measured by objective laboratory measures, physical performance tests and/or self-reporting measures. In the next section a summary of the benefits achieved by HD patients exercising on different regimens are reviewed.. 38.
(40) INTRODUCTION. 1.6. EVIDENCE ON EXERCISE BENEFITS FOR ESRD PATIENTS. During the last three decades different exercise programs have been implemented on CRF patients around the world. Tables I-III summarize, in three blocks (aerobic, progressive resistance training-PRT and combined exercise) the main characteristics and outcomes of the studies performed on this field of research. A whole overview highlighting the main facts of all the studies implementing exercise programs on HD patients is reported in Table IV.. 1.6.1. AEROBIC TRAINING PROGRAMS. Concerning aerobic training (Table I) since 1980 until 2005, most of these studies (24/28) demonstrated a beneficial effect of exercise on the cardiorespiratory fitness (graded exercise test), while few of them evaluated the impact of the intervention on anxiety, depression and/or HRQoL (9/28). Additionally, very few of them included measures of physical functioning (7/28).. 39.
(41) INTRODUCTION. Table I. Aerobic Training Programs Authors (year) Country. Eidemak et al. (1997) DENMARK (122). N. Study groups (age mean ± SD). Exercise intervention Delivery Design. prescription. GFR= 25ml (min.1,73 m2) RCT. Bycicle, swimming, running, walking 60-75% VO2max 30 min Daily. 72. RHB counselling Exercise couching Low I 14 strengthstretching exercises Independent walking Exercise diary 1h/week 1-3 months 1h/month 4-6 months. 24. 30. Exercise N=15 (45) Control N=14 (45). Fitts et al. (1999) USA(123). 36. DC N=9 (48,7 ± 14,6) PC N=9 (50,1 ± 12,1) DR N=9 (44,7 ± 9,4) PR N=9 (44,4 ± 11,4). HB RCT. Goldberg et al. (1980) USA(99). 6. Exercise (37,3 ± 8,9). ND. Goldberg et al (1983)(100) Goldberg et al. (1986)(15) Harter et al. (1985)(124) USA. 25. Exercise N=13 (40 ± 4) Control N=12 (36 ± 3). Exercise 1 N=16 (46,4 ± 13,9) Konstantinidou. et al. (2002) GREECE (30). Koufaki et al. (2002a)(90) UK. Koufaki et al (2002b)(92) UK. Outcomes. ND RCT. ND RCT. Cycle, walking, jogging, callisthenics 65-75% VO2 peak. Walking, cycle 50-80% VO2 peak 45-60 min 3x/week. Aerobic training 60-70% HRmax 60 min 2x/week Swimm, basket, football 1x/week Cycle 30 min ↓ I lower body strength and flexibility 30 min 70% HRmax 3x/week. weeks. 36. 12. 24. Exercise 2 N=10 (48,3 ± 12,1). ID. Exercise 3 N=10 (51,4 ± 12,5) Control N=12 (50,2). HB. Home program Cycle and flexibility 50-60% HRmax 5x/week. 33. Exercise N=18 (57,3) Control N=15 (50,5) HD+PD. ID RCT. Cycle 90% VT 2 bouts x 20 minutes 3x/week. 12. 18. Exercise 8 HD+10 PD (54,3 ± 17,1). ID. Cycle 90% VT 40 minutes 3x/week. 24. 48. Variable VO2max GFR Total cholesterol Triglycerides VLDL cholesterol LDL cholesterol HDL cholesterol QoL (SIP) ↓ better DR PR Karnofsky DR ↓ worse PR Symptoms checklist DR PR 6MWT DR PR Plasma triglyceride VLDL triglyceride HDL cholesterol Fasting plasma glucose glucose disappearance R Fasting plasma insulin Hematocrit Hemoglobin VO2 peak GXT duration VO2 peak GXT duration Plasma triglyceride VLDL triglyceride VLDL cholesterol HDL glucose disappearance R Insulin affinity Basal insulin levels Hematocrit RBC mass Hemoglobin RBC survival BDI (depression) Exercise group 1 VO2peak GXT duration VEpeak VT Exercise group 2 VO2peak GXT duration VEpeak VT Exercise group 3 VO2peak GXT duration VEpeak VT VO2peak VO2-VT GXT workload Oxygen Uptake kinetics STS 5 STS 60 NSRI walk VO2peak % patients ↑ >SEM 3 m % patients ↑ >SEM 6 m VO2 kinetics % patients ↑ >SEM 3 m % patients ↑ >SEM 6 m. %mean change +8 -1,03 +13,22 -23,4 -4,17 +15,4 +4,9 ↓ ↓ ↓ No ↑ ↓ -16,8 ↑ ↑ +39,2 -44,3 +23,0 -6,3 +22,5 -40,1 +24,8 +29,0 +22 +41 +17-21 +19-26 -23-33 -30-38 -16 +16-21 +35-48 +25-71 -20-21 +27 +27 +16-26 +46 -42. P 0,05b NS 0,05b NS NS NS NS NS <0,05a NS <0,01a NS <0,01b <0,02 <0,02 <0,05 <0,01 <0,01 <0,01 <0,01 <0,04 <0,10 <0,02 ≤0,01b ≤0,01b ≤0,05b ≤0,05b ≤0,05b ≤0,02b ≤0,05b ≤0,01b ≤0,05b ≤0,01b ≤0,02b ≤0,01b ≤0,02b ≤0,01b. +43 +33 +41 +37. ≤0,05a ≤0,05a ≤0,05a ≤0,05a. +24 +22 +12 +18. ≤0,05c ≤0,05c ≤0,05c ≤0,05c. +17 +14 ↑ +8 +15,8 +11,7 +27,4 -25,79 -22,3 +29 ↓ +9,6 61 89 +23,8 55 55. ≤0,05c ≤0,05c ≤0,05c ≤0,05 <0,05a <0,05a <0,05a 0,059 <0,05a <0,05a <0,05 <0,05 -. 40.
(42) Authors (year) Country. Kouidi et al. (1997)(71) GREECE. n. Study groups (age mean ± SD). prescription. ND RCT. Cycle, walking/JOG, callisthenics, aerobics, swimming, ball games 50-70% VO2peak 90 min 3-4x/week. 24. ND RCT. Aerobic training 60-80% HRmax 60 min 2x/week Swimm, basket, football 1x/week. 4 years. ID. Cycle and coordination + ↓ I lower body strength exercise RPE 13 60-90 min 3x/week. ND. 10 min warming-up 60 min cycling 10 min stretching 10 min cool-down I 40-60% peak HR 3x/week. ID. High I cycle RPE 9 warming-up RPE 17 main phase RPE 7 recovery 2 min x 15 times 3x/week. ID No RCT. Cycle to tolerance ≤30 min 3x/week. ND RCT. Step exercise, cycle, aerobics RPE 14-17 60 min, 2x/week. 20. 11. Exercise (47,3). ID. Cycle ≥ 70% HRpeak RPE 6/10 ≤60 min 3x/week. 12. 10. Exercise N=6 (67) Control N=4 (66). ND RCT. Aerobic exercise. 18. 34. Exercise N=23 (40 ± 16) Control N=11 (32 ± 12). ND RCT. 10 min warming-up 30 min cycling 15 min games I 50-70% HRpeak 3x/week. 18. 31. Exercise N=20 (49,6 ± 12,1) Control N=11 (52,8 ± 10,2). 34 Exercise 2 N=18 (53,5 ± 10,8). Levenglou et al. (2004)(126) TURKEY. Macdonald et al. (2005)(127) UK. Miller et al. (2002)(128) USA. Molsted et al (2004)(82) DENMARK. Moore et al. (1993)(31) USA. Moros et al. (1995)(129) SPAIN. Moros García et al. (2000)(105) SPAIN. Outcomes. Delivery Design. Exercise 1 N=16 (52,9 ± 11,3) Kouidi et al. (2004)(125) GREECE. Exercise intervention. 14. 9. 56. 20. Exercise (33,1 ± 13,1). Exercise (48,4 ± 5,3). Exercise N=24 (52,8 ± 16,0) Control N=32 (56,1 ± 15,2) Exercise N=11 (59) Control N=9 (48). %mean change. P. VO2peak GXT duration BDI (depression) QLI – patient activity QLI – daily living QLI – health QLI – support QLI – outlook After 1 year Exercise 1/ Exercise 2 VO2peak GXT duration VEpeak VT HRpeak After 4 year Exercise 1/ Exercise 2 VO2peak GXT duration VEpeak VT HRpeak VO2peak GXT duration GXT workload STS 10 6MWT BDI (depression) KDQoL SF-36 PCS KDQoL SF-36 MCS. +38,1 +40,8 -34,8 ↑ ↑ ↑ ↑ ↑. ≤0,05b ≤0,05b ≤0,05a ≤0,05a ≤0,05a ≤0,05a ≤0,05a ≤0,05a. +47+34 +38+26 +24+13 +39+29 ↑. ≤0,05a ≤0,05a ≤0,05a ≤0,05a ≤0,05. +70+50 +53+43 +43+26 +52+42 ↑ +20 +27 +20,8 -16,9 +18,8 +28,6 -. ≤0,05a ≤0,05a ≤0,05a ≤0,05a ≤0,05 0,006 0,002 0,002 <0,001 0,002 <0,001 0,002 0,004. 12. LBM Quadriceps strength STS 30 IGF-I, IGFBP-3 BP medications. No ↑ +19 +20 No ↑ -30. <0,05 <0,05 <0,05. 24. BP Number of anti-HP Expenditure on anti-HP. No ↓ -36% ↓. 0,018a 0,005a. VO2peak SF-36 P Functioning SF-36 Bodily Pain SF-36 PCS VO2peak Peak workload Submaximal HR PFK activity Type I muscle fibre area type II muscle fibre area Capillaries/fibre Ratio Systolic BPpeak Diastolic BPpeak HRmax GXT duration GXT workload FVC GHQ (↑ improvement) Hematocrit Systolic BPrest Diastolic BPrest VO2peak VCO2 GXT duration GXT workload HRmax Systolic BPmax Diastolic BPmax. ↑ ↑ ↑ ↑ +13,5 +16,6 ↓ ↑ No ↑ No ↑ No ↑ -0,9 -11,6 +1,1 +18,2 30,7 ↑ ↑ +14,2 -8,5 -5,5 +24,4 +27,8 +29,1 +36,2 +3,7 -3,4 -5,7. 0,012a 0,01a 0,03b 0,004b <0,1 ≤0,05 ≤0,05 ≤0,05 NS NS <0,05b <0,05b <0,05b <0,05b <0,05b <0,01b <0,01b <0,001b <0,001b <0,001b <0,001b NS NS NS. weeks. 12. Variable. 41.
(43) Authors (year) Country Mustata et al (2004)(130) CANADA. Painter et al. (1986)(101) USA. Painter et al. (2002)(106) USA. Parsons et al. (2004)(131) CANADA. Pechter et al. (2003)(132) ESTONIA. Sakkas et al. (2003)(35) UK. Shalom et al. (1984)(102) USA. Storer et al. (2005)(27) USA. Suh et al. (2002)(133) KOREA. Violan et al. (2002)(95) SPAIN. n. 11. 20. 48. 13. 26. 15. 14. 24. Study groups (age mean ± SD) Exercise (55,5 ± 4) Exercise N=14 (42 ± 10) Control N=6 (42 ± 16) Exerc.+EPO N=12 (43,5) Exercise N=10 (47,6) EPO only N=12 (50,1) Control N=14 (43,3) Exercise N=6 (60) Control N=7 (49). Exercise N=17 (52) Control N=9 (48). Exercise 6 HD + 9 PD (60 ± 12). Exercise N=14 Compliant (46,4); Non compliant (44,4) Exercise N=12 (44 ± 9) Control N=12 (39 ± 9) Healthy N=12 (44 ± 12). 14. Exercise (42 ± 10). 21. Exercise N=9 HD (27,1 ± 4,1) N=12 TX (35,1 ± 12,9). Exercise intervention. Outcomes. Delivery Design. prescription. weeks. ND. Treadmill or cycle 60 min 2x/week. 12. ID No RCT. Cycle 65-85% VO2peak 30-45 min 3x/week. 24. ID RCT. ID RCT. Moderate CRF No RCT. ID. ND. ID No RCT. Cycle RPE 12-14 70% HRpeak Intervals 2-3min RPE 15-17 30 min 3x/week Cycle 40-50% maximal work capacity 45 min (15 min/hour) 3x/week ↓ I aerobic exercise vertically in pool 24ºC Shoulder immersion 10 min warming-up 10 min 10 min cool-down 2x/week Cycle 90% VT 40 min continuous 3x/week. Cycle, walking, jogging, callisthenics Up to 75-80% HRmax 45 min, 5 x/week. Cycle 50% Peak work 20 min at initiation until 40 min 3x/week. 20. 8. 12. 24. 12. 9. ND. Bicycle ergometer, treadmill, upper limb ergometer 60 min 3x/week. 12. ND. Stretching, walking, jogging, ball games 60% peak HR 50 min 3x/week. 24. Variable Arterial stiffness Pulse pressure (mm Hg) Systolic BP Insulin resistance VO2peak at 3rd month VO2peak at 6th month Vertical work capacity Hematocrit Total cholesterol HDL-cholesterol. Post-hoc analysis exercise groups: VO2peak SF-36 Physical Function. %mean change ↓ ↓ ↓ No ↑ +17 +23 +40 No ↑ No ↓ No ↑. P 0,01 <0,05 <0,05 ≤0,05b ≤0,05b ≤0,05b -. ↑. 0,028a 0,015a. GXT workload Blood urea clearance Dialysate urea clearance QoL (SF-36). No ↑ No ↑ ↑ No ↑. ≤0,05b -. VO2peak GXT workload Systolic BPrest Diastolic BPrest Cystatin-C in serum GFR LPO GSH CSA gastrocnemius Type I fibres Type IIa fibres Type IIX fibres Atrophy % Type I Atrophy % Type IIa Atrophy % Type IIX Capillary profile. +2,1 +14,9 -5,4 -3,4 -17,6 +6,7 -34,4 +15 46 32 54 36 -36 -37 -30 +24. NS <0,05b <0,05b <0,05b <0,05b NS <0,05b <0,05b <0,01 <0,01 <0,01 NS <0,05 <0,05 <0,05 <0,05. GXT workload VO2peak (compliant) Oxygen pulse (compliant) STAI (anxiety,↑ worse). ↑ ↑. <0,05 0,001. ↑ No ↓. 0,026 -. VO2peak Endurance time GXT workload Strength 5 RM leg press Power (watts/Kg) Fatigability Stair climbing task Timed up-and-go Walking speed Hematocrit VO2peak GXT duration STAI (anxiety ,↑ worse) Depression (↑ worse) QoL VO2peak HRmax Minute ventilation GXT workload VT. +22 +144 +46 +16 +15 +43 +14 +12 +19 +1,43 +13,3 +25,6 -10,6 -11,4 +7,3 +7,7 No ↑ No ↑ No ↑ No ↑. <0,05a <0,05a <0,05a 0,002a <0,05a <0,05a 0,031b 0,012b 0,003b NS 0,013 0,002 0,004 0,073 0,031 NS -. 9,6-15,7. 42.
(44) INTRODUCTION Anti-HT = Anti-hypertensive medications; BDI = Beck Depression Inventory; BP = Blood Pressure; CRF = Chronic Renal Failure; CSA = Cross Sectional Area; DC = Dialysis control; DR = Dialysis rehabilitation; EPO = Erythropoietin; FVC = Forced Vital Capacity; GFR = Glomerular Filtration Rate; GHQ = General Health Questionnaire; GSH = Glutathione reduced form; GXT = Graded Exercise Test; HB = Home Based; HD = Hemodialysis; HDL = High Density Lipoprotein; HP = High Pressure; HRmax = Maximal Heart Rate; I = Intensity; ID = Intra-dialysis; IGF = Insulin-like Growth Factor; IGFBP-3 = IGF binding protein 3; JOG = Jogging; LBM = Lean Body Mass; LPO = Products of lipid peroxidation; m = Months; min = Minutes; MCS = Mental Component Scale; ND = Non-dialysis time; No RCT = Nonrandomized Controlled Trial; NS = Non significant; NSRI walk = North Staffordshire Royal Infirmary walk Test; P = Physical; PC = Predialysis control; PCS = Physical Component Scale; PD = Peritoneal Dialysis; PFK = Phosphofructokinase; PR = Predialysis rehabilitation; QLI = Quality of Life Index; QoL = Quality of Life ; R = Rate; RBC = Red Blood Cell; RCT = Randomized Controlled Trial; RHB = Rehabilitation; RPE = Rate of Perceived Exertion; SEM = Standard Error of Measurement; SF-36 = Medical Outcomes Survey Short Form; SIP = Sickness Impact Profile; STAI = State Anxiety Inventory; STS = Sit to Stand to Sit test; TX = Renal Transplant; VEpeak = Peak Ventilation; VO2 max = Maximal Oxygen Consumption; VLDL = Very Low Density Lipoprotein; VT = Ventilatory anaerobic Threshold; ↓ = Decrease; ↑ = Increase; 6MWT = Six Minutes Walking Test a Significant change over time vs. comparison group. b Significant vs. baseline values within group. c Significant vs. control group only.. 43.
(45) INTRODUCTION. 1.6.2. PROGRESSIVE RESISTANCE TRAINING PROGRAMS. All the PRT studies (Table II) were implemented more recently (since 2001 until 2008) and demonstrated an increase in strength (8/9), and only some of the studies reporting results on physical functioning tests demonstrated an improvement (4/6). Similarly, improvement on HRQoL was found in 3 out of 4 studies.. 44.
(46) INTRODUCTION. Table II. Progressive Resistance Training Programs Authors (year) Country Castaneda et al. (2001)(134) Castaneda et al. (2004)(135) USA. Cheema et al (2007)(114) Australia. Headley et al (2002)(115) Nindl et al (2004)(136) USA. N. Study groups (age mean ± SD). 26. PRT + ↓ protein diet N=14 (65 ± 9) Placebo EX + ↓ protein diet N=12 (64 ± 13). 49. Exercise N=24 (60 ± 15,3) Control N=25 (65 ± 12,9). 10. Exercise (42,8 ± 4,4) HD vintage (41,6 ±19 months). Exercise intervention Delivery Design. GFR ≈ 25ml (min.1,73 m2) RCT. ID RCT. ND HB. prescription Placebo: stretching and flexibility EX PRT: UL and LL: chest press, latissimus pull-down, knee flex-ext, leg press 80% 1RM 3 sets x 8 reps 45 min. 3x/week 10 exercises (shoulder press, side raise & ER, triceps ext, biceps curl; knee ext & flex, hip flex & abd, SLR) 2 sets x 8 reps RPE 15-17 3x/week Machine weight exercises (9) UL, LL 3 sets x 15 reps RPE<15 2x/week Exercises with elastic bands at home 1x/week. Outcomes weeks. Variable. 12. Strength Total potassium Type I fibre area Type II fibre quadriceps C- reactive protein Interleukin-6 Albumin Transferrin Weight. %mean change +32 +4 +24 +22 -21,8 -37,2 +3 +44,9 ↑. 12. Muscle CSA Total Strength BMI SF 36 Physical Function SF 36 Vitality 6MWT. +1,15 +15,5 +1,11 +10,3 +4,8 +3,4. NS 0,002a 0,02a 0,02a 0,02a NS. 12. Peak torque at 90º 6MWT Maximal walking speed STS-10 Percentage body fat C-reactive protein Total IGF-I IGF-1:IGFBP-3 x 10 Ratio. +12,1 +4,7 +7,1 -12,31 +7,1 -50,7 -15,4 -21. ≤0,05 ≤0,05 ≤0,05 ≤0,05 ≤0,05 ≤0,039 ≤0,003. P <0,001b 0,014b 0,031b 0,045b 0,049b 0,012b NS 0,042b 0,049b. Knee ext 3 sets x 20 Strength (1RM) +62,5 0,0001 reps 60% 1RM 60 Static endurance +14,3 NS Heiwe et al. movements per min Dynamic endurance +29,7 0,004 (2001)(116) 25 Static endurance 5 12 6MWT +15,9 0,002 SWEDEN sets x 1 rep (5 sec) Test ‘up and go’ -18,2 0,004 30 min group EX QoL (SIP) No ↑ 3x/week Knee ext 3 sets x 20 Strength +40 0,006 GFR≤ reps 60% 1RM Exercise Dynamic muscular +48,6 NS Heiwe et al. 25ml 60 movements/ min N=7 (76±8) endurance (2005)(26) 12 (min.1,73 Static endurance 5 12 Control Type I fibre area ↑ NS SWEDEN m2) sets x 1 rep (5 sec) N=5 (71± 5) Type IIA fibre area ↑ NS No RCT 30 min group EX Type IIB fibre area No ↑ NS 3x/week Knee extension Exercise LBM -0,63 NS Hip flex, abduction N=20 Quadriceps CSA +2,5 0,02a Ankle dorsiflex, (54,4 ± 13,6) Strength +61,4 <0,0001a ID plantar flex Nandrolone+ 12 Physical Activity RCT Ankle weights Exercise (Accelerometry) +28,4 NS 60% 3RM Johansen et N=20 STS 5 -16,1 NS 3sets x 10 reps al. (2006) 79 (55,5 ± 12,5) SF 36 Physical Function +23 0,03a 3x/week (121) USA Nandrolone Weekly nandrolone LBM +7,2 <0,001a N=19 decanoate (100 mg Quadriceps CSA +9 <0,001a (55,7 ± 13,4) ID ♀;200 mg ♂ ) or Strength +10,7 NS Placebo placebo Physical Activity +65,8 NS N=20 intramuscular STS 5 -12,2 NS (56,8 ± 13,8) injection SF 36 Physical Function +6,5 NS 10 min stretching and GXT workload (METS) +12,6 0,17c Exercise 25 min 4 Ex (knee GXT duration (N=7) +15,9 0,23c N=8 Segura et al. Ext, triple extension 6MWT (N=7) +18 0,009c (54,9 ± 15,6) (2008)(137) 16 No RCT ism and elastic band, 24 STS 10 (N=7) -21,4 0,013c Control SPAIN double knee ext ism) STS 60 (N=7) +9,9 0,04c N=8 3sets x 15 reps SF-36 PCS -8,4 (68,8 ± 16,2) RPE 12-15 3x/week SF-36 MCS +21,2 0,05c Abd = Abduction; CSA = Cross Sectional Area; ctrol = Control; BMI = Body Mass Index; ER = External Rotation; EX = Exercise; Ext = Extension; Flex = Flexion; GFR = Glomerular Filtration Rate; HB = Home Based; HD = Hemodialysis; ID = Intra-dialysis; IGF = Insulin-like Growth Factor; IGFBP-3 = IGF binding protein 3; LBM = Lean Body Mass; LL = Lower Limbs; min = Minutes; ND = Non-dialysis time; No RCT = Nonrandomized Controlled Trial; NS = Nons significant; PRT = Progressive Resistance Training; QoL = Quality of Life ; RCT = Randomized Controlled Trial; reps = Repetitions; RM = Resistance Maximum; RPE = Rate of Perceived Exertion; sec = Seconds; SF-36 = Medical Outcomes Survey Short Form; SIP = Sickness Impact Profile; SLR = Straight Leg Raising; STS = Sit to Stand to Sit test; UL = Upper Limbs; ↑ = Increase; 6MWT = Six Minutes Walking Test a Significant interaction between time and the intervention. b Significant change over time vs. comparison group. c Significant vs. baseline values within group. Exercise N=16 (76±7) Control N=9 (72±6). GFR≤ 25ml (min.1,73 m2) No RCT. 45.
(47) INTRODUCTION. 1.6.3. COMBINED TRAINING PROGRAMS. Finally, Table III summarizes the main facts of 12 studies reviewed on combined (aerobic plus some PRT) exercise programs, which were implemented since 1991 until 2005. Most of the studies (5/6) evaluating the effect of the program on the cardiorespiratory fitness (graded exercise test) demonstrated a beneficial effect. Strength improved in all the studies that measured this variable (4/4), while the intervention improved physical functioning tests in 4 out of 5 studies. Additionally, 5 studies evaluated the impact on HRQoL measured by different questionnaires. From them, the study with the highest sample size of all studies reviewed (79) found positive effect of the intervention in four out of eight subescales of the SF-36 and in the PCS, but no effect was found on the MCS.. 46.
(48) INTRODUCTION. Table III. Combined Training Programs Authors (year) Country. Cappy et al. (1999)(138) USA. Clyne et al. (1991)(139) SWEDEN. Deligiannis et al. (1999b)(19) GREECE. Deligiannis et al. (1999a)(11) GREECE. DePaul et al. (2002)(29) CANADA. N. Study groups (age mean ± SD). 16. Exercise (53,9 ± 15) Years on HD 4,9 ± 5,6. 19. Exercise N=10 (63 ± 14,5) Control N= 9 (59 ± 12,3). 60. Exercise N=30 (48 ± 12) Control N= 30 (48 ± 11). Exercise 1 N=16 (46,4 ± 13,9) 38. 29. Exercise 2 N=10 (51,4 ± 12,5) Control N=12 (50,2 ± 7,9) Exercise N=15 (55 ± 16) Placebo N=14 (54 ± 14). Exercise intervention Delivery Design. weeks. Variable. Cycle, treadmill 30 min Stretching and Light weight strengthening exercise. 12. STS-60 60 second stair climb 60 second leg lifts Slow walk 8,5m Brisk walk 8,5m Blood phosphorus Pre-HD SBP. %mean change +21 +101 +27,5 +14 +11 -11 -4. GFR≤ 15ml (min.1,73 m2) No RCT. Interval EX 60-70% max EX capacity. Strength EX. 45 min. 3x/week. 12. GXT workload Static endurance test Dynamic endurance test GFR. +9,4 +46,7 +120,9 -13,3. <0,01 <0,002 <0,001 NS. ND RCT. 10 min warming up 50 min callisthenics, aerobics, swimming, ball games 60-70% HRmax 20 min strength low R and stretching 10 min cooling-down 3-4x/week. 24. +41 +33 +31 +18 +3,8. <0,05a <0,05a <0,05a <0,05a <0,05a. -40. <0,05a. -33. <0,05a. ND RCT. 90 min: warming-up, aerobics, strength exercise low R, stretching 60-70% HRmax 3x/week. 24. VO2 peak GXT duration HRV index SD of R-R interval R-R interval length N patients with HRV index <25 N patients with arrhythmias (low class>II) Exercise 1 LV mass index Ejection fraction Stroke volume index Cardiac output index. +11 +12 +23 +20. <0,05a <0,01a <0,05a <0,05a. HB. Cycle ergometer 30 min at 50-60% HRmax Stretching exercises >5x/week. Exercise 2 No significant adaptations vs. Control group. Cycle 20 min RPE 13 <80% HRpeak Ex quadriceps, hamstrings 50% to 125% 5RM 3sets x 10 reps 3x/week 10 min warming up 50 min aerobics (calisthenics, steps, swimming, ball games) 10 min strength lowR 10 min stretching 10 min cooling-down 3x/week 15 min warming-up Cycle Intervals 3x5 min 72 ± 7% HRpeak RPE 13. 8 exercises muscular endurance 3 sets x 12 reps 2x/week Cycling Circulatory exercises Abdominal strengthening Respiratory exercises 30-40 min Knee ext 3 sets x 15 reps 50% 1RM Cycle 70-85% HRpeak RPE <14, 30 min 2-3x/week. GXT workout Hamstrings + quadriceps strength 6MWT (no encourage) symptoms KDQ HRQoL - SF-36 GXT duration VO2peak Peak blood lactate Nerve conduction velocity Isometric strength Type I muscle fibre area type II muscle fibre area % of type II fibres. +109,5. 0,02a. +37,3 +1 +2 No ↑ +28,8 +48 -16. 0,02a NS NS NS <0,05b <0,05b <0,05b. +12,7 +48 +25,9 +23,7 +23. <0,05b <0,05b <0,05b <0,05b <0,05b. 12. Total walk time Stair climb Stair descent Perceived walk speed Perceived leg weakness perceived breathlessness. -15 +22 +18 +15 +25 +32. ≤0,05a ≤0,05a ≤0,05a ≤0,05a ≤0,05a ≤0,05a. 16. GXT duration GXT workout GHQ anxiety GHQ depression GHQ total. +19,48 +16,6 ↑ ↑ ↑. NS <0,05 <0,05 NS <0,05. 12. 1 RM knee extension SF-36 PCS SF-36 MCS. +82 +24,7 +13. <0,0001 0,0003 0,004. ID. ID RCT. 7. Exercise N=7 (44,1 ± 17,2) Years on HD (4,6 ± 4,1). 16. Exercise N=7 (63 ± 14,5) Control N= 9 (59 ± 12,3). Moros García et al. (1993)(97) SPAIN. 8. Exercise N= 8 (51) HD time 38,2 months. ND. Oh-Park et al (2002)(141) USA. 18. Exercise N= 18 (52). ID. Kouidi et al. (1998)(34) GREECE. Mercer et al. (2002) (140) UK. Outcomes. ND. ND No RCT. prescription. 12. 24. P <0,01 <0,001 <0,001 0,001 0,001 0,05 0,02. 47.
(49) Authors (year) Country. Painter et al. (2000a)(78) USA Painter et al. (2000b)(79) USA. Van Vilsteren et al. (2005)(117) USA. N. Study groups (age mean ± SD). 216. Exercise (55,9 ± 15,1) HD months (33,7 ± 35,6) Control (52,8 ±16,8) HD months (40,2 ± 62,4). 96. Exercise N=53 (52 ± 15) Control N=43 (58 ± 16). Exercise intervention Delivery prescription Design. HB ID noRCT. HB 8 weeks Flexibility 5-6x/week Strength 3x/week 3 sets x 15 reps. Walking/cycle 3-4x/week ID 8 weeks Cycle 30 min 3x/week. ID RCT. Strength preHD 30-40’ ↓ Resistance Cycle HD 20-30 min 60% max capacity Ex counselling TTM: cognitive-behavioural strategies to become active 3x/week. Outcomes weeks. Variable. 16. Habitual gait speed Fastest gait speed STS 10 (n=111) 6MWT (n=44) SF-36 PF (N=216) SF-36 role physical SF-36 general health SF-36 bodily pain SF-36 PCS SF-36 MCS. %mean change +3 +2 +24 +7,7 +12 +35 +9,1 +10,1 +9,1 +4,8. 12. VO2 peak STS-10 Reaction time SF-36 PF SF-36 Vitality SF-36 General Health Depression Kt/V Behavioural change. +10,1 -22,3 -11,1 +10,6 +23,3 +25,4 ↑ +5 ↑. P 0,021a <0,001a 0,05a 0,05b 0,004a <0,001a 0,05a 0,003a <0,001a NS NS 0,05a 0,002a NS <0,05a <0,05a NS <0,05a <0,05a. BP = Blood Pressure; GFR = Glomerular Filtration Rate; GHQ = General Health Questionnaire; GXT = Graded Exercise Test; HB = Home Based; HD = Hemodialysis; HRmax = Maximal Heart Rate; ID = Intra-dialysis; HRQoL = Health Related quality of life; HRV = Heart Rate Variability; ID = Intra-dialysis; KDQ = Kidney Disease Questionnaire; LV = Left Ventricle; PA = Physical Activity; MCS = Mental Component Scale; min = Minutes; ND = Non-dialysis time; No RCT = Nonrandomized Controlled Trial; NS = Nons significant; PCS = Physical Component Scale; PF = Physical Function; R = Resistance; RCT = Randomized Controlled Trial; reps = repetitions; RM = Resistance Maximum; RPE = Rate of Perceived Exertion; SD = Standard Deviation; SF-36 = Medical Outcomes Survey Short Form; STS = Sit to Stand to Sit test; TTM = Transtheoretical; ↑ = Increase; RPE = Rate of Perceived Exertion; 6MWT = Six Minutes Walking Test a Significant change over time vs. comparison group. b Significant vs. baseline values within group.. 48.
(50) INTRODUCTION. Therefore, we could conclude that most of the 1361 participants in exercise programs for ESRD patients have undertaken aerobic programs (Table IV) and have demonstrated beneficial effects on cardiorespiratory fitness. Only 15 out of 49 studies included a sample size above 30 subjects. Despite the diminished strength found in this cohort and the presence of lower limbs fatigue as the main exercise limiting factor, few studies on PRT programs have been performed. Concerning HRQoL and/or physical functioning, some of the studies on PRT or combined programs improved them. In the last decade, for first time, studies on HD patients over 60 years mean age were undertaken, probably due to the tendency of increased age in this cohort and to the previous knowledge of safeness and benefits of these programs for the most disabled patients (79).. 49.
(51) INTRODUCTION. Table IV. Summary of the literature reviewed TYPE OF PROGRAM AEROBIC Number of Studies (Studies on PRE-HD) USA Greece UK Spain Canada Sweden Denmark Australia Estonia Korea Turkey Design RCT Non-RCT Uncontrolled trial Interventions Intra-dialysis Non-dialysis days Home-based Total patients Mean Sample size 1 to 10 patients 11 to 20 patients 21 to 30 patients 31 to 40 patients 41 to 50 patients 51 to 60 patients 61 to 70 patients 71 to 80 patients >81 patients Age of participants Youngest patient Oldest patient Number of studies with mean age ≥60/All studies. PROGRESSIVE RESISTANCE COMBINED TRAINING. TOTAL. 28 (3) 11 3 4 3 2 0 2 0 1 1 1. 9 (4) 5 0 0 1 0 2 0 1 0 0 0. 12 (1) 5 3 1 1 1 1 0 0 0 0 0. 49 (8) 21 6 5 5 3 3 2 1 1 1 1. 15 4 10. 4 3 2. 3 4 4. 22 11 16. 12 13 2 621 24 3 10 7 5 2 1 0 0 0. 3 2 1 217 28 2 2 3 0 1 0 0 1 0. 5 4 2 523 53 2 4 1 1 0 1 0 0 3. 20 19 5 1361 7 16 11 6 3 2 0 1 3. 27 67. 43 68. 44 63. -. 1/28. 6/9. 1/12. 8/49. 50.
(52) INTRODUCTION. There is a gap in the literature on the effects of PRT programs. The implementation of this specific kind of exercise during HD was found only in 2 out of 48 studies reviewed , excluding a pilot study previous to this thesis presentation (137), and none of them found an impact on physical functioning tests (6MWT and STS). Besides, none of these two studies evaluated the impact of PRT on cardiorespiratory fitness. Finally, none of the RCT implementing PRT programs on HD patients included an exercise comparison group. Additionally, none studies on intradialytic exercise have been performed in Spain.. 51.
(53) 52.
(54) 53.
Figure


+4
Documento similar
This study assessed the association of regular chocolate consumption with the physical (PCS) and mental (MCS) components of health-related qual- ity of life (HRQL).. Materials
Statistically significant gender differences were found in certain aspects of the ASI-6 domains: men have more problems of physical health, legal issues, and alcohol and
Efecto del entrenamiento con cargas sobre la grasa corporal en personas obesas: revisión sistemática
To investigate the effects of low- intensity resistance training on body fat, muscular strength, cardiovascular fitness and insulin sensitivity on overweight..
Effects of 7-Week Hip Thrust Versus Back Squat Resistance Training on Performance in Adolescent Female Soccer Players.. Jaime González-García 1, *, Esther Morencos 2 ,
In a previous study of this research group a significant increase of heart rate recovery from a maximum effort after a training protocol of resilience force in intermittent
compared two types of aerobic exercise and resistance training on the iri- sin levels of adult men with metabolic syndrome, finding that resistance but not aerobic training
On the other hand, significantly better scores at the end of the AM 6 program and after 6 months of follow-up as compared with baseline were observed in five subscales
Effects of resistance training on muscle strength, exercise capacity, and mobility in middle-aged and elderly patients with coronary artery disease: A meta-analysis.
![, ].Furthermore,teleworkinghashadasignificantimpactonprofes- controloverworkinghoursandincreasedpsychosocialrisksassociatedwithstressandworkoverload[ tionshavehadtoadapttopublichealthmeasuresregardingsocialdistancingtoreduce ImpactoftheCOVID-19PandemiconTe](data:image/gif;base64,R0lGODlhAQABAIAAAP///wAAACH5BAEAAAAALAAAAAABAAEAAAICRAEAOw==)