Experimental Analysis and Modeling of NOx Emissions in Compression Ignition Engines Fueled with Blends of Diesel and Palm Oil Biodiesel
8
0
0
Texto completo
(2) SFFEV 2016 - Special Session on Simulation of flex fuel engines and alternative biofuel vehicles. number is an indicator of the ignition delay time; higher values correspond to shorter ignition delay times (Ban-Weiss et al., 2007). It has been reported that the sensitivity of NOx to changes in Cetane number is higher at low load than at high load (Lapuerta et al., 2008) which could reduce NOx emissions at low load. Advanced injection timing could produce higher NOx emissions as the combustion stars earlier, and thus the residence time of the burning mixture in the cylinder is increased. An advance in injection timing for biodiesel with respect to petroleum diesel is caused by its higher bulk modulus of compressibility for the biodiesel (BanWeiss et al., 2007). In this paper, a theoretical and experimental analysis of the NOx production using diesel and palm oil biodiesel blends is discussed The mechanism of formation of NOx through the thermal mechanism is presented and a semi-empirical model is applied to determine the NOx formation in the combustion diffusion phase.. 2 2.1. METHODOLOGY Modeling of NOx Emissions in Diesel Engines. During combustion of fuels that do not contain nitrogen in their structure, nitrogen monoxide (NO) is formed from three mechanism: the thermal (Zeldovich), the prompt (Fenimore) and fuel-bound nitrogen (Sun et al., 2010). The thermal mechanism is presented during high temperatures in the combustion chamber when the reaction between the oxygen and the nitrogen is carried out (Miller and Bowman, 1989). The thermal mechanism represents the most important source in the NOx formation (Ban-Weiss et al., 2007) and it is represented by three reactions: O + N2 ↔ NO + N, O + O2 ↔ NO + O and O + OH ↔ NO + H (Sun et al., 2010). Some simplifications have been applied to these equations in order to obtain the general dynamic expression for NOx production presented as d[NO] / dt = 6 · 1016 / T0.5 exp(-69.09 / T) · [O2,eq]0.5 · [N2,eq] (Sun et al., 2010) (Fernando et al., 2006) (Park et al., 2013). The first assumption is that the nitrogen chemistry can be de-coupled from combustion reactions due to the reactions rate of nonnitrogenated species generally occur much faster than that of the nitrogen chemistry, The second approach implies that the concentrations of O, O2, OH, H and N2 can be approximated to the equilibrium temperature. Finally, it is assumed that the radical N is in its steady state. An approach for solving the 246. equation for calculating d[NO] consists in applying a calculation scheme that takes into account the main kinetics aspects for the formation and destruction of NOx in the combustion chamber, which is linked to the engine operating conditions. The main variables include the instant pressure in the combustion chamber, the fuel mass burned rate (FMB), the adiabatic flame temperature (Tad) and the heat release rate (HHR) which are obtained from thermodynamics diagnostics (Timoney et al., 2005) (Park et al., 2013) (Guardiola et al., 2011). Based on the model developed by (Dec, 1997), it is possible to confirm that the premixed combustion phase does not show NOx formation as the higher equivalent ratio reduces the amount of available oxygen. This situation implies that the most important processes for NOx formation occur in the flame front during the combustion by diffusion. Bearing this in mind, the theoretical NOx production is determined in the combustion diffusion phase and the adiabatic flame temperature is the characteristic temperature. The combustion diffusion phase is taken from the values of heat release rate curves between the start of combustion (SOC) and the end of diffusion phase (EOD) (Timoney et al., 2005). The approximated values of adiabatic flame temperature for the biodiesel and their blends with diesel are taken from (Glaude et al., 2010). The equilibrium concentrations are estimated under stoichiometric conditions and constant pressure. The NASA simulation program “Chemical Equilibrium Program” was used for calculating the equilibrium concentrations. Taking into account all the above considerations (Timoney et al., 2005), a final expression for the determination of NOx in each operating point is as follows: eNOx = k ΣSOCEOC Tad0.5 ·ΔFMB · n-1 · P-1 · exp(-0.69 / Tad) · [O2,eq]0.5 · [N2,eq] · ΔCAD, where constant k = Ru 6 · 1016 · (1 + SFAR) / (6 NSTEP M Wb), with FMB calculated based on the rate of heat release, with the lower heating value of each fuel NSTEP and ΔCAD corresponding to the angular resolution.. 2.2. Experimental Setup. Test were carried out in a bench-mounted and instrumented automotive diesel engine (Table 1). The engine was coupled to a 230 kW Eddy current dynamometer. Air and fuel consumptions were measured with a hot-wire sensor and an electronic balanced mass flow sensor, respectively. NOx were measured with chemiluminescense analyzer. Incylinder combustion diagnostics was carried out.
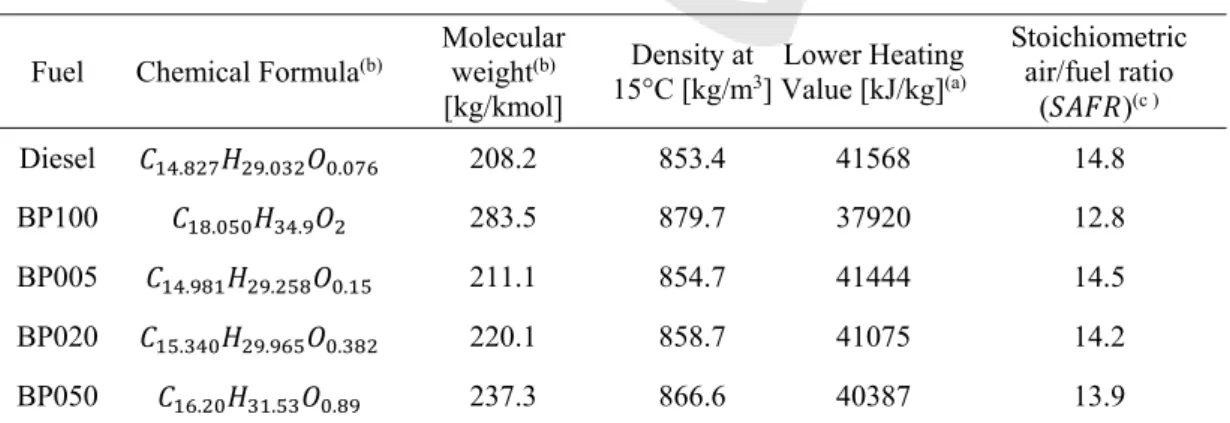
(3) Experimental Analysis and Modeling of NOx Emissions in Compression Ignition Engines Fueled with Blends of Diesel and Palm Oil Biodiesel. using a two species (air and combustion products), single-zone model, based on the approach proposed by (Lapuerta et al., 1999). For recording the instantaneous in-cylinder pressure, a piezoelectric pressure transducer installed on the glow plug and a Kistler 5011B charge amplifier were used. The instantaneous piston position was determined using an angular encoder with a resolution of 1024 pulses/revolution coupled to the crankshaft at the opposite end of the fly-wheel. The angle of start of injection was measured with a clamp-on transducer. Table 1: Engine specifications. Reference Type. ISUZU 4AJ1 Turbocharged, direct injection, rotating pump 2499cm3 4 in-line cylinders 93mm x 92mm 18.4 59kW at 4100 rpm 170Nm at 2300 rpm. Swept volume Configuration Bore x stroke Compression ratio Rated Power Maximum torque. Tests were performed using palm oil biodiesel (BP100), commercial grade diesel fuel and three diesel biodiesel blends (BP5, BP20, BP50). The properties of fuels are presented in Table 2. For each fuel, twelve operation modes, each one characterized by an effective torque (20, 40, 60 and 80 Nm) and engine speed (2000, 2250 and 2500 rpm) were tested, with NOx emission measurements performed in steady state conditions.. 3. RESULTS AND ANALYSIS. 3.1. Experimental Analysis of NOx Emissions. In Table 3, the experimental results of the NOx measurements at different operating conditions and blends of diesel and palm oil biodiesel are presented. The trends in NOx emissions were evaluated using statistical software. The Analysis of variance (ANOVA) shown in Table 4 and the confidence intervals given in Table 5 indicate that the type of biodiesel, speed and torque affect significantly on the NOx emissions. Figure 1 (a) suggests that the NOx formation decreases with an increase of the engine speed for all fuels in all torque settings. Two factors could produce this trend, the mean temperature in the combustion chamber and the residence time of combustion gases. Table 6 shows the highest mean temperatures within the combustion chamber for all operation modes and fuel blends. Although the mean maximum temperature increases with the engine speed at the same load, the time of the residence of the combustion gases decreases leading to low values of NOx in the range of speeds evaluated. It is important to highlight at this point, that in the work of (Agudelo et al., 2010) it was observed that the NOx increases with the speed of the engine in regions near to the maximum torque of the engine (i.e. 170 Nm at speeds lower than 1750 rpm). As it can be seen in Figure 1(b), The NOx formation increases as the Torque goes up. This. Table 2: Fuel properties.. Fuel Diesel. Chemical Formula(b) .. .. BP100. .. BP005 BP020 BP050. . .. .. .. .. .. . .. . .. .. Molecular weight(b) [kg/kmol]. Density at Lower Heating 15°C [kg/m3] Value [kJ/kg](a). Stoichiometric air/fuel ratio ( )(c ). 208.2. 853.4. 41568. 14.8. 283.5. 879.7. 37920. 12.8. 211.1. 854.7. 41444. 14.5. 220.1. 858.7. 41075. 14.2. 237.3. 866.6. 40387. 13.9. (a). calculated from ultimate composition and measured gross heating value calculated from fatty acid methyl esters profile (c) calculated from composition (b). 247.
(4) SFFEV 2016 - Special Session on Simulation of flex fuel engines and alternative biofuel vehicles. (a). (b). (c) Figure 1: Results of variance analysis for NOx. Means and 95% of Fisher LSD. Table 3: NOx emissions at different operating conditions and blends of biofuels. Torque [Nm] 20. 40. 60. 80. n [rpm] 2000 2250 2500 2000 2250 2500 2000 2250 2500 2000 2250 2500. Diesel 568 537 468 940 854 753 1358 1234 1089 1827 1663 1515. BP5 601 516 485 897 867 759 1159 1089 1079 1508 1631 1409. NOx emissions [ppm] BP20 619 566 491 979 862 802 1412 1247 1111 1879 1682 1534. BP50 602 564 491 956 836 724 1402 1228 1105 1900 1646 1461. BP100 565 497 486 856 805 730 1359 1183 1092 1898 1646 1495. Table 4: Variance analysis for NOx emissions. Source. Sum of squares. Gl. Medium square. F-Ratio. P-Value. A Fuel. 65783,6. 4. 16445,9. 4,03. 0,0066. B:[rpm]. 442289,. 2. 221144,. 54,19. 0,0000. C:Torque [Nm]. 1,03112E7. 3. 3,43708E6. 842,22. 0,0000. Residuals. 204049,. 50. 4080,98. Total (Correction). 1,10234E7. 59. Principal effects. 248.
(5) Experimental Analysis and Modeling of NOx Emissions in Compression Ignition Engines Fueled with Blends of Diesel and Palm Oil Biodiesel. Table 5: Mean and least squares for NOx emissions with confidence intervals of 95%. Level. Cases. Means. Means Global Fuel BP100 BP20 BP5. 60. 1058.62. Error Est. Lower Bound. 12 12 12. 1051.0 (1.51%) 1098.67 (-2.86%) 1000.0 (6.29%). 18.4413 18.4413 18.4413. 1013.96 1061.63 962.959. 1088.04 1135.71 1037.04. BP50 Diesel. 12 12. 1076.25 (-0.84%) 1067.17. 18.4413 18.4413. 1039.21 1030.13. 1113.29 1104.21. n [rpm] 2000 2250. 20 20. 1164.25 1057.65. 14.2846 14.2846. 1135.56 1028.96. 1192.94 1086.34. 2500. 20. 953.95. 14.2846. 925.259. 982.641. Torque [Nm] 20. 15. 537.067. 16.4944. 503.937. 570.197. 40. 15. 841.333. 16.4944. 808.203. 874.463. 60 80. 15 15. 1209.8 1646.27. 16.4944 16.4944. 1176.67 1613.14. 1242.93 1679.4. (a). (d). (b). (e). (c). (f). Upper Bound. Figure 2: Heat release curves at low loads operating conditions: 20 Nm at (a) 2000 rpm, (b) 2250 rpm, (c) 2500 rpm, and 40 Nm at (d) 2000 rpm, (e) 2250 rpm, (f ) 2500 rpm.. 249.
(6) SFFEV 2016 - Special Session on Simulation of flex fuel engines and alternative biofuel vehicles. Table 6: Maximum mean temperature in the combustion chamber.. Torque [Nm] 20 40 60 80. n [rpm] 2000 2250 2500 2000 2250 2500 2000 2250 2500 2000 2250 2500. Diesel 1277.23 1390.79 1482.81 1291.93 1423.00 1550.60 1334.43 1481.05 1659.09 1531.19 1634.31 1688.41. Maximum Mean Temperature [K] BP5 BP20 BP50 1259.62 1310.14 1339.17 1365.97 1419.92 1462.61 1420.41 1542.48 1568.07 1254.99 1313.07 1518.04 1493.65 1442.08 1494.96 1503.25 1562.17 1607.92 1318.25 1339.76 1376.44 1450.43 1503.72 1545.67 1115.52 1605.96 1608.45 1512.34 1576.29 1407.86 1611.54 1607.21 1617.11 1611.54 1673.49 1751.85. (a). (d). (b). (e). (c). (f). BP100 1293.06 1413.00 1513.18 1300.15 1429.33 1544.56 1316.89 1487.73 1621.06 1575.24 1595.88 1681.67. Figure 3: Heat release curves at high loads operating conditions: 60 Nm at (a) 2000 rpm, (b) 2250 rpm, (c) 2500 rpm, and 80 Nm at (d) 2000 rpm, (e) 2250 rpm, (f ) 2500 rpm.. behavior is due to the increase of the maximum mean temperature in the combustion chamber as shown in Table 6. The rise of this mean temperature causes the NOx formation and high loads as presented in the heat release rate curves given in Figures (2) and (3). Figure 2 presents the heat release rate curves at low engine loads. As observed in this Figure, the. 250. combustion premixed phase is predominant for all speeds. As the load increases, the combustion diffusion phase is dominant as presented in Figure 3, in which according to (Dec, 1997) the highest emissions of NOx are produced. Finally, the effect of the fuel in NOx formation did not present a unique trend due to the high sensitivity.
(7) Experimental Analysis and Modeling of NOx Emissions in Compression Ignition Engines Fueled with Blends of Diesel and Palm Oil Biodiesel. of the engine to the operating conditions for the blends with palm oil biodiesel. For this reason, it is recommended for future work to determine other physical and chemical properties such as: viscosity, Cetane number and bulk modulus so that the effect of type of fuels blends with palm oil biodiesel can be better understood.. 3.2. Semi-empirical Model for NOx Formation. The equation developed by (Timoney et al., 2005) has been used to establish the theoretical NOx formation in the combustion diffusion phase. Table 7: NOx formation. Fuel. Experimental Theoretical % discrepancy NOx [ppm] NOx [ppm]. Diesel. 1515. 1390. 8.25. BP20. 1534. 1220. 20.47. BP50. 1461. 1420. 2.81. BP100. 1495. 1770. 15.54. The operating point at 2500 rpm and 80 Nm was used for calculating the NOx production thermal mechanism due to its higher combustion diffusion phase. The correlation was not used in the case of fuel BP5 owing to its low combustion diffusion phase. In Table 7 the results are summarized.. 4. CONCLUSIONS. Palm oil biodiesel and its blends with diesel produce variations in the NOx emissions, which increase or decrease according to the engine operation conditions. In general, at high loads the NOx emissions are increased. This behavior can be explained for the high component of the diffusion combustion phase. At low loads, the premixed combustion phase is predominant, thus resulting in a decrease of NOx emissions. The correlations for determining the NOx formation should include parameters such as: Cetane number, Iodine number in order to get a better estimations taking into account the chemical and physical features of the fuels used. The combustion processes in diesel engines is highly complex due to the high number of physical and chemical interactions that occur during the. operation of the engine. Each phenomenon occurs in tridimensional fluxes, turbulent and non-stationary, interacting with a fuel conformed by complex chains of hydrocarbons. In addition, a detailed chemistry mechanism is unknown for the combustion of palm oil biodiesel. Lastly, it is necessary to implement optimization techniques for parameter calibration between the experimental and modeled values.. ACKNOWLEDGEMENTS We would like to thank the GIMEL research group of the Universidad de Antioquia in Medellin for the use of the experimental facilities and advice. Also, we would like to express our acknowledgments to Universidad Cooperativa de Colombia and Istituto Motori of the CNR for their financial support under the project No. 1510 and the Cooperation Agreement No. 0000720. COST (European Cooperation in Science and Technology) Action FP1306 support is also gratefully acknowledged.. REFERENCES Agudelo, A. F., Agudelo, J. R. Benjumea, P. N., 2007. Diagnostico de la combustion de biocombustibles en motores, Universidad de Antioquia. Agudelo, J., Bunjumea, P., Villegas, A. P., 2010. Evaluation of nitrogen oxide emissions and smoke opacity in a HSDI diesel engine fuelled with palm oil biodiesel. Revista Facultad de Ingeniería Universidad de Antioquia, 62-71. Ban-Weiss, G. A., Chen, J. Y., Buchholz, B. A., Dibble, R. W., 2007. A numerical investigation into the anomalous slight NOx increase when burning biodiesel; A new (old) theory. Fuel Processing Technology, 88, 659-667. Dec, J. E., 1997. A conceptual model of di diesel combustion based on laser-sheet imaging*. SAE technical paper 970873, doi: 10.4271/970873. Eckerle, W. A., Lyford-Pike, E. J., Stanton, D. W., Lapointe, L. A., Whitacre, S. D., Wall, J. C., 2009. Effects of Methyl Ester Biodiesel Blends on NOx Emissions. SAE International Journal of Fuels and Lubricants, 1, 102-118. Fernando, S., Hall, C., Jha, S. 2006. NOx Reduction from Biodiesel Fuels. Energy & Fuels, 20, 376-382. Glaude, P.-A., Fournet, R., Bounaceur, R., Molière, M., 2010. Adiabatic flame temperature from biofuels and fossil fuels and derived effect on NOx emissions. Fuel Processing Technology, 91, 229-235. Guardiola, C., López, J. J., Martín, J. García-Sarmiento, D., 2011. Semiempirical in-cylinder pressure based model. 251.
(8) SFFEV 2016 - Special Session on Simulation of flex fuel engines and alternative biofuel vehicles. for NOx prediction oriented to control applications. Applied Thermal Engineering, 31, 3275-3286. Lapuerta, M., Armas, O., Hernández, J. J., 1999. Diagnosis of DI Diesel combustion from in-cylinder pressure signal by estimation of mean thermodynamic properties of the gas. Applied Thermal Engineering, 19, 513-529. Lapuerta, M., Armas, O., Rodríguez-Fernández, J., 2008. Effect of biodiesel fuels on diesel engine emissions. Progress in Energy and Combustion Science, 34, 198223. Miller, J. A., Bowman, C. T., 1989. Mechanism and modeling of nitrogen chemistry in combustion. Progress in Energy and Combustion Science, 15, 287-338. Park, W., Lee, J., Min, K., Yu, J., Park, S., Cho, S., 2013. Prediction of real-time NO based on the in-cylinder pressure in Diesel engines. Proceedings of the Combustion Institute, 34, 3075-3082. Sun, J., Caton, J. A., Jacobs, T. J., 2010. Oxides of nitrogen emissions from biodiesel-fuelled diesel engines. Progress in Energy and Combustion Science, 36, 677695. Timoney, D. J., Desantes, J. M., Hernández, L., Lyons, C. M., 2005. The development of a semi-empirical model for rapid NOx concentration evaluation using measured in-cylinder pressure in diesel engines. Proceedings of the Institution of Mechanical Engineers, Part D: Journal of Automobile Engineering, 219, 621-631. Turns, S. R., 1996. An introduction to combustion, McGraw-hill New York.. 252.
(9)
Figure


Documento similar
The draft amendments do not operate any more a distinction between different states of emergency; they repeal articles 120, 121and 122 and make it possible for the President to
H I is the incident wave height, T z is the mean wave period, Ir is the Iribarren number or surf similarity parameter, h is the water depth at the toe of the structure, Ru is the
ABSTRACT: The behavior of the Avrami plot during TAG crys- tallization was studied by DSC and rheological measurements in oil blends of palm stearin (26 and 80%) in sesame oil,
Since such powers frequently exist outside the institutional framework, and/or exercise their influence through channels exempt (or simply out of reach) from any political
In this work, a systematic experimental and theoretical analysis of the vapor-liquid equilibrium of {aromatic hydrocarbon (toluene) + ionic liquid} binary mixtures
In the previous sections we have shown how astronomical alignments and solar hierophanies – with a common interest in the solstices − were substantiated in the
This study aims to estimate the impact of the land cover change from shrubs to oil palm plantation on mammal species richness, evenness, and composition and estimate the amount
At the same time, however, it would also be misleading and simplistic to assume that such Aikido habituses were attained merely through abstracted thought
