Electrochemical techniques to detect and quantify Enrofloxacin in presence of highly potential interferences: Assays in Chilean aqueous soil matrices
7
0
0
Texto completo
(2) Journal of Electroanalytical Chemistry 832 (2019) 329–335. C. Canales et al.. a). b). Fig. 1. Chemical structures of a) Enrofloxacin and b) Ciprofloxacin.. economic activities in our country and represents the 2.6% of the GDP (Gross Domestic Product) of the total income. Moreover, the 70% of the agricultural activities are developed in volcanic soils, which are located on the central-south zone of Chile [7]. In this sense, fluoroquinolones, such as Enrofloxacin and Ciprofloxacin (Fig. 1), are highly used in Chile according to the reports given by the Servicio Agrícola y Ganadero (SAG). Then, as long as the use of these VPs increases, the impact of pharmaceuticals on the environment keeps growing as well and the soils are the most affected environmental matrices. This latter idea becomes a concern from the point of view that VPs, especially antibiotics, can be hardly adsorbed on the natural organic matter (NOM) or not-being adsorbed, which can provoke the contamination of water sources due to the high mobility [8]. Even by aeration of manure and increasing temperatures these substances are not transformed and consecutively, distributed in the environment in an unaltered state [9]. For the determination of Enrofloxacin, some electrochemical methods have been proposed, where multi-walled carbon nanotubes decorated with Fe3O4 nanoparticles (Fe3O4NPs/MWCNTs) were prepared and used to fabricate an electrochemical sensor, with a detection limit of 0.09 μmol L−1 [10]; while a similar methodology based on anodically pretreated boron-diamond electrode has been described with a detection limit 1.58 × 10⁻⁸ mol L−1 [11]. Due to the above, the determination of Enrofloxacin in the presence of its potential degradation products, such as Ciprofloxacin, requires the development of fast and new analytical methodologies as alternative, considering that within the solution-soil system, Ciprofloxacin and dissolved organic matter arise as potential interferences; where one of the important issues is to maintain the detection limit for these analytes in presence of this kind of interferences. Considering the progress in electrochemical determination of this kind of analytes, in this work, Cyclic Voltammetry and Square Wave Voltammetry were studied as electrochemical techniques in order to detect and quantify Enrofloxacin through its electro-oxidation on a glassy carbon electrode and in presence of NOM and an Enrofloxacin derivative (Ciprofloxacin), as an alternative of the use of conventional techniques, like spectrophotometry, in which the possible interferences become a great issue at the moment of analyze these compounds.. Table 1 Collected soils, order and location.. Soil order Soil class Sampling location Latitude Longitude Altitude (m) Rainfall (m year−1) Mean annual temperature (°C) Electrical conductivity (dS m−1) Organic carbon (wt%) pH (H2O 1:2.5) Exchangeable cations (cmol(+) kg−1). FRU. RAL. Andisol Medial, isomesic, Typic Placandept. Andisol Medial, mesic, Acrudoxic Hapludands. 41°06′S 73°07′W 100–200 1.5–2.0 12.9. 41°32′S 73°05′W 600–1400 4.0–5.0 10.5. 0.93 ± 0.02. 1.81 ± 0.02. 11.0 ± 0.4 4.1 ± 0.0 5.2. 6.9 ± 0.2 4.5 ± 0.0 3.1. 2.1.2. Humic acids purification Briefly, the soil sample was equilibrated with 1 mol L−1 HCl, obtaining a suspension whose pH ranges between 1.0 and 2.0 at room temperature. The volume was then adjusted with 0.1 mol L−1 HCl to get a 10 mL liquid/1 g dry sample ratio. The suspension was centrifuged to separate the sediment (R1) from the supernatant. R1 was neutralized (pH = 7.0) with a 1 mol L−1 NaOH solution, and then a volume of 0.1 mol L−1 NaOH was added under N2 atmosphere to give a 10:1 final extractant to soil ratio. The extraction was carried out under N2 atmosphere with occasional stirring for a minimum of 4 h. The alkaline suspension was left overnight and then the supernatant was separated by centrifugation. Subsequently, the supernatant was acidified with 6 mol L−1 HCl under constant stirring to get pH 1.0 and then allowed to stand for 12–16 h. The precipitated HA fractions were separated by centrifugation. The precipitated HA was redissolved in a minimum volume of 0.1 mol L−1 KOH under N2; solid KCl was then added to attain a 0.3 mol L−1 K+ concentration and then centrifuged to remove the suspended solid. The HA was re-precipitated by adding 6 mol L−1 HCl under constant stirring until a pH = 1.0 was reached. The suspension was allowed to stand another 12 to 16 h, and then centrifuged, discarding the supernatant. The HA precipitate was suspended into a 0.1 mol L−1 HCl and 0.3 mol L−1 HF mixture and stirred overnight at room temperature (if necessary, repeating the acid treatment (HCl/HF) until the ash content be < 1%). After centrifugation, the precipitate was transferred to a dialysis tube (Visking, Co.) using distilled water until the dialysed water gave a negative test for chloride (AgNO3). After freeze-drying, the HA was kept refrigerated [12,13].. 2. Material and methods 2.1. Samples 2.1.1. Soils Soil samples were collected from 0 to 0.20 m depth of uncultivated pasture area of Frutillar (FRU) and Ralun (RLN) (Andisols) in southern Chile. These samples are obtained after removing the plant surface where a pit is made at a sampling depth of 0.0 to 0.2 m. The samples were air dried and sifted through a 2-mm mesh sieve and finally they are packed in closed polypropylene containers. Table 1 shows some characteristics and properties from these natural soils.. 2.2. Solutions 2.2.1. Phosphate buffer solution, pH 7.0 (PBS) 50.0 mL of 0.1 M KH2PO4 (Merck®) were mixed with 29.1 mL of 330.
(3) Journal of Electroanalytical Chemistry 832 (2019) 329–335. C. Canales et al.. 0.1 M NaOH, which was diluted with ultrapure water (Millipore quality, Milli Q®) until reaching a 100.0 mL solution.. the peak current and the concentration of Enrofloxacin in a given concentration range. From the voltammograms obtained, 6 calibration curves were made with the peak current values from each voltammogram. Then, the equation of the average curve, the linear correlation coefficient (R2) and the limits of detection (LD) and quantification (LQ) were obtained. In order to establish the accuracy of the electrochemical method developed, the concentration of Enrofloxacin (n = 5) of a standard sample of 30.0 μmol L−1, prepared from a solution of 0.01 mol L−1, was determined. Then, absolute and relative error was calculated. At this point, the precision of the linearity was evaluated by repeatability (n = 6) by modifying the day of measurement. Then, the standard deviation and the variance coefficient percentage of the data were calculated. In relation with of the analytical methods developed, the selectivity was verified by studying two possible interferers: 1) ciprofloxacin, byproduct of the electro-oxidation and 2) natural organic matter (HA) from the environmental matrix, and their potential impact on the analytical signal obtained (amperometric response). Ciprofloxacin was evaluated at two concentration levels: 300.0 and 30.0 μmol L−1. On the other hand, the possible presence of natural organic matter (HA) as interfere is evaluated at the same mass load, 30.0 mg L−1, varying the soil series of HA (FRU, RLN and CMR). The evaluation of both interferences was developed, using both electrochemical techniques. Then, the current intensity readings were compared at an overpotential range of approximately 0.9 to 1.0 V, considering the samples in the absence and presence of the interferer.. 2.2.2. 0.01 M Enrofloxacin stock solution (ENR) 36.70 mg of Enrofloxacin (Sigma-Aldrich®) was dissolved in a 10.0 mL volumetric flask of 0.01 M HCl solution. From this stock solution, diluted Enrofloxacin solutions are prepared daily, using PBS pH 7.0. In this sense, ionic strength and pH were kept constant in all experiments. 2.2.3. 0.01 M Ciprofloxacin stock solution (CIP) 16.50 mg of Ciprofloxacin (Sigma-Aldrich®) was dissolved in a 5.0 mL volumetric flask containing 0.01 M HCl solution. From this stock solution, diluted Enrofloxacin solutions are prepared daily, using PBS pH 7.0. In this sense, ionic strength and pH were kept constant in all experiments. 2.2.4. Humic acid solution - natural organic matter 100 mg L−1 stock solution was prepared by dissolving the natural humic acid extracted from soils derived from volcanic materials (HAFRU and HA-RLN) in 0.100 mol L−1 sodium hydroxide solution. The humic acid solution (30 mg L−1) was prepared from the NOM stock solution by dilution with a previously prepared 0.01 mol L−1 phosphate buffer solution pH = 7.0 (BPS). Additionally, a commercial HA (CMR) was used in this study (Sigma-Aldrich). 2.3. Chemical characterization. 2.5. Spectrophotometric studies. 2.3.1. Dynamic light scattering (DLS) The particle size distribution of humic acid solution-Natural Organic Matter, was made by dynamic light scattering (DLS). The data were collected in a zetasizer model s-90 (Malvern) and by using a dispersion angle of 108° and a wavelength of 690 nm.. All the spectrophotometry experiments were carried out in a Jenway UV-VIS Spectrophotometer model 6705, in a system composed of a 1 mL quartz cell. The working analytical wavelength was 337 nm, which was established by performing a spectral sweep of the molecule (Enrofloxacin) in a range of 200 nm to 900 nm. It was worked at a concentration range of 3.0 to 60.0 μmol L−1. For each measurement an analytical blank was used, which is composed of 10 mL of PBS and 300 μL of 0.01 M HCl.. 2.3.2. Electrochemical assays All electrochemical experiments were conducted by using a CH Instrument 720D potentiostat/galvanostat system in a three-compartment/three-electrode glass cell, under a high purity N2 atmosphere. A glassy carbon (GC) electrode was prepared and used as the working electrode. The exposed GC surface of the electrode was mechanically regenerated with alumina suspension (0.3 μm) prior to each experiment and washed with double distilled water. A Pt wire was used as the counter electrode. All potentials quoted in this work are referenced to an Ag|AgCl reference electrode. The prepared solutions were subsequently deaerated with Ar for at least 20 min. For the determination of Enrofloxacin/Ciprofloxacin by using cyclic voltammetry (CV) technique, a potential window between 0.0 and 1.3 V was used at a scan rate of 0.1 V per s, in a cell containing 10 mL of PBS, pH = 7.0, used as support electrolyte. The concentration range of each antibiotic was between 30.0 and 300 μmol L−1. For the measurement, a blank solution was used, which was composed of 10.0 mL of PBS and 300 μL of 0.01 M HCl solution. Then, in order to analyze these antibiotics by using Square Wave Voltammetry (SWV) as technique, a potential window between 0.0 and 1.1 V was used, at a scan rate of 0.08 V per s and at a range of concentration between 1.0 and 30.0 μmol L−1. Same blank solution was used and the parameters of amplitude and frequency of 0.025 V and 20 Hz were set, respectively. Finally, analytical parameters such as linearity, sensitivity, precision, accuracy and selectivity were calculated from the experiments here described. In the electrochemical system described above, a study such as, sensitivity, precision, accuracy and selectivity were calculated from the experiments here described.. 3. Results and discussion 3.1. Chemical characterization Soils of volcanic origin in the southern area of the country (Andisol order), have particular characteristics such as their permeability, their yellowish brown to dark brown color, high specific area, moderately acid pH, high water and phosphate retention capacity and, above all, they present high NOM content, which is consistent with the results here obtained (close to 45%), while that in terms of HA content a percentage of HA of 6.4 ± 0.40% and 5.70 ± 0.10% from the Ralun and Frutillar samples were obtained, respectively. 3.2. Size particle determination In a multidisciplinary area such as nanotechnology, soils are considered as complex solid mixtures, with particle sizes ranging from millimeters to nanometers. At this point, the HAs, as part of the soil organic matter, have been positioned within the nanoscale, where humic acids with a molecular weight of 15,000 Da are associated with structures with particle size of approximately 250 nm with a linear structure, while particle sizes of a little > 60 nm are estimated for the same molecule, being in its globular form [14]. Even some studies generally consider humic acids (HA) soluble in neutral to alkaline conditions [15]. However, and according to the results obtained by DLS at pH = 7.0, in humic acid solution-Natural Organic Matter, there are particles in suspension that demonstrate the presence of particles at the nanometer level. Table 2 shows the results here obtained.. 2.4. Analytical parameters Linearity was conducted to establish the linear relationship between 331.
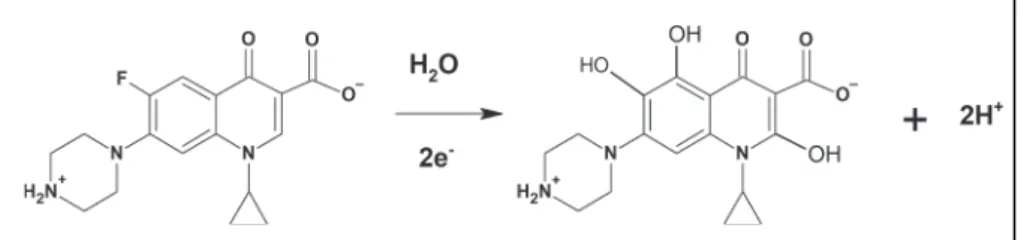
(4) Journal of Electroanalytical Chemistry 832 (2019) 329–335. C. Canales et al.. 3.3.2. Analytical parameters Fig. 4 shows the obtained voltammograms by using the corresponding techniques. When Cyclic Voltammetry was used, the concentration range was between 30.0 and 300.0 μmol L−1, while Square Wave Voltammetry, the concentration range varied to 1.0 to 30.0 μmol L−1. Table 3 shows the average curve and their corresponding linear correlation coefficient. LDs and LQs are shown as well. In order to compare both electrochemical techniques, when the CV technique is used, and a concentration range of 30.0 to 300.0 μmol L−1 is analyzed, a directly proportional response is obtained between both variables. However, when replicating this range using the SWV technique, the system does not present a linear response above 30.0 μmol L−1 and the signal does not register an increase in intensity as the concentration increases. This behavior is due to the occurrence of a saturation phenomenon of the working electrode (GC), which registers a decrease in the availability of active sites on the surface of the electrode, considering the sensitivity conditions imposed by the technique (SWV). The latter implies that the diffusional processes are not enough, to help the oxidized analyte to return to the solution, so, when increasing the concentration of it, the amperometric signal does not grow, so at 100.0 μmol L−1 a limit current is observed. Both detection and quantification limits obtained have coefficient of variance (14.80% and 17.97%) values of < 20%. Then, the precision of these parameters is considered acceptable. In parallel, in a lower range of concentration it is found a single oxidation peak, which represents the oxidation of Enrofloxacin. From this information, it cannot be guaranteed that there is no oxidation of Enrofloxacin in its active metabolite Ciprofloxacin, since in the concentration range between 100.0 and 250.0 μmol L−1, it is possible to see the signals corresponding to both antibiotics, and, product of the sensitivity of the method, is that at lower concentrations the peak corresponding to the overpotential of oxidation of ciprofloxacin is not observed. This situation can occur as a result of two possibilities: 1) that the passage of ENR ↔ CIP occurs at a higher reaction speed, or 2) that the oxidation signal of CIP to the trihydroxy product is very small, and that this is not recognizable due to the system capacitance or solvent discharge (oxygen evolution reaction). In this sense, it is possible to assert that the cyclic voltammetry technique is independent of the concentration factor, and therefore, there are no saturation phenomena when increasing the amount of analyte. However, in the case of the square wave voltammetry technique, the concentration is a great determinant, since saturation of the electrode surface is possible once the diffusional processes become negligent, as described by the Butler-Volmer equation [17]. Finally, to establish the LD and LQ of the techniques, we worked with calibration curves at a concentration range of 3.0 to 10.0 μmol L−1, in order to approach samples with concentrations of environmental origin. In the case of the CV, an average curve of. Table 2 Particle size (nm) and abundancy (%). Sample. Diameter (nm). Abundancy (%). RAL. 0.97 88.87 69.74 157.4 29.6 203.0. 36.40 63.60 13.00 87.0 6.60 93.40. FRU CMR. 3.3. Electrochemical assays 3.3.1. Voltammetric responses of Enrofloxacin and Ciprofloxacin Fig. 2 shows the voltammetric response of the electro-oxidation of Enrofloxacin and Ciprofloxacin separately by using Cyclic Voltammetry and Square Wave Voltammetry as techniques in order to recognize their corresponding current signal. As it is possible to observe, all the electrochemical responses appear close to 0.9 V vs Ag/AgCl, suggesting that Ciprofloxacin may be a great interference during the determination of Enrofloxacin. As it is shown in Fig. 2, both obtained cyclic voltammograms give evidence that the electro-oxidation process is irreversible. However, in the particular case of Enrofloxacin, the anodic sweep shows two anodic peaks which are consistent with a previous work done by our group [16], which represents a diffusion-controlled oxidation mechanism involving a transfer of 4 electrons in the whole process. During this electro-oxidation, there is a first step where the Enrofloxacin oxidizes to Ciprofloxacin and, afterwards, to its trihydroxilated form (Fig. 3). Then, considering this background information, these two anodic peaks can be attributed to Enrofloxacin and Ciprofloxacin oxidation, respectively, since there is a competition between these two analytes to be oxidized. In this sense, Enrofloxacin is more susceptible to be oxidized than Ciprofloxacin and competes for the actives sites on the surface of the GC electrode. Then, when just Ciprofloxacin is on the solution, is capable to be oxidized at lower overpotentials since is not competing with Enrofloxacin. A different profile is seen when the electro-oxidation of Enrofloxacin is recorded by using Square Wave Voltammetry, since just one anodic peak is observed. This can be attributed to the diffusional phenomenon occurring between the bulk solution and the electrode surface, in which the Enrofloxacin electrooxidation can be either incomplete (ENR → CIP) or totally oxidized at the same overpotential (ENR → Final product). Parallel to this, it was not possible to record a higher current signal by increasing the concentration of each pharmaceutical by using the Square Wave Voltammetry. This phenomenon will be discussed later.. Fig. 2. Voltammetric profiles of Enrofloxacin and Ciprofloxacin by using a) Cyclic Voltammetry (300.0 μmol L−1) and b) Square Wave Voltammetry (30.0 μmol L−1). 332.
(5) Journal of Electroanalytical Chemistry 832 (2019) 329–335. C. Canales et al.. Fig. 3. Electro-oxidation of ciprofloxacin towards its trihydroxilated form.. Fig. 4. Obtained voltammograms for Enrofloxacin electro-oxidation by using a) Cyclic Voltammetry and b) Square Wave Voltammetry.. the methods are accurate. In parallel, low values of standard deviation and variance coefficient are observed (0.737 for CV and 0.059 for SWV), which allows us to qualify the methods as precise. The evaluation of ciprofloxacin as interferer, in the case of CV, when 30.0 μmol L−1 is added, the analytical signal in response to the concentration is practically identical to that shown by the Enrofloxacin analyte, varying by no > 3%, unlike what occurs when ciprofloxacin is added at 300.0 μmol L−1, where the diagram is distorted (Fig. 5), as the intensity response is amplified, increasing by approximately 35%. On the other hand, in the case of SWV, the same phenomenon is observed in a concentration range of 1.0 to 30.0 μmol L−1 of ciprofloxacin. In this case, when 1.0 μmol L−1 of ciprofloxacin is added to a solution of 30.0 μmol L−1 of Enrofloxacin, there is no interference in the measurement, since the intensity varies by < 5%. Different occurs when the concentration that is added is 30.0 μmol L−1 of ciprofloxacin, where there is a high interference in the measurement, due to the increment on the current by > 20%. According to the results obtained, the presence of ciprofloxacin as a potential interference is not observed at low concentrations. This phenomenon may be due to the fact that the concentration of ciprofloxacin as a by-product of oxidation of Enrofloxacin is much higher compared to the amount added. Therefore, the current intensity has differences < 5%. On the other hand, the increase in concentration of ciprofloxacin added to the Enrofloxacin solution showed changes in the intensity of current. This behavior could be explained due to the occurrence of a chemical synergy process [18], considering that the observed amperometric response is greater than the sum of the current intensities corresponding to both antibiotics separately, at a similar concentration. Considering that the oxidative process of Enrofloxacin has ciprofloxacin as a byproduct, the addition of a reagent (CIP) alters the existing balance in the ENR ↔ CIP system, generating an increase in the amperometric response of Enrofloxacin, given the displacement in the reverse direction of the aforementioned equilibrium. Given this phenomenon, it is possible to observe how both current peaks are considerably increased in voltammograms. In parallel, it is possible to observe an increase in the oxidation overpotential, which confirms the. Table 3 Average curves, linear correlation coefficients and limits of detection and quantification of Enrofloxacin (C = concentration in μmol L−1). Electrochemical technique. Equation curve R2 LD (μmol L−1) LQ (μmol L−1). CV. SWV. Ip = 0.052 × C + 3.836 0.997 31.0 ± 4.6 103.4 ± 15.3. Ip = 0.107 × C + 1.841 0.999 1.64 ± 0.30 5.48 ± 0.98. Ip = 0.120 × C + 1.736 (C in μmol L−1) was obtained with a R2 of 0.994. From this data, the detection and quantification limits calculated were 1.033 ± 0.014 and 3.444 ± 0.049 μmol L−1, respectively. For the case of SWV, an average curve of Ip = 0.100 × C + 1.923 (C in μmol L−1) was obtained (n = 6) with a R2 = 0.999. Then, the detection and quantification limits were 0.542 ± 0.097 and 1.777 ± 0.319 μmol L−1, respectively. These results are very close to works reported previously, where more complex electrochemical systems are generally used [10,11]. Finally, in terms of sensitivity, which is established from the calculation of the slope (S) of the linear regression adjustment model of the calibration curves (n = 6) described above, both methods can be considered due to there is no significant difference in terms of this parameter. However, when comparing the LDs and LQs of both electrochemical techniques obtained from calibration curves, it is observed how the square wave voltammetry has better results than those obtained in cyclic voltammetry, which means that the Square Wave Voltammetry possesses better sensitivity analytical property than Cyclic Voltammetry. The results of the accuracy and precision study for Enrofloxacin, using both electrochemical techniques, shown a value of 29.70 ± 0.219 μmol L−1, which presents a relative error of 0.987% for the CV technique, while in the case of SWV it is obtained 29.90 ± 0.017 μmol L−1 of Enrofloxacin for a standard sample, which presents a relative error of 0.340%. These values allow us to affirm that 333.
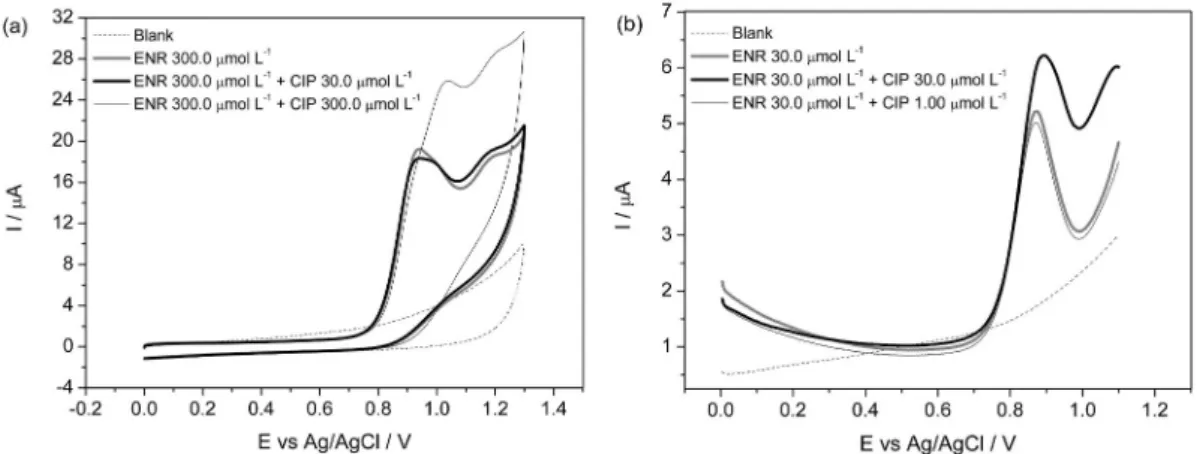
(6) Journal of Electroanalytical Chemistry 832 (2019) 329–335. C. Canales et al.. Fig. 5. Electrochemical evaluation of ciprofloxacin as interference on the Enrofloxacin determination by using a) cyclic voltammetry and b) square wave voltammetry.. competition between the electrooxidation of Enrofloxacin to ciprofloxacin and the displacement of the balance of the system towards the formation of Enrofloxacin. This increase in overpotential is produced by a greater energy requirement of the system to generate the oxidation process, product of the competitiveness that could exist with the balance between Enrofloxacin and ciprofloxacin. By the other side, Fig. 6a shows the cyclic voltammograms obtained on the glassy carbon electrode for the Enrofloxacin solution at 300.0 μmol L−1 in presence and absence of three different humic acids: commercial (CMR), Frutillar (FRU) and Ralún (RLN). As it is observed in the voltammograms, there is a presence of two oxidation peaks in the anodic sweep. In all cases, the difference of the analytical signal in response to the concentration is practically negligible, between the current intensity of ENR + HA and ENR itself, varying by no > 5%, which fluctuates between a 3.1 and a 3.6%. On the other hand, Fig. 6b shows square wave voltammograms obtained at same above conditions. Again, it is possible to observe the presence of a peak that represents the electrooxidation of Enrofloxacin. In all cases, the difference of the analytical signal in response to the concentration between the current intensity of ENR + HAs and ENR itself, is practically negligible, varying by no > 2%. In this sense, HA do not interfere with the electrochemical measurements. In terms of linearity, when ciprofloxacin is added to Enrofloxacin solutions, as well as HA, the linear correlation coefficient does not present a great difference, even in presence of high ciprofloxacin concentration. However, the sensitivity, evaluated through of slope values, presented a decrease, from 1.9% to 37%, when these interferences are present on the solution to both electrochemical techniques used. Additionally, calibration curves were performed by using UV-VIS spectrophotometry as technique for Enrofloxacin solutions, in absence. Fig. 7. Calibration curves obtained from UV–Visible analysis of ENR and ENR + 30 mg L−1 of HAs (CMR, RLN and FRU).. and presence of natural and commercial humic acids (Fig. 7). It is interesting to compare this technique with the electrochemical ones, since it has great applicability, high sensitivity, besides being one of the most simple, useful and accessible methods of quantitative analysis. However, in this case, it is possible to observe that when 30.0 mg L−1 of humic acid are added to the Enrofloxacin solution, the linearity is drastically lost. This is because the organic matter colors the solution,. Fig. 6. Electrochemical evaluation of HAs as interferences on the Enrofloxacin determination by using a) cyclic voltammetry and b) square wave voltammetry. 334.
(7) Journal of Electroanalytical Chemistry 832 (2019) 329–335. C. Canales et al.. and the adsorption region changes to a visible region of the electromagnetic spectrum. At this point, the linear correlation coefficient (R2) changes from 0.998 (ENR) to 0.841, 0.984 and 0.982 for CMR, RLN and FRU, respectively. Thus, this conventional technique becomes ineffective when quantifying Enrofloxacin in the presence of humic acids. Nevertheless, even though the electrochemical here presented are effective for the samples here studied, further studies and complementary analysis, such as the use of LC-MS analysis, to recognize these analytes must be accomplished in order to improve the selectivity and to apply these methods to real samples of unknown nature.. results are highly incongruent, with a very low analytical quality, since the HAs are considered as an interference. This result is related to the theoretical fundamentals and intrinsic characteristics of the technique. Acknowledgements Support from Basal Funding for Scientific and Technological Centers of Excellence FB0807 CEDENNA and DIPOG 3913-529-81, is kindly acknowledged. References. 4. Conclusions. [1] A. Aris, From Sources to Solution Proceedings of the International Conference on Environmental Forensics 2013, Springer EBooks, 2014. [2] V.L. Cunningham, Special Characteristics of Pharmaceuticals Related to Environmental Fate, Pharm. Environ. Springer Berlin Heidelberg, Berlin, Heidelberg, 2008, pp. 23–34, https://doi.org/10.1007/978-3-540-74664-5_2. [3] C. Bouki, D. Venieri, E. Diamadopoulos, Detection and fate of antibiotic resistant bacteria in wastewater treatment plants: a review, Ecotoxicol. Environ. Saf. 91 (2013) 1–9, https://doi.org/10.1016/j.ecoenv.2013.01.016. [4] D.S. Aga, S. O'Connor, S. Ensley, J.Ä.O. Payero, D. Snow, D. Tarkalson, Determination of the persistence of tetracycline antibiotics and their degradates in manure-amended soil using enzyme-linked immunosorbent assay and liquid chromatography–mass spectrometry, J. Agric. Food Chem. 53 (2005) 7165–7171, https://doi.org/10.1021/jf050415+. [5] D.D. Snow, S.L. Bartelt-Hunt, S.E. Saunders, S.L. Devivo, D.A. Cassada, Detection, occurrence and fate of emerging contaminants in agricultural environments, Water Environ. Res. 80 (2008) 868–2092, https://doi.org/10.2175/106143008X328518. [6] W. Song, Y. Ding, C.T. Chiou, H. Li, Selected veterinary pharmaceuticals in agricultural water and soil from land application of animal manure, J. Environ. Qual. 39 (2010) 1211, https://doi.org/10.2134/jeq2009.0090. [7] Odepa, Agricultura Chilena 2014: Una perspectiva de mediano plazo, https://www. odepa.gob.cl/odepaweb/servicios-informacion/publica/Agricultura2014.pdf , Accessed date: 12 July 2018. [8] J.R. Marengo, R.A. Kok, K. O'Brien, R.R. Velagaleti, J.M. Stamm, Aerobic biodegradation of (14C)-sarafloxacin hydrochloride in soil, Environ. Toxicol. Chem. 16 (1997) 462, https://doi.org/10.1897/1551-5028(1997)016<0462:ABOCSH>2.3. CO;2. [9] C. Winckler, A. Grafe, Use of veterinary drugs in intensive animal production, J. Soils Sediments 1 (2001) 66–70, https://doi.org/10.1007/BF02987711. [10] S. Mozaffari, F. Karimi, S. Sadat Khaloo, A. Barekat, Fabrication of a modified electrode based on multi-walled carbon nanotubes decorated with iron oxide nanoparticles for the determination of enrofloxacin, Micro Nano Lett. 10 (2015) 561–566, https://doi.org/10.1049/mnl.2015.0123. [11] F. Dönmez, Y. Yardım, Z. Şentürk, Electroanalytical determination of enrofloxacin based on the enhancement effect of the anionic surfactant at anodically pretreated boron-doped diamond electrode, Diam. Relat. Mater. 84 (2018) 95–102, https:// doi.org/10.1016/J.DIAMOND.2018.03.013. [12] A. Watanabe, S. Kuwatsuka, Fractionation of soil fulvic acids using polyvinyl-pyrrolidone and their lonization difference spectra, Soil Sci. Plant Nutr. 37 (1991) 611–617, https://doi.org/10.1080/00380768.1991.10416929. [13] Maria de Nobili, G. Bragato, J.M. Alcaniz, A. Puigbo, L. Comellas, Chacracterization of electrophoretic fractiones of humic substances with different electrofocusing behavior, Soil Sci. 150 (1990) 763–770 https://insights.ovid.com/crossref?an= 00010694-199011000-00002. [14] M.A. Wilson, N.H. Tran, A.S. Milev, G.S. Kamali Kannangara, H. Volk, G.Q.M. Lu, Nanomaterials in Soils, (2008), https://doi.org/10.1016/j.geoderma.2008.06.004. [15] F.J. Stevenson, Humus Chemistry: Genesis, Composition, Reactions, Wiley, 1994, https://www.wiley.com/enus/Humus+Chemistry%3A+Genesis %2C+Composition%2C+Reactions%2C+2nd+Edition-p-9780471594741 , Accessed date: 15 June 2018. [16] M. Antilén, C. Valencia, E. Peralta, C. Canales, C. Espinosa-Bustos, M. Escudey, Enrofloxacin behavior in presence of soil extracted organic matter: an electrochemical approach, Electrochim. Acta 244 (2017) 104–111, https://doi.org/10. 1016/j.electacta.2017.05.104. [17] A.J. Bard, L.R. Faulkner, Electrochemical Methods: Fundamentals and Applications, Wiley, 2001. [18] S.T.-C. Chou, Theoretical basis, experimental design, and computerized simulation of synergism and antagonism in drug combination studies, Pharmacol. Rev. 58 (2006) 621–681, https://doi.org/10.1124/pr.58.3.10.. Through the obtained results in this work, it can be concluded that, at neutral pH, when the particle size distribution is done, the solubilization of humic acids (HA) is partial, with particles in suspension and a distribution of 29.60 nm (6.6%), 203 nm (93.4%) for the commercial HA, 0.97 nm (36.4%), 88.87 nm (63.6%) for Ralún HA and 69.74 nm (13.0%), 157.40 nm (87.0%) for Frutillar HA, which demonstrates the presence of nano metric level particles. Then, the developed electrochemical method for the quantitative determination of ENR, via cyclic voltammetry, can be considered as accurate, since their relative standard deviation and variance coefficient values are acceptable. Moreover, this technique can be considered precise, since it presents a relative error of 3.17 ± 0.014 μmol L−1, for a standard sample of 30.0 μmol L−1. Regarding to the limits of detection (LD) and quantification (LQ), values of 1.033 ± 0.014 μmol L−1 and 3.444 ± 0.049 μmol L−1 were obtained, respectively. At the same way, via square wave voltammetry, the technique can be considered accurate due to the obtained results of relative standard deviation and variance coefficient values. Additionally, the electrochemical method can be considered precise, since its relative error is 0.32 ± 0.05%, for a standard sample of 30.0 μmol L−1. The LD and LQ were 0.542 ± 0.251 and 1.747 ± 0.836 μmol L−1, respectively. In terms of sensitivity, cyclic voltammetry presented a higher sensitivity in comparison to the square wave voltammetry (Ip = 0.120 × C (μmol L−1) + 1.736 versus Ip = 0.100 × C −1 (μmol L ) + 1.923). However, SWV presents better analytical parameters in comparison to the CV, which results in a preferable method when determining and quantifying these analytes, under the experimental conditions here exposed. Concerning to the selectivity, both techniques present similar results, where Ciprofloxacin is considered as interference when Enrofloxacin needs to be quantified, when its concentration is found in a 1:1 proportion. This latter effect is due to a chemical synergism, which originates that the current intensities increase in a considerable way, as well as the discrepancy percentage in more than a 5%. However, when the concentration is diluted in > 10 times, the discrepancy percentage is lower than 5%. Thus, it is established that the concentration of ciprofloxacin is an important factor to consider in this kind of electrochemical analysis, since this analyte behaves as interference. In terms of HAs, the calculated discrepancy percentages for all type of studied natural organic matter, were lower or equal to 5%. Then, it is considered that through the developed method, the natural organic matter is not interference. Finally, as a comparative study, the quantitative determination of Enrofloxacin via UV–Visible Spectrophotometry in presence of HA, the. 335.
(8)
Figure


Documento similar