The NuSTAR Serendipitous Survey: Hunting for the Most Extreme Obscured AGN at >10 keV
19
0
0
Texto completo
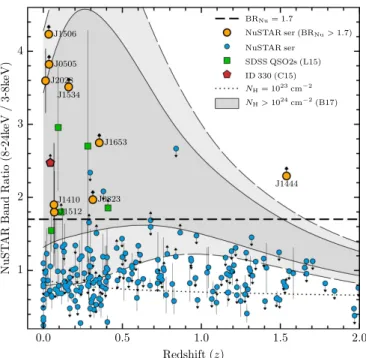
(2) The Astrophysical Journal, 846:20 (19pp), 2017 September 1. Lansbury et al.. substantial fraction of the growth appears to occur during the most obscured “Compton-thick” (CT) phases, where the absorbing column density exceeds the inverse of the Thomson scattering cross section (NH 1.5 ´ 10 24 cm−2). However, the intrinsic absorption distribution of AGNs has proven difficult to constrain, especially at the highly obscured to CT end, where AGNs are particularly challenging to identify. Besides completing a census, identifying the most highly obscured AGNs is crucial to our understanding of the environment of supermassive black hole growth. The unified model of AGNs (e.g., Antonucci 1993; Urry & Padovani 1995; Netzer 2015), which largely succeeds at describing AGNs in the local universe, posits that unobscured, obscured, and CT systems have intrinsically similar nuclear structures but are simply viewed from different inclination angles. In tension with this model (at least in its simplest form) are observational results that find possible evidence for high merger fractions in highly obscured AGN samples (e.g., Kocevski et al. 2015; Del Moro et al. 2016; Koss et al. 2016a; Ricci et al. 2017). Furthermore, observations of the clustering of AGNs find that obscured and unobscured AGNs may inhabit different large-scale environments (e.g., Allevato et al. 2011, 2014; DiPompeo et al. 2014, 2016; Donoso et al. 2014; but see also Mendez et al. 2016; Ballantyne 2017). These results may suggest that high AGN obscuration can be linked to specific phases in the galaxy–AGN coevolutionary sequence (e.g., Sanders et al. 1988; Hopkins et al. 2008; Alexander & Hickox 2012), potentially associated with periods of rapid black hole growth (e.g., Draper & Ballantyne 2010; Treister et al. 2010). A challenge in answering these questions is that most wavelength regimes are subject to strong biases against detecting highly obscured AGNs, due to a combination of (i) line-of-sight extinction and (ii) dilution by light from other (e.g., stellar) processes. Selection methods exist that are relatively unhindered by (i), such as mid-infrared (MIR) color selection (e.g., Lacy et al. 2004; Stern et al. 2005; Daddi et al. 2007; Fiore et al. 2008; Mateos et al. 2012; Stern et al. 2012) and optical spectroscopic selection based on high-ionization emission lines (e.g., Zakamska et al. 2003; Reyes et al. 2008). However, these techniques both suffer from (ii), especially at sub-quasar luminosities, and both still require X-ray follow-up of the AGNs to provide accurate measurements of the line-ofsight gas column densities (e.g., Vignali et al. 2006; Civano et al. 2007; Alexander et al. 2008; Vignali et al. 2010; Jia et al. 2013; LaMassa et al. 2014; Del Moro et al. 2016). Hard (>10 keV) X-ray observations, on the other hand, have the advantage of very little dilution from other processes and are relatively unaffected by line-of-sight obscuring material up to CT levels of absorption. For high redshift AGNs (z 2) soft X-ray telescopes (e.g., Chandra and XMM-Newton) sample the rest-frame hard X-ray band and are therefore effective in identifying the features of CT absorption (e.g., Comastri et al. 2011; Brightman et al. 2014). In the lower-redshift universe, however, hard X-ray telescopes become essential. Large (e.g., all-sky) surveys with nonfocusing hard X-ray missions (e.g., SwiftBAT and INTEGRAL) have been important for the identification of highly obscured AGNs in the very local universe (z < 0.05; e.g., Burlon et al. 2011; Vasudevan et al. 2013; Ricci et al. 2015; Akylas et al. 2016; Koss et al. 2016a). Now, with the first focusing hard X-ray mission (NuSTAR; Harrison et al. 2013) it. is possible to study source populations that are approximately two orders of magnitude fainter, thus extending to lower luminosities and higher redshifts. The largest extragalactic survey being undertaken with NuSTAR is the serendipitous survey (Alexander et al. 2013; Lansbury et al. 2017), which has covered ≈13 deg2 and detected 497 sources, 276 of which have spectroscopic redshifts. The areal coverage and sample size are large compared to the dedicated NuSTAR extragalactic blankfield surveys (e.g., in the ECDFS and COSMOS fields; Civano et al. 2015; Mullaney et al. 2015), making the serendipitous survey well suited to the discovery of rare populations such as CT AGNs. The latter have proven elusive in the NuSTAR surveys thus far, with only one to two high-confidence CT AGNs being identified overall (e.g., Civano et al. 2015; Del Moro et al. 2017; Zappacosta et al. 2017). In this paper, we search for the most extreme hard X-ray sources in the 40-month NuSTAR serendipitous survey sample, and as a result we reveal new robust CT AGNs. First, we select the objects with the highest NuSTAR band ratios, implying very hard spectral shapes and hence the likely presence of heavy absorption. Although band ratios only give a crude estimate of absorption, they are nevertheless an effective way to isolate the most extreme outliers (e.g., Koss et al. 2016a). Second, we perform a detailed analysis of the X-ray and multiwavelength properties of these extreme objects and discuss how their properties compare to those of the general AGN population. The paper is structured as follows. Section 2 describes the selection of the eight extreme objects from the NuSTAR serendipitous survey sample. Section 3 details the data used and the soft X-ray counterparts. In Section 4 we characterize the X-ray spectra of the sources (Section 4.1) and present the results for the X-ray spectral properties (Section 4.2). In Section 5 we investigate potential independent estimates of the source obscuration properties through indirect techniques. Section 6 presents the optical properties of the sample, including a summary of the optical spectral properties (Section 6.1) and host galaxy imaging, with a focus on the frequency of galaxy mergers (Section 6.2). In Section 7 we discuss the CT AGNs and their implications for the prevalence of CT absorption within the broader hard-X-ray-selected AGN population. Finally, our main results are summarized in Section 8. The cosmology adopted is (WM , WL , h) = (0.27, 0.73, 0.70). All uncertainties and limits are quoted at the 90% confidence level (CL), unless otherwise stated.. 2. The Sample of Extreme, Candidate Highly Obscured AGNs from the NuSTAR Serendipitous Survey We start with the total 40-month NuSTAR serendipitous survey sample (497 sources; Lansbury et al. 2017). To select sources with extremely hard X-ray spectra compared to the rest of the NuSTAR serendipitous survey sample, we identify sources with high hard-to-soft band ratios (BRNu ), calculated as the ratio of the 8–24keV to 3–8keV count rates. We apply a cut at BRNu > 1.7 (see Figure 1), which corresponds to an effective (i.e., observed) photon index of Geff 0.6.28 This cut is motivated by the BRNu values observed for CT AGNs in other NuSTAR programs (e.g., Baloković et al. 2014; The power-law photon index (Γ) is defined as follows: FE µ E -G , where FE is the photon flux and E is the photon energy. 28. 2.
(3) The Astrophysical Journal, 846:20 (19pp), 2017 September 1. Lansbury et al.. Here we comment on the maximum energies at which the sources are detected with NuSTAR. Table 1 lists the standard NuSTAR energy bands (i.e., the full, soft, and hard bands) for which sources are detected. By selection, all eight sources are detected in the 8–24keV band. Splitting this hard band into sub-bands of 8–16keV and 16–24keV, all eight sources are detected in the former band, and all except J1444 and J1653 are detected in the latter band. For the six sources detected at 16–24keV, the highest and lowest Poisson false probabilities are PFalse = 2 ´ 10-3 and 10−8, respectively (i.e., the detections range from ≈3σ to highly significant). Only one source shows evidence for emission at >24 keV: J1506, which is detected in the 24–50keV band at the ≈3σ significance level. In summary, two sources are detected up to a maximum energy of ≈16 keV, five sources are detected up to ≈24 keV, and a single source is weakly detected at even higher energies (up to ≈50 keV). 2.1. A Note on Associated Sources Six out of eight (75%) of the sources in this sample were serendipitously detected in NuSTAR observations of bright lowredshift SwiftBAT AGNs. The three serendipitous NuSTAR sources J0505, J1506, and J1512 are likely to be weakly associated with the brighter BAT AGNs: each source lies within ±500 km s−1 of the redshift of the BAT AGN and at a projected separation of ≈150–550kpc. The associations are “weak” in that the physical separations are large, and the sources are therefore unlikely to be interacting. The associated redshifts are unlikely to occur by chance given that hard X-ray sources at these flux levels ( f8 – 24 keV = 2–6 ´ 10-13 erg s−1 cm−2), and within ±500 km s−1 of the BAT redshifts, have very low sky densities of »0.01 deg-2 (e.g., Treister et al. 2009). The latter implies low chance coincidence rates of »10-3.5 for the three cases of associated redshifts above. The effect of these weak associations on number counts measurements for CT AGNs is accounted for in Section 7. In the overall 40-month NuSTAR serendipitous survey, redshift associations between serendipitous sources and science targets like the above are rare (Lansbury et al. 2017).29 The exception is at z < 0.07, where 10 out of 15 sources (including J0505, J1506, and J1512) show evidence for associations. We emphasize, however, that the majority of extragalactic sources in the NuSTAR serendipitous survey (247/262 of the spectroscopically identified sample) are at higher redshifts (z > 0.07),30 meaning that number counts measurements for the survey (e.g., Harrison et al. 2016) are not impacted.. Figure 1. NuSTAR band ratio (BRNu ) as a function of redshift (z) for the NuSTAR serendipitous survey sample. The extremely hard (BRNu > 1.7; dashed line) serendipitous survey AGNs are shown as orange circles and are individually labeled. “Normal” serendipitous survey sources at BRNu < 1.7 are shown as smaller blue circles. We compare to another extreme sample of optically (SDSS) selected highly obscured Type2 quasars observed with NuSTAR (green squares; Gandhi et al. 2014; Lansbury et al. 2014, 2015), and to ID330, the CT AGN identified in the NuSTAR-COSMOS survey (red pentagon; Civano et al. 2015; Zappacosta et al. 2017). Additionally, we compare to the expected band ratios for CT AGNs based on the high-quality Xray spectral modeling of very local CT AGNs in the NuSTAR snapshot survey (68th percentiles in darker gray with solid borders; 90th percentiles in lighter gray with long-dashed borders; Baloković et al. 2014; M. Baloković et al. 2017, in preparation). For comparison, the dotted black curve shows the band ratios expected for a moderate column density of NH = 10 23 cm−2.. Gandhi et al. 2014; Civano et al. 2015; Lansbury et al. 2015). We limit the sample to the sources with spectroscopic redshift measurements and exclude sources with upper limits in BRNu . The current spectroscopic completeness is ≈70% for the hard-band serendipitous survey sample at high galactic latitudes (∣b∣ > 10; Lansbury et al. 2017). Figure 1 shows BRNu versus redshift for the NuSTAR serendipitous survey sample, excluding two sources with erroneously high band ratios: NuSTAR J224225+2942.0, for which the photometry is affected by contamination from a nearby bright target, and NuSTAR J172805–1420.9, for which the photometry is unreliable owing to a high surface density of X-ray sources, with multiple Chandra sources likely contributing to a blended NuSTAR detection (as determined using Chandra data obtained through our follow-up program; PI J. A. Tomsick). Overall, nine sources have band ratios exceeding the selection threshold of BRNu > 1.7 (all individually labeled in Figure 1). We exclude NuSTARJ202828+2543.4 (hereafter J2028; z = 0.01447) from this work, as the source is closely associated with the science target of the NuSTAR field (IGR J20286+2544; projected separation of 26 kpc), and the extreme obscuration and merger properties of this system are the focus of a detailed study in Koss et al. (2016b). The main sample of eight extreme NuSTAR sources is listed in Table 1. X-ray images of the sources are shown in Figure 2.. 3. Data Table 2 provides details of the NuSTAR and soft (<10 keV) X-ray (i.e., Chandra, SwiftXRT, and XMM-Newton) data sets used in this work. For each source we adopt the soft X-ray observatory data that provide the most sensitive coverage at <10 keV. For four sources this coverage is from SwiftXRT, for three sources it is from XMM-Newton, and for one source it is from Chandra. For five sources we use the combined soft X-ray data set from multiple individual observations (as 29. Sources are classed as associated if their velocity offset from the science target [D (cz )] is smaller than 5% of the total science target velocity (see Lansbury et al. 2017). 30 At z > 0.07 only two sources are flagged as associated.. 3.
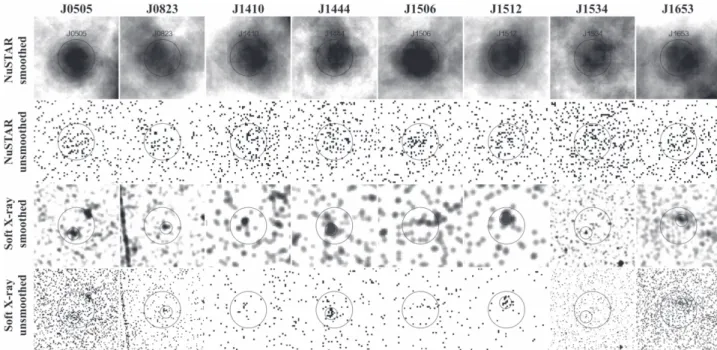
(4) The Astrophysical Journal, 846:20 (19pp), 2017 September 1. Lansbury et al.. Figure 2. NuSTAR and soft X-ray (Chandra, SwiftXRT, and XMM-Newton) images for the eight extreme NuSTAR serendipitous survey sources. Each column corresponds to an individual NuSTAR source (the abbreviated source names are shown). 30 -radius circular apertures are shown for each source, centered on the NuSTAR position. Upper two rows: NuSTAR hard-band (8–24 keV) images, both smoothed (with a top hat function of radius 14 pixels; first row) and unsmoothed (second row). Lower two rows: soft X-ray images from Chandra (the 0.5–2 keV band is shown for J1534), XMM-Newton (the full energy band is shown for J0505, J0823, and J1653), and SwiftXRT (the full energy band is shown for J1410, J1444, J1506, and J1512). The data are shown both smoothed (with a Gaussian function of radius 3 pixels; third row) and unsmoothed (fourth row). The soft X-ray counterpart positions are marked by smaller (10 radius) circular apertures, for all of the sources except J1410 and J1506 (which are undetected in the available SwiftXRT coverage; see Section 4).. XMM2. The 0.5–10keV spectrum for XMM1 is extremely flat +0.8 (with an effective photon index of Geff = -0.91.4 ), and there is a line detection consistent with FeKα (rest-frame E = 6.3 0.1 keV). The FeKα line has a high equivalent +1.4 width of EWFeKa = 1.40.9 keV, suggesting a highly absorbed AGN. For XMM2, the 0.5–10keV spectrum is steeper (Geff = 1.4 0.2). Although XMM2 is brighter than XMM1 over the full energy band, XMM1 is significantly brighter for the energies at which NuSTAR is sensitive: for the 3–10keV energy band, XMM1 and XMM2 have fluxes of 8.9 ´ 10-14 erg s−1 cm−2 and 1.8 ´ 10-14 erg s−1 cm−2, respectively. Given these fluxes and the relative spectral slopes of XMM1 and XMM2 (with the former sharply increasing, and the latter decreasing, toward higher X-ray energies), and the fact that the majority of NuSTAR source counts (79%) lie at high energies (>8 keV), we expect XMM1 to dominate the NuSTAR-detected emission. We therefore adopt XMM1 as the counterpart to J0505. For J1534, the deepest soft X-ray coverage is from a 171.5ks Chandra observation (obsID 16092, which targeted Arp 220). Running wavdetect for the broad Chandra energy band of 0.5–7keV, no sources are blindly detected within the NuSTAR error circle with false probabilities (i.e., sigthresh values) of PFalse 10-4 . However, running the source detection for multiple energy bands, there is a significant detection at 0.5–2keV, with PFalse » 10-6 . Adding further confidence to the reliability of this source, Sloan Digital Sky Survey (SDSS) coverage reveals a prominent z = 0.160 galaxy within the NuSTAR error circle (SDSS J153445.80+233121.2), which agrees with the Chandra position within the positional uncertainties (0. 6 offset). For an independent assessment of the significance of the Chandra source, we perform aperture. detailed in Table 2) to obtain the most precise X-ray constraints possible. The soft X-ray observations are generally not contemporaneous with the NuSTAR observations. Section 4.1 discusses the possibility of variability for these sources. 3.1. Soft X-Ray Counterparts to the Extreme NuSTAR Sources The soft X-ray counterparts improve the X-ray positional accuracy and, when combined with the NuSTAR data, allow for accurate spectral constraints using the broadest energy band possible. Of the eight extreme NuSTAR sources studied here, two lack soft X-ray counterparts (J1410 and J1506). In these cases there is no Chandra or XMM-Newton coverage, and the sources are undetected in the combined archival SwiftXRT coverage (running wavdetect with a detection threshold of 10−4). The other six extreme NuSTAR sources have identified soft X-ray counterparts. For five of these (J0505, J0823, J1444, J1512, and J1653) the soft X-ray counterparts are identified in Lansbury et al. (2017). Since J0505 has two XMM-Newton sources nearby to the NuSTAR source, we provide evidence below to support our correct counterpart identification in this case. For the remaining source (J1534), the Chandra counterpart is faint and did not satisfy the detection criteria in Lansbury et al. (2017). Below we detail the identification of this specific counterpart. For J0505, there are two potential counterparts in the 3XMM catalog, one at 14 offset from the NuSTAR position (R. A. = 76°. 49983, decl. = −23°. 83536; hereafter “XMM1”) and one brighter source at 27″ offset (R.A.=76°. 49296 decl. = −23°. 82597; hereafter “XMM2”). To examine the X-ray spectra, we use the MOS data for XMM1 (the source lies on a chip gap for PN) and the PN plus MOS data for 4.
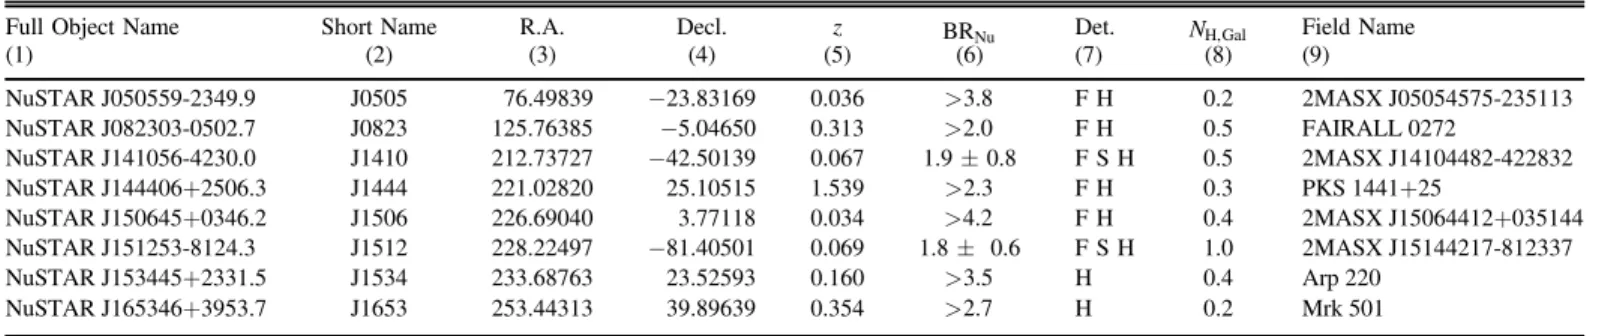
(5) The Astrophysical Journal, 846:20 (19pp), 2017 September 1. Lansbury et al.. Table 1 The Extremely Hard NuSTAR Serendipitous Survey Sources Full Object Name (1) NuSTAR J050559-2349.9 NuSTAR J082303-0502.7 NuSTAR J141056-4230.0 NuSTAR J144406+2506.3 NuSTAR J150645+0346.2 NuSTAR J151253-8124.3 NuSTAR J153445+2331.5 NuSTAR J165346+3953.7. Short Name (2). R.A. (3). Decl. (4). z (5). BRNu (6). J0505 J0823 J1410 J1444 J1506 J1512 J1534 J1653. 76.49839 125.76385 212.73727 221.02820 226.69040 228.22497 233.68763 253.44313. −23.83169 −5.04650 −42.50139 25.10515 3.77118 −81.40501 23.52593 39.89639. 0.036 0.313 0.067 1.539 0.034 0.069 0.160 0.354. >3.8 >2.0 1.9±0.8 >2.3 >4.2 1.8± 0.6 >3.5 >2.7. Det. (7) FH FH FSH FH FH FSH H H. NH,Gal (8) 0.2 0.5 0.5 0.3 0.4 1.0 0.4 0.2. Field Name (9) 2MASX J05054575-235113 FAIRALL 0272 2MASX J14104482-422832 PKS 1441+25 2MASX J15064412+035144 2MASX J15144217-812337 Arp 220 Mrk 501. Note. The sources are listed in order of increasing R.A. The entries in this table are drawn from the NuSTAR serendipitous survey source catalog (Lansbury et al. 2017). Column (1): NuSTAR serendipitous source name. Column (2): abbreviated NuSTAR source name adopted in this paper. Columns (3) and (4): R.A. and decl. J2000 coordinates in decimal degrees. Column (5): source spectroscopic redshift. All redshifts are robust, except for J1444, where fewer lines are identified (see Section 6). Column (6): NuSTAR photometric band ratio, as defined in Section 2. Column (7): the NuSTAR energy bands for which the source is independently detected. F, S, and H correspond to the full (3–24 keV), soft (3–8 keV), and hard (8–24 keV) bands, respectively. Column (8): line-of-sight Galactic column density (Kalberla et al. 2005). Units: 1021 cm−2. Column (9): name of the NuSTAR science target, in the field of which the serendipitous source is detected.. photometry (2 source radius; large background annulus) at the SDSS position. For the 0.5–2keV band, the source is indeed detected at the 4.0s level (according to the binomial false probability). The NuSTAR/Chandra flux ratio for J1534 is extremely high (e.g., f8 – 24 f0.5 – 2 = 141). For comparison, four sources in the NuSTAR-COSMOS survey have similarly high flux ratios (ranging from f8 – 24 f0.5 – 2 = 100 to 304), and all of these have been identified as highly obscured AGNs (e.g., Brightman et al. 2014; Lanzuisi et al. 2015; Zappacosta et al., 2017). The Chandra spectrum for J1534 is further discussed in Section 4.1.. 4. X-Ray Properties 4.1. X-Ray Spectral Modeling We perform X-ray spectral modeling using XSPEC (version 12.8.1j; Arnaud 1996) with the C-statistic (cstat) setting,35 which is more appropriate than c 2 in the low-counts regime (e.g., Nousek & Shue 1989). We group the data (source plus background) from NuSTAR and from other X-ray missions by a minimum of 3 counts and 1 count per bin, respectively, as recommended for use with cstat.36 In all cases, we fit a simple unabsorbed power-law model in order to constrain the effective photon index (Geff ) and thus obtain a basic measure of the overall X-ray spectral slope. Figure 3 shows the NuSTAR plus soft X-ray (Chandra, SwiftXRT, or XMM-Newton) spectra for the eight extreme NuSTAR serendipitous survey sources, with power-law model fits to each. Flat Geff values (e.g., 0.5) give empirical evidence for high or CT absorption. Further empirical evidence for CT absorption can be obtained from the detection of a strong fluorescent FeKα emission line at »6.4 keV (with an equivalent width of EWFe Ka > 1 keV, although lower values do not necessarily rule out CT absorption; e.g., Della Ceca et al. 2008; Gandhi et al. 2017). This reflection feature becomes more prominent with increasing levels of absorption (e.g., Risaliti 2002). To place constraints on EWFe Ka for our sources, we model the rest-frame ≈4–9keV spectrum as a power law (to fit the continuum) plus an unresolved Gaussian at rest-frame E = 6.4 keV. For two sources (J0505 and J1512) the emission line is well detected, and EWFe Ka is therefore constrained. For the remaining six sources the line is undetected, due to insufficient counts, and we report upper limits on EWFe Ka (assuming a line width of sline = 0.1 keV) where the data allow informative constraints. In Table 3 we provide the basic observed X-ray spectral properties for the sample: effective photon indices, FeKα line equivalent widths, and observed (i.e., uncorrected for absorption) X-ray luminosities.. 3.2. X-Ray Spectroscopic Products The NuSTARDAS task nuproducts is used to extract NuSTAR source spectra, background spectra, and response files.31 We adopt circular source extraction regions of 45 radius where possible, and of 30 radius for two cases where the source is either close to a bright science target or to the field-of-view (FOV) edge. We perform separate spectral extractions for the two individual NuSTAR telescopes (FPMA and FPMB). For J0823, we limit the modeling to FPMB, since the source is only fully within the NuSTAR FOV for FPMB. For the six sources with soft X-ray counterparts, we extract additional spectra from the archival soft X-ray data sets detailed in Table 2, using the relevant software packages (the Chandra Interactive Analysis Observations software,32 the SwiftXRT analysis software distributed with HEASoft,33 and the XMMNewton Science Analysis Software34). We adopt source extraction apertures of 5 , 10, and 12″–15″ radius for the Chandra, SwiftXRT, and XMM-Newton data, respectively. For J1444 we co-add the SwiftXRT spectra across all six observations, since the source is only significantly detected in the co-added data.. 31 32 33 34. http://heasarc.gsfc.nasa.gov/docs/nustar/analysis Fruscione et al. (2006); http://cxc.harvard.edu/ciao/index.htm http://www.swift.ac.uk/analysis/xrt/ http://xmm.esa.int/sas/. 35. The Wstatistic is actually used, since the background is unmodeled; see http://heasarc.gsfc.nasa.gov/docs/xanadu/xspec/wstat.ps.. https://asd.gsfc.nasa.gov/XSPECwiki/low_count_spectra. 36. 5.
(6) The Astrophysical Journal, 846:20 (19pp), 2017 September 1. Lansbury et al.. Table 2 Summary of the X-Ray Data Adopted for the Spectroscopic and Photometric X-Ray Analyses NuSTAR Observations. Soft X-ray Observations. Object (1). Observation ID (2). UT Date (3). t (4). Snet (5). B (6). Observatory (7). J0505 J0823 J1410. 60061056002 60061080002a 60160571002. 2013 Aug 21 2014 Jan 10 2015 May 14. 21.1 24.3 22:2. 66 41 153. 53 67 125. XMM-Newton XMM-Newton Swift XRT. J1444. 90101004002. 2015 Apr 25. 38.2. 62. 153. Swift XRT. J1506. 60061261002. 2014 Sep 08. 21.3. 81. 122. Swift XRT. J1512. 60061263002. 2013 Aug 06. 13.3. 153. 74. Swift XRT. J1534 J1653. 60002026002b 60002024002b. 2013 Aug 13 2013 Apr 13. 66.7 18.3. 42 14. 133 16. Chandra XMM-Newton. Observation ID (8). UT Date (9). t (10). Snet (11). B (12). 0605090101c 0501210501 00040973002 00040973003 00081157002 00081157003 L 00033768001 00033768002 00033768003 00033768004 00033768005 00033768006 00036622001 00036622002 00080144001 00036623001 00036623002 00080146001 16092 0652570101c 0652570201c. 2009 Aug 06 2007 Oct 14 2010 Sep 27 2011 Mar 10 2015 Apr 30 2015 May 14 L 2015 May 13 2015 May 18 2015 Jun 01 2015 Sep 04 2016 Apr 13 2016 Apr 17 2007 Dec 19 2007 Dec 21 2014 Sep 08 2007 Jun 07 2007 Jun 09 2013 Aug 06 2014 Apr 30 2010 Sep 08 2010 Sep 10. 29.4 8.4 5.0 5.0 5.8 5.6 19.6d 3.1 3.0 4.1 4.0 4.0 1.4 9.4 8.7 6.1 6.2 5.3 6.8 171.5 43.7 44.0. 70 12 L L L L 10 L L L L L L L L L 11 7 11 10 73 82. 46 9 L L L L L L L L L L L L L L L L L 10 47 42. Notes. Column (1): abbreviated NuSTAR source name. Columns (2) and (3): NuSTAR observation ID and start date (YYYY MM DD). Columns (4), (5), and (6): net exposure time (ks), net source counts, and scaled background counts, respectively, for the extracted 3–24keV (or 8–24 keV for J1534 and J1653) NuSTAR spectrum. Column (7): soft X-ray observatory with the best (or in some cases, the only) coverage, which we adopt for the analyses. Columns (8) and (9): adopted soft X-ray observation ID(s) and their corresponding start date(s) (YYYY MM DD), respectively. Columns (10), (11), and (12): exposure time (ks), net source counts, and scaled background counts, respectively. For J0505, J0823, J1444, J1512, J1534, and J1653, these columns correspond to the extracted X-ray spectra (at 0.5–10 keV, 0.6–10 keV, and 0.5–8 keV for XMM-Newton, SwiftXRT, and Chandra, respectively). For the remaining two sources that are undetected at soft X-ray energies (1410 and J1506), the SwiftXRT data tabulated here are used for photometric constraints. a Here we use the NuSTAR FPMB data only (i.e., excluding the FPMA data). b In these cases we limit the NuSTAR spectral analysis to the 8–24keV band, since the sources are undetected in the soft (3–8 keV) and full (3–24 keV) NuSTAR bands, indicating no significant source emission at <8 keV . c In these cases we use the combined MOS1+MOS2 data only. d Here we quote the total exposure time and counts (summing across all observations), since the source is undetected in individual SwiftXRT observations.. We use three more spectral models in order to constrain the source properties such as the intrinsic absorbing column density (NH ), the intrinsic photon index (Γ), and the X-ray luminosity. First, we fit a transmission-only model (hereafter the transmission model): a power law attenuated by redshifted photoelectric absorption and Compton scattering of photons out of the line of sight (CABS · ZWABS · POW, in XSPEC formalism). This model represents one extreme of obscured AGN spectra, where the X-ray spectrum is dominated by the primary AGN continuum transmitted directly along the line of sight. Second, we fit a reflection-only model (hereafter the reflection model), which represents a power-law spectrum reflected by circumnuclear material. For this we use the PEXRAV model (Magdziarz & Zdziarski 1995), with the reflection scaling factor set to −1 to yield a pure reflection spectrum, and with the other parameters set to default values. This model represents the other extreme of obscured AGN spectra, where the X-ray spectrum is dominated by the reflected AGN continuum, which (in combination with strong Fe line emission) implies very high column densities (NH 10 24 cm−2). At high column densities, X-ray spectra are typically more complex than the transmission and reflection. models above, and ideally any absorbed continuum, reflected continuum, and fluorescent line emission should be modeled in a self-consistent way and assuming a well-motivated geometry. We therefore perform an additional third test using the BNTORUS model (hereafter the torus model; Brightman & Nandra 2011), which was produced using simulations of X-ray radiative transfer through a toroidal distribution of gas. We set the model to an edge-on torus configuration (with qinclination and qtorus set to 87° and 60°, respectively). In this form, the torus model has the same number of free parameters as the transmission and reflection models and is therefore no less suited to the statistical quality of the data. For every model fit, we account for Galactic absorption with a PHABS multiplicative component, fixed to column density values from Kalberla et al. (2005). In cases where Γ and NH cannot be simultaneously constrained, we fix the intrinsic photon index at G = 1.9 (a typical value for AGNs detected at 3–24 keV; e.g., Alexander et al. 2013; Del Moro et al. 2017). In Table 4 we show the best-fit parameters obtained by applying the three models described above: intrinsic photon indices, column densities, fit statistics, and intrinsic (i.e., absorption-corrected) luminosities. 6.
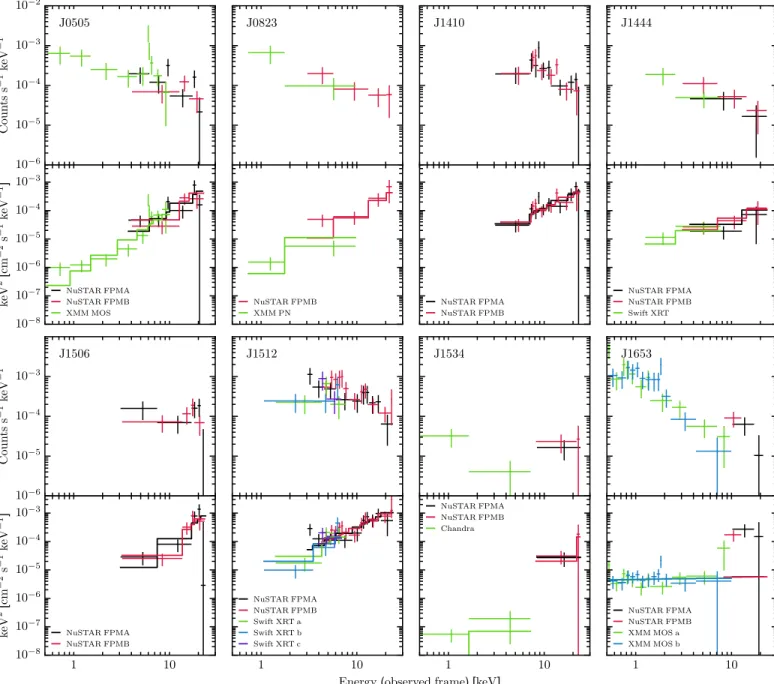
(7) The Astrophysical Journal, 846:20 (19pp), 2017 September 1. Lansbury et al.. Figure 3. X-ray spectra in observed count-rate units (top panel for a given source) and in EFE units (bottom panel for a given source) for the eight extreme NuSTAR sources (Section 4). Black and red correspond to NuSTAR FPMA and FPMB, respectively. The green, blue, and purple spectra represent the available soft X-ray data (as labeled). Letter suffixes (e.g., SwiftXRT b) indicate separate observations. See Table 2 for a full description of the adopted data sets. The data are binned to a minimum significance of 2s per bin for visual purposes. The EFE spectra are shown with best-fitting power-law models, binned to match the data (solid lines).. In one case (J1653) we find that an additional soft-X-raydominated model component is necessary to obtain an acceptable fit to the data. For J1653 all three models provide a poor fit to the XMM-Newton plus NuSTAR spectrum (for the transmission, reflection, and torus models, the ratio of the C statistic to the number of degrees of freedom is C n = 352 200 , 311/202, and 335/201, respectively) and leave strong positive residuals at high energies (8 keV). This is due to an apparently sudden change in the spectral shape, with the low energies (4 keV) dominated by a steep (G » 2) component and the higher energies (4 keV) dominated by a flatter component (G » -0.5). One way to interpret this is an electron-scattered or leaked (due to partial covering) AGN power law at lower energies and a primary AGN continuum. penetrating through at higher energies, as is commonly observed for well-studied AGNs in the local universe (e.g., Cappi et al. 2006). The relatively high luminosity (L 0.5 – 4 keV » 7 ´ 10 42 erg s−1) justifies the scattered AGN power-law interpretation rather than, e.g., thermal emission associated with star formation. For J1653 we therefore add an unobscured power-law component to the three spectral models, with the spectral slope tied to that of the intrinsic AGN powerlaw continuum. This results in statistically improved fits (see the C/n values in Table 4) and reasonable scattered power-law fraction constraints ( fscatt » 0.04%–5%). The source J1534 also shows evidence for a steep soft component in the Chandra spectrum (Geff » 3 at 0.5–8keV), which is dominated by photon counts at <2 keV (as described 7.
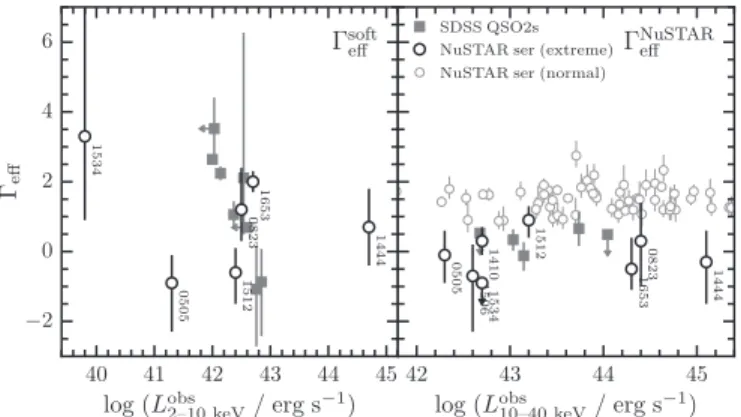
(8) The Astrophysical Journal, 846:20 (19pp), 2017 September 1. Lansbury et al.. et al. 2015). There is one exception, J0823, where the XMM-Newton:NuSTAR cross-normalization parameter must be left free to obtain statistically acceptable solutions. The transmission and torus models converge to extremely low cross-normalization constants (≈0.01), and we therefore limit the modeling to the NuSTAR data only. The best-fit reflection model, however, has a less extreme cross+0.19 normalization constant of 0.120.08 when fitting the XMMNewton plus NuSTAR data set. The low cross-normalization constants for J0823 may be due to X-ray variability between the 2007 XMM-Newton and the 2014 NuSTAR observations, although we do not draw strong conclusions given the uncertainties for this source.. Table 3 Basic X-Ray Spectral Parameters Object (1). NuSTAR Geff (2). Gsoft eff (3). EWFeKa (4). L 2obs – 10 (5). obs L10 – 40 (6). J0505 J0823 J1410 J1444 J1506 J1512 J1534 J1653. +0.7 -0.10.8 +1.1 0.3-1.3 0.3±0.4 +0.9 -0.31.2 +0.9 -0.71.6 +0.4 0.90.5 <-0.9a +0.9 a -0.50.6. +0.8 -0.91.4 +1.2 1.2-0.9 L 0.7±1.1 L +0.7 -0.60.9 +5.9 3.32.4 2.0±0.3. +1.4 1.40.9 L <1.7 <1.4 <3.2 +1.04 0.760.56 L <0.5. 41.3 42.5 42.0 44.7 39.9 42.4 39.8 42.7. 42.3 44.4 42.7 45.1 42.6 43.2 42.7 44.3. Note. Column (1): abbreviated NuSTAR source name. Column (2): NuSTAR effective photon index, i.e., the photon index obtained from approximating the NuSTAR 3–24keV spectrum as a simple power law. For the sources marked. Column (3): “soft” effective photon index, measured using the available soft X-ray spectra from Chandra, Swift XRT, or XMM-Newton (over the full energy range for the relevant observatory; ≈0.5–10 keV). Column (4): constraint on the Fe Kα line equivalent width. Units: keV. Columns (5) and (6): logarithm of the observed (i.e., uncorrected for absorption) X-ray luminosities in the restframe 2–10 keV and 10–40 keV bands, respectively. Units: erg s−1. a The constraint was obtained using a combination of NuSTAR and soft X-ray (XMM-Newton or SwiftXRT) data, due to weak NuSTAR-only constraints.. 4.2. Results for the X-Ray Source Properties Here we summarize the measured X-ray properties. Figure 4 shows the effective photon indices (i.e., the observed spectral slopes) of the sources, as measured with individual X-ray observatories, as a function of X-ray luminosity (uncorrected for absorption). The extreme NuSTAR sources cover a broad range in luminosity. The NuSTAR-measured effective photon indices (right panel of Figure 4) are generally very low (median value of Geff = -0.2 at 3–24keV), giving empirical evidence for very high absorption levels. We compare against another sample of extreme systems: highly obscured SDSS-selected Type 2 quasars targeted with NuSTAR (Gandhi et al. 2014; Lansbury et al. 2014, 2015). The two extreme samples cover a similar range of spectral slopes and lie at significantly harder values (i.e., lower Geff values) than the general population of “normal” NuSTAR serendipitous survey sources (also shown in Figure 4, for sources with constrained Geff values; Lansbury et al. 2017). The measured spectral slopes show a large scatter at soft energies (≈0.5–10keV; using Chandra, SwiftXRT, and XMM-Newton). For the NuSTAR-observed SDSS Type 2 quasars, this scatter was found to be partly due to an increased contamination at these lower X-ray energies from radiative processes other than the direct AGN emission (e.g., Lansbury et al. 2015), which may also be the case for some of the extreme NuSTAR sources (namely, J1534 and J1653; see Section 4.1). In other words, soft X-ray observations alone +19 would fail to identify 5721 % of the extreme sources in Figure 4 as highly obscured using spectral slope information (assuming a threshold of Geff = 1). NuSTAR observations, on the other hand, are highly reliable at identifying the most highly obscured AGNs. For the purposes of comparing NH constraints and estimating intrinsic luminosities (LX ; shown in Table 4), we adopt the torus model solutions. In one exception (J0823) we adopt the lower-NH transmission model solution. The adopted bestfitting NH and LX values are shown in Figure 5. Based on these intrinsic luminosity constraints, the more distant AGNs (z > 0.2) are at “X-ray quasar” luminosities (LX 10 44 erg s−1), and the less distant AGNs (z < 0.2) range from relatively low luminosities up to the quasar threshold (LX » 10 42.7–10 44 erg s−1). The NH constraints shown may be conservative for sources where the reflection model gives a statistically acceptable fit to the X-ray spectrum (indicating consistency with NH 10 24 cm−2). For a similar reason, the Compton-thin constraints shown for J1410 and J1444 may be conservative; the torus modeling also finds statistically acceptable reflection-dominated model solutions at very high CT column densities (NH > 6 ´ 10 24 cm−2) in these cases.. in Section 3.1). This is uncharacteristic of pure AGN emission and indicates that at low X-ray energies there is a significant contribution to the spectrum from other radiative processes in the host galaxy. We find that the detection of this soft component is due to the primary AGN spectrum being highly absorbed (see Sections 4.2 and 5) so as not to be well detected by Chandra. Indeed, the AGN is only detectable at >8 keV with NuSTAR. The luminosity of the soft X-ray emission 39.8 erg s−1; Table 3) is in broad agreement with (L 2obs – 10 = 10 the expectations for normal galaxy emission based on the X-ray main sequence of star formation (Aird et al. 2017) and given the stellar mass of J1534 ( M = 1011.1 M; based on the spectral energy distribution (SED) modeling in Section 5). If the soft component is instead interpreted as a scattered AGN power law, then the scattered fraction must be small ( fscatt 0.05%). For the spectral modeling of J1534 below, we parameterize the steep soft emission with an additional power-law component. We also tested a different approach of simply excluding the <2 keV photons, and this yields consistent values for the intrinsic source properties. For the sources where we model the NuSTAR data simultaneously with soft X-ray (Chandra, SwiftXRT, or XMM-Newton) data, there is a general caveat that the soft X-ray observations are not contemporaneous with the NuSTAR data, and AGN variability could thus affect the interpretations. Although highly obscured AGNs such as those presented here show some evidence for lower variability compared to unobscured AGNs (e.g., Awaki et al. 2006), significant variability on year-long timescales is still possible (e.g., Yang et al. 2016; Masini et al. 2017). While our sources generally show no evidence for significant variability (e.g., see the overlapping data in Figure 3), the spectral uncertainties are generally too large to rule out low-level (e.g., factors of 2) variability. We thus fix the cross-normalization constants to standard values: 1.0 for Chandra:NuSTAR, 1.0 for SwiftXRT: NuSTAR, and 0.93 for XMM-Newton:NuSTAR (e.g., Madsen 8.
(9) pow Object (1) J0505 J0823 J1410 J1444 J1506 J1512 J1534 J1653. E Range (keV) (2) 0.5–24 0.5–24 3–24 0.6–24 3–24 0.6–24 0.5–24 0.5–24. transmission. Geff. C/n. Γ. (3). (4). (5). NH (1024 cm−2) (6). [1.9] [1.9] [1.9] [1.9] [1.9] [1.9] [1.9] +0.5 2.30.4. +0.37 0.870.27 +1.51 0.730.61 +0.31 0.740.25 +0.28 0.210.17 +3.6 5.03.7 +0.22 0.130.06 +u 2.51.2 +1.3 2.40.9. −0.2±0.2 −0.2±0.7 0.3±0.4 0.8±0.5 +0.9 -0.71.6 0.4±0.2 +1.5 -2.3u +0.4 1.90.3. 164/142 78/54 78/87 98/75 77/64 123/98 90/74 182/194. torus. reflection C/n. Γ. C/n. Γ. (7). (8). (9). (10). 159/139 45/33a 78/87 104/75 82/64 142/98 84/72 165/192. 1.3±0.4 +1.0 2.60.7 1.8±0.4 +0.7 2.10.6 [1.9] +0.2 2.10.3 [1.9] +0.8 2.40.5. 148/139 71/53 82/87 102/75 79/65 112/98 90/73 179/193. +0.4 2.50.8. [1.9] [1.9] [1.9] +1.2 1.5u +u c 2.8-0.8 [1.9] +0.6 2.30.5. NH (1024 cm−2) (11) +4.7 1.50.5 +u 12.612.0 +0.31 b 0.630.24 +0.28 b 0.210.17 +u 4.12.3 +u 2.91.2 +u 1.61.1 +1.5 1.61.1. C/n. L 2int– 10. L10int– 40. CT. (12). (13). (14). (15). 148/142 41/33a 80/87 103/75 70/63 112/97 87/72 175/192. 43.1 44.4 L 45.1 L 44.6 42.7 44.3. 42.7 44.4 43.0 45.1 43.3 44.0 42.7 44.1. Y L L L Y Y y y?. The Astrophysical Journal, 846:20 (19pp), 2017 September 1. Table 4 Best-fit Parameters for the X-Ray Spectral Modeling. 9 Notes. Column (1): abbreviated NuSTAR source name. Column (2): energy range modeled (units of keV). Columns (3) and (4): best-fit results for the unobscured power-law model (pow; also shown in Figure 3), where Geff is the power-law photon index. Columns (5)–(12): best-fit results for the transmission, reflection, and torus models, respectively. These include the intrinsic photon index (Γ; square brackets indicate fixed values), the column density (NH ; units of 1024 cm−2), and the fit statistic (C/n, where C is the C-statistic and n is the number of degrees of freedom). An error value of +u or -u indicates that the parameter is unconstrained at the upper or lower end. Columns (13) and (14): logarithm of the intrinsic (i.e., absorption-corrected) X-ray luminosities in the rest-frame 2–10keV and 10–40keV bands, respectively. Units: erg s−1. Column (15): flag to indicate high-confidence CT AGNs and likely CT AGNs (marked as “Y” and “y,” respectively). J1653 is marked as “y?” since there is multiwavelength evidence against a CT interpretation (Section 5). For the three sources marked as “L” we cannot strongly rule out CT absorption based on the X-ray modeling. a As detailed in Section 4.1, the transmission and torus model fits for J0823 are performed for the NuSTAR data only (i.e., the XMM-Newton data are excluded). b For two sources (J1410 and J1444) we show the conservative low-NH torus model solution in this table, but in each case there is also a second similarly valid solution at very high column densities (for J1410, NH > 6 ´ 10 24 cm−2 and C n = 92 87; and for J1444, NH > 6 ´ 10 24 cm−2 and C n = 102 75). c For J1512, fixing Γ to more typical values results in even higher NH solutions (e.g., a lower limit of NH > 8 ´ 10 24 cm−2 for G = 1.9 ).. Lansbury et al..
(10) The Astrophysical Journal, 846:20 (19pp), 2017 September 1. Lansbury et al.. Compton-thin AGN (J1410), one uncertain but likely highly obscured AGN (J0823), and one likely moderately absorbed AGN (J1444). Of the total four likely CT AGNs identified with NuSTAR, none would be identified as CT using just the soft X-ray (<10 keV) data, except possibly J0505, for which the XMM-Newton spectrum alone shows good evidence for a 1 keV FeKα line. Prior to this work, only one other AGN has been identified in the NuSTAR extragalactic surveys with strong evidence for CT absorption. This source, ID330, was identified in the NuSTAR-COSMOS survey (Civano et al. 2015; Zappacosta et al. 2017). Like the robust CT AGNs presented here (J0505, J1506, and J1512), ID330 lies at low redshift (z = 0.044) and has a high NuSTAR band ratio (see Figure 1). Assuming a BNTORUS-based model to fit the X-ray spectrum, the column −2 +0.3 24 density of ID330 is NH = (1.2(Civano 0.1) ´ 10 cm et al. 2015), which is similar to J0505 and less extreme than J1506 and J1512. Additional CT candidates are identified by Del Moro et al. (2017) and Zappacosta et al. (2017), as part of studies that focus on the broad X-ray spectral properties of NuSTAR extragalactic survey sources. We note that our extreme sample (selected from the total 40-month serendipitous catalog; see Section 2) does not overlap with the Zappacosta et al. (2017) sample, which is a subset of 24 serendipitous sources (plus 39 sources from the NuSTAR dedicated-field surveys).. Figure 4. Observed X-ray properties: effective photon index (i.e., spectral slope) vs. rest-frame X-ray luminosity (uncorrected for absorption). The left panel shows the properties measured at soft X-ray energies (with Chandra, SwiftXRT, or XMM-Newton), and the right panel shows the properties NuSTAR are measured at harder X-ray energies with NuSTAR. Gsoft eff and G eff measured for the observed-frame ≈0.5–10keV and 3–24keV bands, respectively. We compare the extreme NuSTAR serendipitous survey sources (black circles, individually labeled) to “normal” serendipitous survey sources (smaller gray circles) and to highly obscured and CT Type 2 quasars which were optically selected and followed up with NuSTAR observations (filled gray squares; Gandhi et al. 2014; Lansbury et al. 2014, 2015).. 5. Indirect Absorption Diagnostics The intrinsic X-ray and MIR luminosities of AGNs are tightly correlated (e.g., Krabbe et al. 2001; Lutz et al. 2004; Horst et al. 2008; Fiore et al. 2009; Gandhi et al. 2009; Lanzuisi et al. 2009; Ichikawa et al. 2012; Matsuta et al. 2012; Asmus et al. 2015; Mateos et al. 2015; Stern 2015; Chen et al. 2017). The observed X-ray-to-MIR luminosity ratio of a source can therefore give an independent, albeit indirect, assessment of the degree of obscuration (e.g., see Alexander 2017, for a recent review); the observed X-ray luminosity for any significantly absorbed AGN will be suppressed with respect to the intrinsic luminosity, causing it to deviate from the X-ray-to-MIR luminosity relation. This diagnostic has been utilized for other NuSTAR studies of obscured AGNs (e.g., Baloković et al. 2014; Lansbury et al. 2014, 2015; Stern et al. 2014; Annuar et al. 2015, 2017; Gandhi et al. 2017; LaMassa et al. 2016). Figure 6 shows the observed X-ray versus intrinsic 6μm luminosities for the eight extreme NuSTAR serendipitous survey sources. Adopting the methodology of Assef et al. (2008, 2010, 2013), the AGN L 6m m values have been determined using SED modeling of the SDSS and WISE photometry available, where each SED is modeled as the bestfit linear combination of four empirical templates (one AGN template and three different galaxy templates; Assef et al. 2010). The approach allows constraints on the relative contribution of the AGN and the host galaxy to the observed luminosity (see Lansbury et al. 2014, 2015, for applications of the same technique to an SDSS Type2 quasar sample). For two of the extreme NuSTAR sources (J1444 and J1653) the SED modeling results are consistent with zero contribution from the AGN, and we therefore adopt conservative upper limits for L 6m m (Figure 6). For the remaining six sources, the AGN contributes between ≈0.07 and ≈0.77 of the overall luminosity, for the 0.1–30μm wavelength range (see. Figure 5. Rest-frame intrinsic (i.e., absorption-corrected) 10–40keV X-ray luminosity (LX ) vs. column density (NH ), from modeling the X-ray spectra of the extreme NuSTAR serendipitous survey sources (open circles). Each data point corresponds to the torus model solution (except J0823, where the transmission model solution is shown). Following Figure 4, the filled gray squares show a comparison sample of highly obscured Type 2 quasars (Gandhi et al. 2014; Lansbury et al. 2014, 2015). The CT column density region (NH 1.5 ´ 10 24 cm−2) is highlighted in gray.. Nevertheless, for these two sources we assume the lower-NH , Compton-thin solutions on the basis that their X-ray-to-MIR luminosity ratios are consistent with those for unobscured AGNs (Section 5). Considering all of the X-ray spectral constraints together, there are three sources with strong evidence for being CT AGNs (J0505, J1506, and J1512; two of which have supporting evidence from high equivalent width FeKα emission, as shown in Table 3), one likely CT AGN (J1534; supporting indirect evidence is presented in Section 5), one possible CT AGN (J1653; although the indirect evidence prefers a lowerobscuration solution; see Section 5), one highly obscured 10.
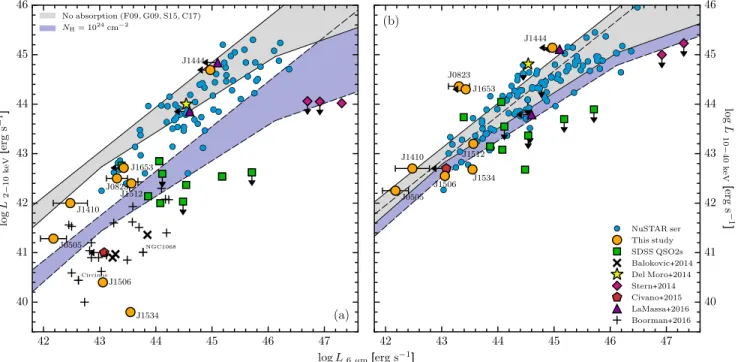
(11) The Astrophysical Journal, 846:20 (19pp), 2017 September 1. Lansbury et al.. Figure 6. X-ray luminosities (at rest-frame 2–10 keV and 10–40 keV) vs. rest-frame 6μm luminosity in nL n units (L 6mm ). For the data points, we show observed X-ray luminosities (i.e., uncorrected for line-of-sight absorption of the X-rays). The extreme NuSTAR serendipitous survey sources are highlighted as orange circles and are individually labeled. We compare to “normal” NuSTAR serendipitous survey sources (smaller blue circles; Lansbury et al. 2017) and to other NuSTARobserved samples of obscured to CT AGNs (see figure legend). We also compare with known “bona fide” CT AGNs in the local universe (plus signs; distance 100 Mpc; data compiled in P. G. Boorman et al. 2017, in preparation), including NGC1068 and Circinus. The gray regions (with solid borders) highlight the range of luminosity ratios expected in the case of zero X-ray absorption (based on Fiore et al. 2009; Gandhi et al. 2009; Stern 2015; Chen et al. 2017), and the purple regions (with dashed borders) show the approximate X-ray suppression expected for absorption by gas with a column density of NH = 10 24 cm−2.. NuSTAR-COSMOS survey (z = 0.044; C15). Also plotted are “bona fide” CT AGNs in the local universe (distance 100 Mpc; data compiled in P. G. Boorman et al. 2017, in preparation). We compare all sources with the intrinsic X-ray–MIR relation for unobscured AGNs (Fiore et al. 2009; Gandhi et al. 2009; Stern 2015; Chen et al. 2017), and to demonstrate the expected deviation from the relation for highly obscured AGNs, we also show the modified relation for X-ray luminosities suppressed by NH = 10 24 cm−2 gas. The latter results in a more extreme suppression of the X-ray luminosity for the 2–10keV band (LX is decreased by a factor of ≈20) than for the 10–40keV band (a factor of ≈2 decrease), where the higher-energy photons are less affected by absorption. For the eight extreme NuSTAR serendipitous survey sources, the X-ray-to-MIR luminosity ratios are in broad agreement with the X-ray spectral modeling results, in that the sources with X-ray spectroscopic evidence for being CT are further offset from the intrinsic LX –LMIR relations than the less obscured AGNs. This is especially apparent for J0505, J1506, J1512, and J1534 at 2–10keV, where these likely CT sources overlap well with the X-ray-to-MIR luminosity ratios of local “bona fide” CT AGNs, as well as luminous highly obscured and CT Type 2 quasars. The LX –LMIR ratios are very low in the cases of J1506 and J1534, which appear to lie even lower than local bona fide CT AGNs (including Circinus and NGC 1068), and have observed X-ray luminosities that are suppressed by ≈2–3 orders of magnitude. The X-ray properties of these NuSTAR sources (Section 4.2) suggest that the X-ray weakness is due to extreme absorption, rather than intrinsic X-ray weakness (e.g., Gallagher et al. 2001; Wu et al. 2011; Luo et al. 2014; Teng et al. 2015). J1653 has a relatively high ratio (at both 2–10 keV and 10–40 keV), suggesting a low column density that is in. Table 5 SED Modeling Results Object (1) J0505 J0823 J1410 J1444 J1506 J1512 J1534 J1653. (2). L 6m m 1042erg s−1 (3). 0.07±0.05 0.28±0.08 0.11±0.07 0.00+0.19 0.28±0.01 0.76±0.09 0.40±0.03 +0.06 0.020.02. 1.5±0.8 20.3±8.8 3.0±2.1 <933.2 11.4±0.7 36.6±1.7 35.3±3.8 <26.8. â. Note. Column (1): abbreviated NuSTAR source name. Column (2): fractional contribution of the AGN to the intrinsic luminosity at 0.1μm–30μm. Column (3): rest-frame 6μm luminosity of the AGN.. Table 5). The resulting uncertainties on L 6m m (also listed in Table 5) are determined from a Monte Carlo resampling of the photometric data over 1000 iterations and are shown in Figure 6. In Figure 6 we compare with “normal” NuSTAR serendipitous survey sources (Lansbury et al. 2017) and with other NuSTARobserved highly obscured AGNs, including nearby CT AGNs identified in the NuSTAR snapshot survey (z » 0.01; Baloković et al. 2014), candidate CT Type2 quasars selected by SDSS (z = 0.05–0.49; Gandhi et al. 2014; Lansbury et al. 2014, 2015), a highly obscured quasar identified in the NuSTAR-ECDFS survey (z » 2; Del Moro et al. 2014), and the CT AGN identified in the 11.
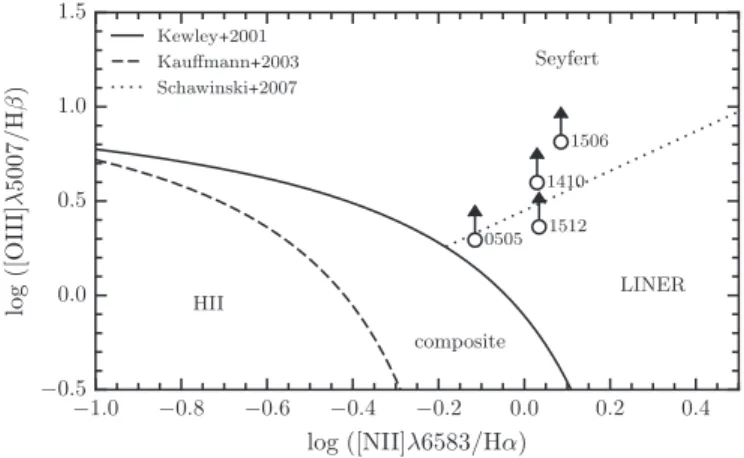
(12) The Astrophysical Journal, 846:20 (19pp), 2017 September 1. Lansbury et al.. emission-line properties, we fit the optical spectra for the major lines at rest frame 3500–7000 Å (e.g., [O II], Hb , [O III], [O I], Ha, [N II], and [S II]) with the pyspeckit software following Berney et al. (2015) and the general procedure in Koss et al. (2017). We correct the narrow-line ratios (Ha/Hb ) assuming an intrinsic ratio of 3.1 and the Cardelli et al. (1989) reddening curve. For six sources with significantly detected Ha emission lines (signal-to-noise ratio S N 4; J0505, J0823, J1410, J1506, J1512, and J1534), the Ha FWHMs range from 269 to 538 km s-1, before correction for instrument resolution. In no case is a second (broad-line) component required to provide a statistically acceptable fit to the data. These results confirm the visual classifications of these sources as narrow-line systems (Lansbury et al. 2017). We note that J1653 has only a weak detection of Ha, and J1444 is at high redshift (z = 1.539) such that the above emission lines are not in the redshifted spectrum. For four sources (J0505, J1410, J1506, and J1512), it is possible to apply AGN emission-line diagnostics (e.g., Kewley et al. 2006; Veilleux & Osterbrock 1987) using the [N II]/Ha and [O III]/Hb emission-line flux ratio constraints. This is not possible for J0823, due to a gap in the spectrum, and for J1534 and J1653, due to the low S/N of the key emission lines. Figure 7 shows the location of the former four sources on the Baldwin–Phillips–Terlevich (BPT) diagram. All four sources fall into the AGN region based on the upper limits for the Hb line, which is weak to undetected (S N < 3). The weak Hb line emission is likely due to extinction by dusty gas and has previously been observed for X-ray-selected obscured AGNs, particularly in mergers (e.g., Koss et al. 2016a, 2016b). We also note that Hb is undetected for J0823, J1534, and J1653, and even [O III] is undetected in the case of J1534. The seven z < 0.4 extreme NuSTAR AGNs would thus be unidentified in any optical surveys requiring the detection of Hb .. Figure 7. Emission-line ratios for the four sources where BPT diagnostics are possible. The solid line shows a theoretical maximum for starbursts (Kewley et al. 2001), the dashed line shows an empirical threshold to separate starforming H II regions from AGNs (Kauffmann et al. 2003), and the dotted line shows an empirical threshold to distinguish between Seyfert AGNs and LINER classifications (Schawinski et al. 2007).. tension with the high value measured in Section 4. We note, however, that not all known CT AGNs have low LX –LMIR ratios, and a small fraction are even underluminous in MIR emission compared to the intrinsic relations (NGC 4945, for instance; e.g., Asmus et al. 2015), which may in part result from MIR extinction. Overall, our indirect analysis does not highlight any additional likely CT AGNs in the extreme serendipitous sample that were not already identified by the X-ray spectral analysis. 6. Optical Properties 6.1. Optical Spectra For four of the eight extreme NuSTAR sources studied here, the optical spectra were obtained from our dedicated followup program with Keck (for J1444 and J1653; using the LRIS instrument), Magellan (J0823; using the IMACS instrument), and the NTT (J1512; using the EFOSC2 instrument).37 Details of the observing runs and follow-up campaign are provided in Lansbury et al. (2017). For two sources (J1506 and J1534) the optical spectra are from the SDSS. For the remaining two sources (J0505 and J1410) the spectroscopic redshifts and spectra are from the 6dF survey (Jones et al. 2004, 2009) and the Anglo-Australian Telescope (AAT) observations of Radburn-Smith et al. (2006), respectively. The optical spectra are provided in the Appendix. The spectroscopic redshifts (see Table 1) are all robust, having been determined using 4–15 detected emission/absorption lines for each source (median of nine detected lines per source), except in the case of J1444, where the redshift solution is based on two weakly detected emission lines (most likely C IV and C III] at z = 1.539). All of the optical spectra show narrow emission lines and have continua that appear consistent with being dominated by the host galaxy. In five cases (J0505, J1410, J1506, J1534, and J1653) the latter is confirmed by the identification of galactic absorption lines. These optical properties are congruous with the interpretation of these AGNs as obscured systems, in agreement with the X-ray constraints. To quantify the 37. 6.2. Host Galaxies The five lower-redshift (z < 0.2) extreme NuSTAR sources (J0505, J1410, J1506, J1512, and J1534) have well-resolved host galaxies at optical wavelengths, while the higher-redshift sources are consistent with point-source emission. Four of the five lower-redshift sources are likely CT systems based on our X-ray analyses and also have relatively high quality optical coverage from Pan-STARRS (PS1; Chambers et al. 2016) or our own ESO-NTT imaging (see Figure 8). The other lowerredshift source (J1410), on the other hand, is Compton-thin and is limited to low-quality optical coverage from photographic plate observations. Here we comment on the host galaxies, and nearby companion galaxies, for the lowerredshift sources. J0505.—The optical counterpart is 2MFGC04170, a highly inclined disk galaxy. The Pan-STARRS coverage of 2MFGC04170 reveals spatially extended emission at ≈12″ offset (or a projected separation of ≈9 kpc) and at a position angle of ≈70°, which appears consistent with being a companion galaxy to 2MFGC04170 (see Figure 8). We hereafter refer to this second companion source as J050601.2–235002.6. Since this source had no available redshift information, we performed follow-up spectroscopy with Keck (provided in the Appendix). We find that J050601.2–235002.6 lies at z = 0.137 and is therefore a. Magellan program ID: CN2015A-87. NTT program ID: 093.B-0881.. 12.
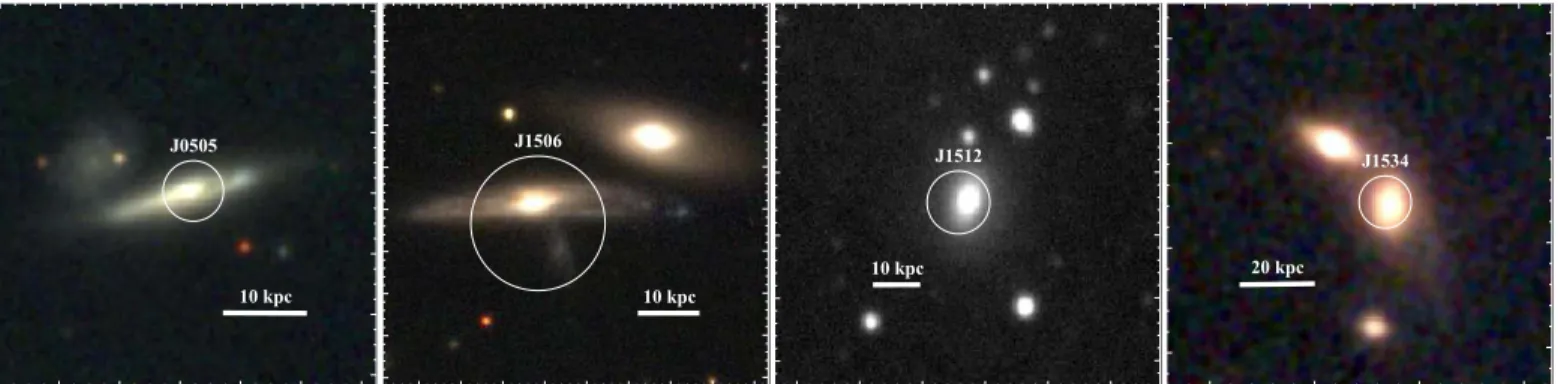
(13) The Astrophysical Journal, 846:20 (19pp), 2017 September 1. Lansbury et al.. Figure 8. Optical images for the extreme NuSTAR sources that have both a high CT likelihood and a well-resolved host galaxy in the optical imaging. For J0505 (first panel; z = 0.036), J1506 (second panel; z = 0.034), and J1534 (fourth panel; z = 0.160) we use Pan-STARRS (g, r, and i band) color composites. For J1512 (third panel; z = 0.069) we use NTT R-band imaging from our follow-up program. The white circles mark the X-ray positions: for J1506 we show the NuSTAR positional error circle (16 radius), while for J0505, J1512, and J1534 the circles mark the XMM-Newton, SwiftXRT, and Chandra positions, respectively (5 , 5 , and 2 5 radii shown, respectively). North is up and east is to the left. The major tick marks indicate 10 offsets in R.A. (horizontal axes) and decl. (vertical axes). Two of these NuSTAR-identified likely CT AGNs (J1506 and J1534) belong to major mergers, with likely tidal features visible in both cases.. background galaxy that is coincidentally aligned along the line of sight, rather than being a merging companion to 2MFGC04170. J1506.—The optical counterpart is UGC09710, an edgeon Sb spiral galaxy belonging to a close spiral–spiral galaxy pair in an early-stage major merger (see Figure 8), and separated from its similar mass partner galaxy (IC 1087; z = 0.035; S0-a type) by »16 kpc in projection (Yuan et al. 2012). Physical disturbances resulting from the major merger could potentially be related to an increase in the central gas content. In the Appendix we present a Palomar optical spectrum for the companion galaxy (IC 1087), which shows a possible AGN (also consistent with a LINER classification) with a dominant galaxy continuum. [O III] and Hb are undetected for the companion galaxy (presumably due to host galaxy dilution), and the [N II]:Ha line strength ratio is very high, but is likely affected by stellar absorption. For this companion galaxy, there is no additional evidence from the WISE colors for an AGN, and the source is undetected in the current X-ray coverage. J1410.—The available photographic plate coverage (from the UK Schmidt Telescope) shows an extended host galaxy, but the low data quality precludes type and disturbance classifications. Nevertheless, there do not appear to be any nearby (massive) companion galaxies. J1512.—We have obtained R-band imaging with the ESONTT (shown in Figure 8), which is in visual agreement with the host being a relatively undisturbed early-type galaxy. The neighboring optical sources are consistent with being unresolved point sources, with FWHMs similar to the seeing (»1. 5), and are therefore unlikely to be associated with J1512. J1534.—The Pan-STARRS imaging (Figure 8) shows good evidence that the optical host galaxy (SDSS J153445.80 +233121.2; z = 0.160) is undergoing a major merger with a narrowly offset companion galaxy (SDSS J153446.19 +233127.1; no spec-z); the respective galaxy nuclei are separated by »8 (or »22 kpc in projection), and likely extended tidal features are visible. The merger stage is not clear. We present Palomar spectroscopic follow-up for the. Figure 9. Fraction of host galaxies in major mergers, for NuSTAR serendipitous survey sources at z < 0.2 . The fraction is shown for two subsets of the serendipitous survey: (1) the extreme AGNs (square) with very hard X-ray spectra and evidence for CT obscuration (J0505, J1506, J1512, and J1534, i.e., those discussed in this work) and (2) “normal” NuSTAR AGNs (diamond). We also compare to the major-merger fraction for SwiftBAT AGNs (triangle; Koss et al. 2010) and those for inactive galaxies and SDSS AGNs matched to the SwiftBAT sample (circle and pentagon, respectively; Koss et al. 2010; the error bars are smaller than the data points). Uncertainties are shown at the 90% confidence level.. companion galaxy in the Appendix, although there are no significantly detected emission or absorption features. A notable feature of the galaxies is that both J0505 and J1506 have close to edge-on geometries, which could contribute at least some of the observed X-ray obscuration. The axis ratios of the host galaxies are b a = 0.24 and 0.23 for J0505 and J1506, respectively, based on isophotal fitting of the galaxy images in Figure 8 (using the IRAF task ellipse). The remaining two likely CT sources (J1512 and J1534), on the other hand, have axis ratios exceeding b a = 0.6. Although the source numbers are currently small, the above implies a relatively high fraction (50%±33%) of close to edge-on systems for CT AGNs selected by NuSTAR. For comparison, only ≈16% of the general hard-X-rayselected AGN population have b a < 0.3, based on isophotal analyses for the SwiftBAT AGN sample (Koss et al. 2011). Although the difference is only weakly significant, a similar result has also been reported for CT AGNs selected with SwiftBAT (Koss et al. 2016a). Other studies, however, find that edge-on galaxy inclinations are not clearly related to CT absorption (e.g., Annuar et al. 2017; Buchner & Bauer 2017). 13.
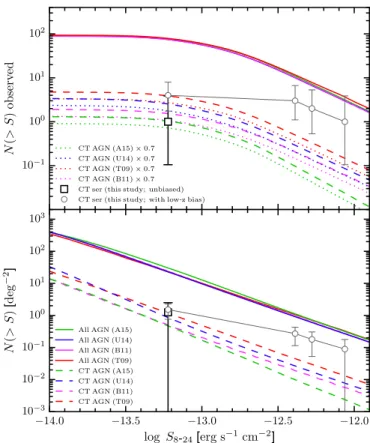
(14) The Astrophysical Journal, 846:20 (19pp), 2017 September 1. Lansbury et al.. 6.2.1. A High Fraction of Galaxy Mergers for the Compton-thick AGNs?. It is interesting that two of the four likely CT AGNs (J0505, J1506, J1512, and J1534) are hosted by galaxy major mergers (see Figure 8). To assess the statistical significance of the apparently high merger fraction for these extreme NuSTAR serendipitous survey AGNs ( fmerger = 50 33%; the errors represent binomial uncertainties), we can search for similar merging systems in the sample of nonextreme (or “normal”) serendipitous survey AGNs. To this end, from the overall serendipitous survey sample, we apply a cut of BRNu < 1.7, thus limiting to those sources that do not have very hard NuSTAR spectra (based on the BRNu threshold in Section 2). We limit this comparison sample to source redshifts of 0.01 < z < 0.2, thus matching the redshift range of the four extreme sources. We exclude two sources from the sample that are likely strongly associated with the science targets of their NuSTAR observations (similar to the exclusion of J2028 from the extreme sample; see Section 2). These cuts leave 36 normal NuSTAR sources. Finally, we limit the sample to the 26 (out of 36) sources that are covered by Pan-STARRS observations and therefore have optical coverage that is of comparable quality to the four extreme NuSTAR sources. As a result, the comparison of visual merger classifications between the two different samples is unlikely to be significantly affected by variations in optical imaging sensitivity. The comparison sample is matched in X-ray luminosity distribution to the extreme NuSTAR AGNs (with a Kolmogorov–Smirnov test p-value of 0.8). Of the 26 normal AGNs, we identify one that has evidence for a galaxy major merger, with a comparably sized companion galaxy lying at the same redshift and offset by a projected distance of »25 kpc. There are an additional two normal AGNs with possible evidence for mergers, although the candidate companion galaxies are relatively small in size, with unknown redshifts. We conservatively assume that two of the normal AGNs are in major mergers with <30 kpc separation companions. Our estimate for the major-merger fraction of +12 normal NuSTAR AGNs is therefore fmerger = 85 %. This is in agreement with the (<30 kpc separation) major-merger fraction +7 for SwiftBAT AGNs ( fmerger = 135 %; Koss et al. 2010). Figure 9 compares the above merger fractions. We additionally compare with low-redshift inactive galaxies and optical Type2 AGNs (both from the SDSS), which are matched to the SwiftBAT sample (Koss et al. 2010) and have very low merger fractions compared to the SwiftBAT and extreme NuSTAR AGNs. At low significance levels of 1.8s and 1.7s (according to the Fisher exact probability test), the extreme (very hard, CT) NuSTAR AGNs have a higher merger fraction than both the normal NuSTAR AGNs and the SwiftBAT AGNs, respectively. This could be a result of Compton-thick phases of black hole growth being more strongly linked (than less obscured phases) to the merger stage of the galaxy evolutionary sequence. The above result is of interest given recent findings for other AGN samples. Kocevski et al. (2015) find evidence that highly obscured (NH 3 ´ 10 23 cm−2) AGNs at z ~ 1 have a higher frequency of merger/interaction morphologies relative to less obscured AGNs matched in redshift and luminosity. Furthermore, Koss et al. (2016a) noted a high close (<10 kpc) merger fraction for likely CT SwiftBAT. Figure 10. Top panel: observed cumulative number counts (and 90% CL uncertainties), as a function of 8–24keV flux (S8 – 24 ), for the CT AGNs identified in the NuSTAR serendipitous survey. The gray circles show the number counts for all four CT AGNs. The black square shows the modified number counts when removing the three low-redshift CT AGNs (J0505, J1506, and J1512; see Section 7). We compare to predicted tracks for CT AGNs (dashed lines) and all AGNs (solid lines) based on the models of A15, U14, B11, and T09. The dotted lines show modifications of the CT model tracks to account for the spectroscopic incompleteness of the serendipitous survey. Bottom panel: “intrinsic” cumulative number density (and 68% CL uncertainties) as a function of flux.. AGNs at z 0.03 ( fmerger = 22%; i.e., 2/9). The recent study of Ricci et al. (2017) indicates a possible connection between the late stages of galaxy mergers and high AGN obscuration, in a sample of local luminous and ultraluminous infrared galaxies (U/LIRGs), using a combination of dedicated and archival X-ray observations. Taken together, the results may suggest a departure from simple orientation-based unified models of AGN obscuration and indicate an evolutionary scenario where highly obscured phases of black hole growth can be associated with a merger-driven increase in the circumnuclear gas content (e.g., Sanders et al. 1988; Draper & Ballantyne 2010; Treister et al. 2010). An increased sample size and deeper imaging would help to further test the CT AGN–merger connection using the NuSTAR serendipitous survey.. 7. The Prevalence of Compton-thick Absorption We have taken advantage of the relatively large sample size of the NuSTAR serendipitous survey to identify rare highly obscured AGNs. While all of the eight extreme sources investigated are consistent with being highly obscured, four in 14.
Figure
+7

Documento similar
We explored di fferent approaches to obtain reliable total fluxes and colours from the image set that contribute to the OTELO core catalogue in a quick and accurate fashion, using
Mart in point ed out t hat t he artificial upturn in the lower main sequence is a common artefact in global-fits and is caused by the breakdown of Fe ionization balance at low t
✴ WEAVE , IFU mode (fov = 2 sq. arcmin, with 1-2.5 arcsec/sparxel) to trace the stellar population of galaxies beyond 3 HLR in a large sample of galaxies covering all
The science foreseen for the previous co-additions of the Stripe 82 survey has been focused on ‘point sources science’ (i.e. Unfortunately, the pipeline used for the reduction of
To further characterize how the interplay of the localized plasmonic resonances and the active medium enables lasing action in the considered class of systems, we study the dynamics
Noting that the V 0s emanating from the t → W b branch have displaced decay vertexes from the interaction point due to the weak decays b → c → s, and that the b-quark jets are rich
Finally, experiments with solar [17–34], atmospheric [35–45], reactor [46–50], and long-baseline accelerator [51–59] neutrinos indicate that neutrino flavor change through
In this Thesis, the weak-lensing magnification has been measured using two data- sets for the Dark Energy Survey: the Science Verification (DES-SV) and the Year 1 (DES-Y1),
