Temporal variation on the diet of the South American Tern (Sterna hirundinacea, Charadriiformes: Laridae) on its wintering grounds
10
0
0
Texto completo
(2) 452. ALFARO ET AL.. relation to the availability and abundance of prey (Barrett et al. 2007). The diet of many species of migratory seabirds, including terns, is well known during the breeding season, but information is scarce during the non-breeding season (Barrett et al. 2007). However, the diet of terns can be studied relatively easy in their roosting areas through pellet analysis (Barrett et al. 2007). T h e S o u t h A m e r i c a n Te r n ( S t e r n a hirundinacea Lesson) is a migrator y species endemic to South America. In Ur uguay it is a winter visitor (March-September) that uses the coastal areas along the Atlantic coast for roosting and feeding (Escalante 1970, Azpiroz 2003, Alfaro & Clara 2007). Migratory movements of this species, as well as the origin of the flocks observed in Uruguay and in the region during winter, are poorly known. However, due to their phenology some authors have proposed that they come from the breeding colonies in Patagonia, Southern Argentina (Escalante 1970, Favero et al. 2000, Bugoni & Vooren 2005, Alfaro & Clara 2007, Gatto et al. 2009). Rocha lagoon is one of the most important roosting areas for this species in Ur uguay, where flocks of approximately 2000 individuals are common during the austral winter (Alfaro & Clara 2007). Favero et al. (2000) studied the diet of the South American Tern in three dif ferent wintering areas in Buenos Aires Province, Argentina, and deter mined that the diet was composed of fish (mainly the Argentine Anchovy), crustaceans and insects. Temporal variation was not analyzed by these authors but they found significant variation in the propor tion of fish consumed between the localities analyzed. Diet on breeding grounds in Patagonia has not been published yet, but unpublished information confirms it is mainly composed of the Argentine Anchovy (Gatto & Yorio 2009). The Argentine Anchovy (Engraulis anchoita Hubbs & Marini) is distributed in neritic areas of the south-western Atlantic Ocean from Rio de Janeiro (Brazil) to San Jorge Gulf (Argentina) (Hansen 2000). This species reproduces in Uruguayan coastal areas during winter (JuneAugust), then, during spring and summer adults migrate southward to Patagonia, but larval and juvenile age classes stay in the area (Nion & Ríos 1991). Although it is recorded. during the entire year in Uruguayan waters, its abundance is significantly higher during winter and mainly composed of adults (Ehrhardt et al. 1977, 1978, Sánchez & de Ciechomski1995, Hansen & Madirolas 1996, Hansen et al. 1996, Cousseau & Perrotta 2000). Because the Argentine Anchovy was the main prey consumed by the South American Te r n i n A r g e n t i n a a n d t h e i r s e a s o n a l movements between the breeding and nonbreeding areas coincide with tern movements, the possibility of a predator-prey relationship between these two species was suggested (Favero et al. 2000, Silva Rodríguez et al. 2005). Similar predator-prey relationships have been observed in the breeding areas of pelicans and terns (e.g., Anderson et al. 1982, Schaf fner 1986). In these cases, a positive relationship between anchovy abundance and the reproductive success and abundance of seabirds was observed (Anderson et al. 1982, Schaffner 1986). Favero et al. 2000 suggested that during migration between breeding areas in Patagonia and wintering areas in Buenos Aires and Uruguay, South American Terns are taking advantage of the anchovies, following this abundant resource. According to this suggestion, we tested the hypothesis that South American terns feed mainly on Argentine Anchovies during the non-breeding season in Uruguay. To evaluate this, we determined diet composition, main prey, temporal variation, and feeding strategy of the South American Tern during two years in the Atlantic coast of Rocha, Uruguay. The technique used to assess the diet was the analysis of terns’ pellet content, which has some biases associated that were also evaluated.. METHODS Diet of the South American Tern was assessed by the analysis of regurgitated pellets collected during two consecutive winter seasons (2005 and 2006) in their roosting areas on Rocha lagoon sandbar (34º31’- 34º38’ S and 54º12’-54º22’ W) (Fig. 1). Rocha lagoon is a coastal, shallow and saline lagoon with a sandbar in the southern part. This sandbar is temporarily connected with the Atlantic Ocean through a mouth located at the southwestern tip of the sandbar (Fig. 1).The tern’s roosting areas are located on the sandbanks that appear inside the lagoon close to the mouth (where the lagoon water level is shallow) and in the sand dunes and shorelines along the sandbar..
(3) DIET AND PREY PREFERENCE OF THE SOUTH AMERICAN TERN. Pellet analysis is a common, relatively easy and non-invasive way of studying the diet of many species of seabirds. Biases associated with this technique include pellet identification, digestibility of the otoliths, underrepresentation of soft prey species, identification of the prey, and sample fidelity (Duffy & Jackson 1986, Barrett et al. 2007). All of these biases were considered in this study as described in the following methodology. A total of 844 pellets was collected from May to September, 442 in 2005 and 402 in 2006 non-breeding seasons. To determine the temporal variation of the diet during each season, pools of pellets were collected throughout the season. Dates and number of pellets collected at each sampling date are as follows: 1 June (27), 20 July (102), 5 August (161), 16 August (75) and 9 September (77) in 2005, and 25 May (105), 3 July (116), 3 August (141) and 5 September (40) in 2006. All pellets were collected from mono-specific flocks in order to avoid confusion with pellets of other, similar species. Pellets were individually stored in plastic bags and frozen at -20 ºC until analysis. Total length and width of 107 pellets and the dry weight of 224 pellets were recorded as part of pellet description and separation from other species. A stereomicroscope (14x) was used to separate and identify the remains found in each pellet (e.g., insect’s jaws and heads, and fish’s otoliths). Sagitta otoliths, crustacean and insect remains were identified. Fig. 1: Map of the study area. The circle shows the South-West tip of the Rocha lagoon sandbar where South American Terns’ pellets were collected in 2005 and 2006. Mapa del área de estudio. El círculo muestra la punta suroeste de la barra de la laguna de Rocha donde los bolos del Gaviotín Sudamericano fueron colectados en 2005 y 2006.. 453. using bibliography (Torno 1970, Freyre & Mollo 1987, Martínez & Monasterios de Gonzo 1991, Volpedo & Echeverria 1997) and compared with reference material from three scientific collections: INIDEP (Instituto Nacional de Investigación y Desarrollo Pesquero, Mar del Plata, Argentina), UNMLP (Universidad Nacional del Mar del Plata, Argentina) and UDELAR (Universidad de la República, Facultad de Ciencias, Uruguay). The number of fish per pellet was estimated using the maximum number of hypural bones, otolith pairs or eye lense pairs. The total number of insects was estimated counting the maximum number of heads, proboscis, and pairs of eyes or jaws. Finally, the number of crustaceans was estimated using pairs of crab’s chelipeds, number of entire heads or crustacean’s juveniles or estimating the number of adults considering a minimum of one adult per pellet if only exoskeleton remains were present. Other soft prey species that could be detected in the diet are Cephalopods that can be detected and identified using their beaks. With all the items used to identify soft prey species, we expected no significant underrepresentation of them. Otolith length was measured to estimate the total length and mass of each fish species using regression equations previously described (Baldás et al.1997, Bugoni 2001, Bugoni & Vooren 2004, Saccardo et al. 2005, Mauco 2006) (Table 1). When an otolith was broken or eroded, the total length was estimated comparing them with well preserved otoliths of the same species. For fish species without regressions available and with less than 1 % of the abundance (N %) in the diet, their mass was estimated to be the same as the mean weight of the other fishes. Crustacean mass was estimated using the mean mass of fresh adults and juveniles collected in the study area. Insect mass was estimated in a similar way, weighing fresh insects of different taxonomic categories and assigning to each prey insect the mean mass which corresponds to its species. For each item, the frequency of occurrence (F) (calculated as the number of pellets in which the item was found), the abundance by number (N), and the mass (M) (estimated by the above equations) was calculated (Duffy & Jackson 1986, Bugoni & Vooren 2004). The importance of each item in the diet was determined using the index of relative importance IRI = F % (M % + N %), where F %, M % and N % are the percentage of frequency of occurrence, mass and abundance by number in the pooled sample (Bugoni & Vooren 2004). Inter-annual variation of each category N %, F %, M % and IRI % of the most important species was analyzed using the G-test of independence (G = 2 ∑ [observed values x ln (observed values/expected values)]) based on the null hypothesis of no significant differences between years (Sokal & Rohlf 1987). To analyze the feeding strategy (specialistgeneralist) of the South American Tern, we used the modification of Costello’s graphical analysis as proposed by Amundsen et al. (1996). In this method the preyspecifi c abundance and the frequency of occurrence are plotted in a two-dimensional graph. Prey-specific abundance (Pi) is the percentage of a prey taxon among all prey items in only those pellets in which the prey occurs, Pi = (∑Si/∑Sti) 100 where Si is the pellet content (in terms of number) of prey i, and Sti the total pellet content in only those pellets with prey i. The distribution of the points on the graph indicates the feeding strategy, prey importance, and niche width of the predator. The method was designed to analyze stomach contents but in this case it is used to analyze pellet content..
(4) 454. ALFARO ET AL.. Sample rarefaction curves (sample vs. prey species richness) were built to test sample fidelity (if the number of pellets collected per sample was enough to reach prey richness) (Gotelli & Colwell 2001). Temporal variability of the diet was analyzed using Shannon diversity index H (H = -∑ (ni n-1) ln(ni n-1), where ni = number of individuals of the species i in a sample, and n = total number of individuals registered in the sample) and Shannon equitability (H/ln(S), S = total richness of the sample). We compared the confidence intervals of each index through Boostrap analysis using PAST software (Hammer et al. 2001). Temporal variation in the importance by number (N %) of the main fish items was analyzed with a G-test of independence (Sokal & Rohlf 1987).. RESULTS. General aspects of the diet The pellets contained fish remains (scales, ver tebrae, otoliths, eye lens, jaws and undigested fish tails), insect remains, crustacean remains and feathers. Fish remains were found in 83.6 % of all pellets, otoliths in 50.2 %, insects in 16.1 %, and crustaceans in 12.4 %. The mean number of prey species per pellet was 4.27 ± 5.33 (SD) (N = 832). This amount was biased by a high abundance of insects found in the diet in 2005. Considering only fish. and crustaceans, the mean number of prey species per pellet is 3.02 ± 2.13 (SD) (N = 771). Mean pellet length and width was 18.68 ± 3.26 mm (SD) (N = 107) and 11.84 ± 1.9 mm (SD) (N = 107), respectively. Mean dry weight was 0.57 ± 0.21 g (SD) (N = 224). The diet was composed of 11 fish species, 16 insect and one crustacean species (Table 2). The most important items were: Argentine Anchovy (IRI % = 77.7 %), Marini’s Anchovy (Anchoa marinii Hildebrand) (7.9 %), Giant Water Bug (Belostoma sp. Hinton) (5.9 %), Mole crab (Emerita brasiliensis Schmitt) (4.5 %) and Striped Weakfish (Cynoscion guatucupa Cuvier) (3.6 %). Fish was the most impor tant item in the diet in both years, followed by insects in 2005 and crustaceans in 2006. Fish’s N %, F %, M % and IRI % did not present significant differences between years (N %, G = 2.655; F %, G = 0.379; M %, G = 0.177; IRI %, G = 0.045; all tests df = 1 and P > 0.05). However, insect and crustacean N %, F% and IRI % differed between years (N %, G = 54.35; F %, G = 14.13; IRI %, G = 23.15; all tests df = 1 and P < 0.01 for insects). Ten fish species and 13 insect items were found in the diet during the 2005 season. The. TABLE 1. Regressions (otolith-total length, otolith-body mass, total length-body mass) used for the main fishes found in the diet of the South American Tern. TL = total length, OL = otolith length, M = body mass. ªBaldás et al. (1997), °Bugoni (2001), *Mauco (2006), bSaccardo et al. (2005). Regresiones (otolito-largo total, otolito-masa corporal, largo total-masa corporal) utilizadas para los principales peces encontrados en la dieta del Gaviotín Sudamericano. TL = largo total, OL = largo del otolito, M = masa corporal. ªBaldás et al. (1997), °Bugoni (2001), *Mauco (2006), bSaccardo et al. (2005).. Species. Total length (mm). Body mass (g). Anchoa marinii*. TL = 27.08 OL + 26.99. M = 0.93 OL1.99. Engraulis anchoita*. TL = 32.62 OL + 17.87. M = 0.39 OL2.97. Macrodon ancylodon°. TL = 18.451 OL – 6.412. M = 1.633 (10-6) TL3.3014. Cynoscion guatucupa*. TL = 18.84 OL – 2.15. M = 0.06 OL3.07. Paralonchurus brasiliensis*. TL = 27.57 OL – 29.09. M = 0.0097 OL4.22. Odonthestes argentinesis*. TL = 43.88 OL – 3.75. M = 0.48 OL3.01. Porichthys porosissimus°. TL = 26.734 OL – 8.335. M = 6.1769 (10-6) TL3.0948. Trachurus lathami ª, b. OL = 2.85TL + 0.036. M = 0.000014 TL2.91. Urophysis brasiliensis°. TL = -22.65 + 24.254 OL. M = 2 (10-7) TL3.7386.
(5) 455. DIET AND PREY PREFERENCE OF THE SOUTH AMERICAN TERN. TABLE 2. Composition of the diet and frequency of occurrence (F, F %,), abundance (N, N %), mass (M, M %) and Index of relative importance (IRI, IRI %) for each of the items in the diet of the South American Tern in Rocha, Uruguay. Items in bold have more than 1 % of the IRI in the diet. Asterisk * shows the species which had their body masses estimated using the mean mass of all other fishes. Composición de la dieta y frecuencia de ocurrencia (F, F %), abundancia (N, N %), masa (M, M %) e índice de importancia relativa (IRI, IRI %) para cada uno de los ítems encontrados en la dieta del Gaviotín Sudamericano en Rocha, Uruguay. Los ítems en negrita fueron los que presentaron más del 1 % del IRI en la dieta. El asterisco * indica las especies en las cuales la masa corporal tuvo que ser estimada utilizando el promedio de la masa de todo el resto de los peces encontrados en la dieta. Ítem. F. F%. N. N%. M. M%. IRI. IRI %. Anchoa marinii. 145. 17.18. 304. 10.49. 1562.04. 14.06. 421.83. 7.91. Engraulis anchoita. 368. 43.60. 629. 21.71. 8155.76. 73.41. 4147.53. 77.75. 1. 0.12. 1. 0.03. 36.73. 0.33. 0.04. 0.00. 144. 17.06. 209. 7.21. 448.90. 4.04. 192.03. 3.60. Paralonchurus brasiliensis Steindachner. 2. 0.24. 2. 0.07. 8.32. 0.07. 0.03. 0.00. Fishes Fam. Engraulidae. Fam. Scianidae. Macrodon ancylodon Bloch & Schneider Cynoscion guatucupa. Fam. Atherinopsidae. Odonthestes argentinesis. 21. 2.49. 31. 1.07. 32.90. 0.30. 3.40. 0.06. Fam. Ophiididae. Raneya brasiliensis Kaup*. 1. 0.12. 1. 0.03. 7.41. 0.07. 0.01. 0.00. Fam. Batrachoididae. Porichthys porosissimus Cuvier. 3. 0.36. 3. 0.10. 199.92. 1.80. 0.68. 0.01. Fam. Carangidae. Trachurus lathami. 20. 2.37. 21. 0.72. 8.18. 0.07. 1.89. 0.04. Fam. Phycidae. Urophysis brasiliensis Kaup. 6. 0.71. 6. 0.21. 38.49. 0.35. 0.39. 0.01. Fam. Merluccidae. Merluccius hubbsi Marini*. 1. 0.12. 1. 0.03. 4.00. 0.04. 0.01. 0.00. Coleoptera not identified. 4. 0.47. 3. 0.10. 0.63. 0.01. 0.05. 0.00. Coleoptera not identified. 1. 0.12. 2. 0.07. 2.73. 0.02. 0.01. 0.00. Insects Order Coleoptera. Coleoptera not identified. 1. 0.12. 1. 0.03. 0.42. 0.00. 0.00. 0.00. Fam. Hidrophylidae. 5. 0.59. 6. 0.21. 1.26. 0.01. 0.13. 0.00. Fam. Curculionidae. 14. 1.66. 20. 0.69. 20.44. 0.18. 1.45. 0.03. Fam. Dysticidae, Rhantus sigatus. 16. 1.90. 33. 1.14. 0.37. 0.00. 2.17. 0.04. Fam. Scarabaeidae, Dyscinetus gagates. 21. 2.49. 59. 2.04. 36.54. 0.33. 5.89. 0.11. Order Hemiptera. Fam. Belostomatidae, Bellostoma sp.. 73. 8.65. 1058. 36.52. 2.52. 0.02. 316.07. 5.93. Order Odonata. Fam. Aeshnidae, Aeshna sp.. 10. 1.18. 12. 0.41. 0.62. 0.01. 0.50. 0.01. Order Orthoptera. Orthoptera not identified (Grasshopper). 1. 0.12. 1. 0.03. 4.96. 0.04. 0.01. 0.00. Fam. Acrididae. 5. 0.59. 8. 0.28. 0.21. 0.00. 0.16. 0.00. Fam. Gryllidae. 1. 0.12. 1. 0.03. 0.62. 0.01. 0.00. 0.00 0.00. Fam. Gryllotalphidae. 1. 0.12. 1. 0.03. 188.85. 1.70. 0.21. Order Lepidoptera. Lepidoptera not identified. 3. 0.36. 3. 0.10. 1.86. 0.02. 0.04. 0.00. Order Diptera. Diptera not identified. 1. 0.12. 1. 0.03. 0.00. 0.00. 0.00. 0.00. Not identified. Insects not identified. 15. 1.78. 13. 0.45. 0.21. 0.00. 0.80. 0.02. Fam. Hippoidea, Emerita brasiliensis. 105. 12.44. 467. 16.12. 344.90. 3.10. 239.17. 4.48. Crustaceans. 844. 2897. 11109.79. 5334.52.
(6) 456. ALFARO ET AL.. most important prey species was the Argentine Anchovy (70.2 %) followed by the Giant Water Bug (16 %) and Marini’s Anchovy (9 %) (Fig. 2). In 2006 the diet was composed of nine fish species, six insect species, and one crustacean species. The most important prey species was again the Argentine Anchovy (63 %) followed by the Mole crab (24.4 %), the Striped Weakfish (7 %) and Marini’s Anchovy (4.6 %) (Fig. 2). There were no significant differences between the IRI % of the Argentine Anchovy (EAN) and Marini’s Anchovy (AMA) between years (EAN, G = 0.396; AMA, G = 1.464; df = 1, P > 0.05 for both), however, the Striped Weakfish IRI % differed between years (G = 5.963, df = 1, P < 0.05). Fish mean total length was 103.6 ± 30.6 mm (SD) (N = 453), and 89.6 ± 35.8 mm (SD) (N = 491) in 2005 and 2006, respectively. The largest insect found in the diet was the Giant Water Bug, with a total body length of 20.8 mm, and the smallest corresponded to a species of the Family Curculionidae (4.6 mm total body length). The Mole crab was the only species of crustacean found in the diet. Its estimated mean size was 20 mm total body length and 3.0 g mass in adults, and 5.5 mm and 0.05 g in juveniles (we considered juveniles to those crabs whose exoskeleton was still soft). Fish mean body mass consumed during the 2005 season was 9.8 ± 6.8 g (SD) (N = 453), while it was 7.7 ± 6.9 g (SD) (N = 491) in 2006. Insects body mass ranged from 0.02 to 0.62 g; however, the most abundant insect in the diet was the Giant Water Bug with a mass of 0.2 g. The feeding strategy diagram for the South American Tern (N = 844 pellets) shows an accumulation of points in the lower left corner with a spread to the upper left and to the center of the graph (Fig. 3). According to the model, this demonstrates a situation in which there is a high between-phenotype contribution (BPC) to the niche width, which means that individual predators have specialized on different prey types, the Giant Water Bug, the Mole crab and the Argentine Anchovy. However, there is a clear dominance of the Argentine Anchovy but also many rare prey species. In general, the graph shows a mixed feeding strategy, with var ying levels of specialization and generalization on different prey types.. Sample fidelity Most of the species accumulation cur ves were uniform with around five to six expected species (Fig. 4). However, samples (one sample means the pool of pellets collected on one day) from July 2005 and September 2006 showed a trend to increase, indicating that. Fig. 2: Index of relative importance (IRI %) of the most important prey species in the South American Tern diet during 2005 and 2006 seasons. Índice de importancia relativa (IRI %) de las especies más importantes en la dieta del Gaviotín Sudamericano durante las temporadas 2005 y 2006.. Fig. 3: South American ter n´s feeding strategy diagram. EAN = E. anchoita, BEL = Bellostoma sp., AMA = A. marinii, EBR = E. brasiliensis, CGU = C. guatucupa. Diagrama de estrategia alimenticia del Gaviotín Sudamericano. EAN = E. anchoita, BEL = Bellostoma sp., AMA = A. marinii, EBR = E. brasiliensis, CGU = C. guatucupa..
(7) DIET AND PREY PREFERENCE OF THE SOUTH AMERICAN TERN. sample size (number of pellets collected per day) was insufficient. Those samples had lower number of pellets than the others: 27 in July and 40 in September. According to the shape of the curves, between 60 and 80 pellets would have been required to reach 60 to 100 % of the expected species richness. Nevertheless, depending on the species of prey ingested lower samples sizes could be enough. The sample of 5 August 2005 (161 pellets) showed the highest richness, caused by a great variety of insects consumed. In contrast, May 2006 (105 pellets) showed the lowest expected richness, due to the consumption of almost exclusively one species, the Mole crab.. 457. Temporal variation The Shannon diversity index was not significantly different between most of the samples from 2005 (Boot P < 0.05), while in 2006 the diversity of May and July were statistically different from the majority of the samples (Boot, P < 0.05) (Table 3). The low evenness and diversity of 5 August 2005 and May 2006 samples was due to the dominance in abundance of the Giant Water Bugs in August (44.5 % IRI) and the Mole crab in May (IRI % 99.9). September and June 2005 were also different from the others because of their high diversity and evenness of fish prey. During the 2005 season the N % of the Argentine Anchovy, Marini’s Anchovy and Striped Weakfish (CGU) was statistically different between samples (EAN, G = 67.865; AMA, G = 29.563; CGU, G = 7.977; df = 4 for EAN and AMA and df = 3 for CGU, P < 0.05 for all) (Fig. 5). However, in 2006 the proportion of fish consumed was uniform along the season (EAN, G = 1.997; AMA, G = 5.345; df = 2, P > 0.05 for both), although an increase in the abundance of the Striped Weakfish by the end of the season was clearly observed (G = 14.984, df = 2, P < 0.01) (Fig. 7). The main difference in the N % of fish consumed between years was the increase of the abundance of the Rough Scad (Trachurus lathami Nichols) and the South American Silverside (Odontestes argentinensis Valenciennes) in 2006 (Fig. 5).. DISCUSSION. Fig. 4: Rarefaction cur ves showing the expected richness for each group of pellets (sample) collected during the 2005 and 2006 seasons. Curvas de rarefacción mostrando la riqueza esperada para cada grupo de bolos (muestra) colectados durante las temporadas 2005 y 2006.. The diet of the South American Tern on the Rocha coast during the two studied seasons was mainly composed of the Argentine Anchovy followed by other species of fish, insects and crustaceans, as had already been obser ved on the nearby Atlantic coast of Buenos Aires Province by Favero et al. (2000). However, during each season the proportion of anchovies consumed was variable. Two other fish species, Marini’s Anchovy and Striped Weakfish, were also important in the diet, being occasionally found in the same or in higher proportions than the Argentine Anchovy. The distribution of the Argentine Anchovy along the coast of Argentina and Ur uguay varies throughout the year as a consequence of reproductive and feeding migrations, resulting in dif ferential distribution patter ns of age.
(8) 458. ALFARO ET AL.. classes (Ehrhardt et al. 1977, 1978, Hansen & Madirolas 1996). Those variations in Anchovy abundance are probably the cause of the variations obser ved in the diet of the terns between years and seasons. Many seabirds are generalist and opportunistic; consequently their diet correlates positively with the abundance of their prey (Montevecchi & Myers 1996, Furness & Camphuysen 1997). According to the feeding strategy diagram, the South American Tern has a mixed feeding strategy, which according to the approach by Amundsen et al. (1996) can be considered a generalist strategy but with dif ferent individuals specialized on dif ferent food types (Amundsen et al. 1996). Therefore, the consumption of prey other than the Anchovy could be the consequence of a combination between an increase in the abundance of the new prey, better accessibility to it and/or a decrease in the relative abundance of the Anchovy. Two other important species consumed by the South American Tern on the Rocha coast were the Giant Water Bug and the Mole crab. The consumption of insects and crustaceans found in some of the samples could be due to an elevated abundance of them in the area, but not necessarily due to a decrease in the Anchovy’s abundance. Many studies about the diet of Common Terns (Sterna hirundo Linnaeus) in the region also found large quantities of insects during certain periods (Mauco et al. 2001, Bugoni & Vooren 2004, Mauco & Favero 2004, Mauco 2006). In those cases the presence of insects in the diet has been explained by the effect of meteorological and/or biological factors which generate increases in their abundance (Mauco et al. 2001, Bugoni & Vooren 2004, Mauco & Favero 2004, Mauco & Favero 2005, Mauco 2006).. Mole crabs were previously recorded in the diet of gulls and terns (Mueller 1976, Blokpoel et al. 1989, Blokpoel et al. 1992). In fact, this feeding behavior is not unusual and occurs when there is an increase in the abundance of this crustacean species (Muller 1976, Blokpoel et al. 1989, Blokpoel et al. 1992). The preference for Mole crabs instead of fish is because they are easier to catch when they are abundant and they comprise a good quality meal (Mueller 1976). Studies about the Mole crab in Uruguay conclude that their reproductive cycle is complex and variable and depends on the physical characteristics of the environment where they live (Delgado & Defeo 2008). Periods of high abundance of this species have been detected mainly between February and April and less frequently between May to June (Delgado & Defeo 2006). Terns consumed Mole crabs in May 2006, suggesting high abundance of them around these dates. Rarefaction cur ves showed that samples from June 2005 and September 2006 did not reach the asymptote, indicating that the sample size at these days was insufficient. However, the number of pellets needed to reach the expected species richness of prey depends on the type of prey eaten, which varies between samples. On 5 August, if we had collected 80 pellets we could only had reached 60 % of the expected richness. However, this sample size is sufficient to reach the expected richness for most of the other samples collected. This rarefaction analysis showed two key points to take into account when developing diet studies; it is important to calculate how many pellets are needed to detect most of prey species, and it is necessary to collect samples throughout the season because of prey variability.. TABLE 3. Shannon’s diversity index and evenness from 2005 and 2006 samples. Índice de diversidad de Shannon y equitatividad para cada una de las muestras de 2005 y 2006.. 2005. Shannon H. Evenness. 2006. Shannon H. Evenness. Jun. 1.119. 0.5102. May. 0.1077. 0.2227. Jul. 0.8357. 0.3844. Jul. 1.511. 0.5664. Aug-05. 0.8923. 0.122. Aug. 1.296. 0.4568. Aug-16. 0.9995. 0.3881. Sep. 1.238. 0.4313. Sep. 1.382. 0.5689.
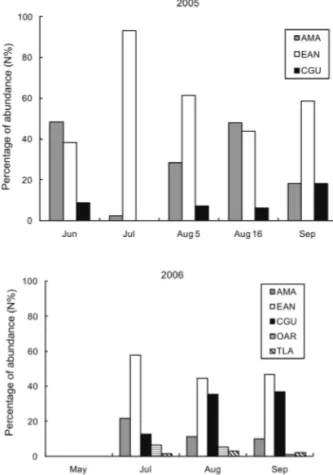
(9) DIET AND PREY PREFERENCE OF THE SOUTH AMERICAN TERN. Temporal variation in the diet of the South American Tern was mainly due to the ingestion of insects and crustaceans. This marked shift in the diet shows the ability of terns to quickly change their foraging strategy to exploit an occasional resource. Despite these few exceptions, the dominant species in the diet of South American Terns was the Argentine Anchovy. This result supports our hypothesis about the Anchovy as the main item in the diet of South American Terns in Uruguay, and also supports the hypothesis that terns follow the Anchovy’s migration and come from the tern breeding colonies in Patagonia. Recent studies about the diet of South American Terns in the reproductive areas in Patagonia also found the Argentine Anchovy as their main prey (Gatto & Yorio 2009). This study confirms that there. 459. is a strong predator-prey interaction between the South American Tern and the Argentine Anchovy throughout their distribution. ACKNOWLEDGMENTS: We thank Macarena Sarroca, Javier Lenzi, Andrea Lanfraconi, Martin Abreu, Héctor Caymaris, Verónica Correa, Graciela Fabiano, Orlando Santana and Olga Mora for their help during field work and logistics. Thanks to Daniel Naya, Matías Arim, Ariel Farías, Alejandro Brazeiro, Néstor Mazzeo, Leandro Bugoni l’Luciano Liguori and Pablo Yorio for their helpful suggestion and comments at different stages of the study. We also thank Armando Cicchino for insect’s identification. Programa para el Desarrollo de las Ciencias Básicas (PEDECIBA), Agencia Nacional de Investigación e Innovación (ANII) and Programa de Financiamiento de Centros de Excelencia en Investigación (FONDAPCONICYT, Chile) partially funded this research. Averaves, Idea Wild and the Dirección Nacional de Recursos Acuáticos (DINARA) collabored with equipment and logistics. Thanks to Rafael Tosi who helped with the English translation. We thank four independent reviewers who provided many constructive comments on the manuscript.. LITERATURE CITED. Fig. 5: Percentage of the monthly abundance (N %) of the most important fish species separated by samples during both seasons. AMA = A. marinii, EAN = E. anchoita, CGU = C. guatucupa, OAR = O. argentinensis, TLA = T. lathami. Porcentaje de abundancia (N %) mensual de las especies de peces más importantes separadas por muestra durante las dos temporadas. AMA = A. marinii, EAN = E. anchoita, CGU = C. guatucupa, OAR = O. argentinensis, TLA = T. lathami.. ALFARO M & M CLARA (2007) Assemblage of shorebirds and seabirds on Rocha Lagoon sandbar, Uruguay. Ornitología Neotropical 18: 421-432. AMUNDSEN PA, HM GALBER & FJ STALDVIK (1996) A new approach to graphical analysis of feeding strategy from stomach content data-modification of the Costello (1990) method. Journal of Fish Biology 48: 607-614. ANDERSON DW, F GRESS & K MAIS F (1982) Brown pelicans: Influence of food supply on reproduction. Oikos 39: 23-31. AZPIROZ AB (2003) Aves del Ur uguay. Lista e introducción a su biología y conservación. Aves Uruguay-GUPECA, Montevideo. BALDÁS MI, GP MACRI, AV VOLPEDO & DD ECHEVERRÍA (1997) Mor fología de la sagitta de peces marinos de la costa bonaerense de la Argentina I: Carangidae, Sciaenidae, Mullidae. Atlántica (Rio Grande) 19: 99-112. BARRETT R T, K(CJ) CAMPHUYSEN, T ANKERNILSSEN, JW CHARDINE, RW FURNESS et al. (2007) Diet studies of seabirds: A review and recommendations. ICES Journal of Marine Science 64: 1675-1691. BLOKPOEL H, DC BOERSMA, RA HUGHES & GD TESSIER (1989) Field observations of the biology of Common Terns and Elegant Terns wintering in Peru. Colonial Waterbirds 12: 90-97. BLOKPOEL H, DC BOERSMA, RA HUGHES & GD TESSIER (1992) Foraging by larids on sand crabs Emerita analoga along the coast of southern Peru. Ardea (Netherlands) 80: 99-104. BUGONI L (2001) Ecologia alimentar do Trinta-réis-boreal (Sterna hirundo) em sua área de invernagem do sul do Brasil. MSc. Thesis, Fundaçao Universidade Federal do Rio Grande – FURG. Rio Grande. BUGONI L & CM VOOREN (2004) Feeding ecology of the Common Tern Sterna hirundo in a wintering area in southern Brazil. Ibis 146: 438-453. BUGONI L & CM VOOREN (2005) Distribution and abundance of six tern species in southern Brazil. Waterbirds 28: 110-119..
(10) 460. ALFARO ET AL.. COUSSEAU MB & RG PERROTTA (2000) Peces marinos de Argentina. Biología, distribución y pesca. Instituto Nacional de Investigación y Desarrollo Pesquero, Mar del Plata. DELGADO E & O DEFEO (2006) A complex sexual cycle in sandy beaches: The reproductive strategy of Emerita brasiliensis (Decapoda: Anomura). Journal of the Marine Biological Association of the United Kingdom 86: 361-368. DELGADO E & O DEFEO (2008) Reproductive plasticity in mole crabs, Emerita brasiliensis, in sandy beaches with contrasting morphodynamics. Marine Biology 153: 1065-1074. DUFFY DC & S JACKSON (1986) Diet studies of seabirds: A review of methods. Colonial Waterbirds 9: 1-17. EHRHARDT NM, HC NION, HA CASTALDO & LC BAERA (1977) Evaluación preliminar de los recursos pelágicos del área común de pesca Argentino-Ur uguay 1975-1976. Repor t to the Instituto Nacional de Pesca, Montevideo. EHRHARDT NM, HC NION, HA CASTALDO & LC BAERA (1978) Evaluación preliminar de los recursos pelágicos del área común de pesca Argentino-Uruguay 1977. Report to the Instituto Nacional de Pesca, Montevideo. ESCALANTE R (1970) Aves marinas del Río de la Plata y aguas vecinas del Océano Atlántico. Barreiro y Ramos S. A., Montevideo. FAVERO M, MS BÓ, MP SILVA-RODRÍGUEZ & C GARCÍA-MATA (2000) Food and feeding biology of the South American Tern during nonbreeding season. Waterbirds (Waco, Texas) 23: 125-129. FREYRE LR & SM MOLLO (1987) Estudio biométrico para estimar el tamaño y peso de los peces a partir de la dimensiones de sus otolitos. Revista de la Asociación de Ciencias Naturales del Litoral 18: 145-154. FURNESS RW & K(CJ) CAMPHUYSEN (1997) Seabirds as monitors of the marine environment. ICES Journal of Marine Science 54: 726-737. GATTO AJ & P YORIO (2009) Provisioning of mates and chicks by Cayenne and Royal Terns: Resource par titioning in nor thern Patagonia, Argentina. Emu 109: 49-55. GOTELLI NJ & RK COLWELL (2001) Quantifying biodiversity: Procedures and pitfalls in the measurement and comparison of species richness. Ecology Letters 4: 379-391. HANSEN J (2000) Anchoíta Engraulis anchoita. In: Bezzi P, R Akselman & E Boschi (eds) Síntesis del estado de las pesquerías marítimas en Argentina y la cuenca del Plata. Años 1997-1998, con actualización 1999: 205-216. Instituto Nacional de Investigación y Desarrollo Pesquero (INIDEP), Mar del Plata. HANSEN J & A MADIROLAS (1993) Distribución, evaluación acústica y estr uctura poblacional de la Anchoíta. Resultados de las campañas del año 1993. Revista de Investigación y Desarrollo Pesquero10: 5-21. HANSEN JE & A MADIROLAS (1996) Distribución, evaluación acústica y estructura poblacional de la anchoíta, resultados de las campañas del año 1993. Revista Investigación y Desarrollo Pesquero 4: 21-48. HANSEN JE, A MADIROLAS & RG PERROTA (1996) Evaluación del efectivo bonaerense de anchoíta (Engraulis anchoita) entre las latitudes 34° y 38° Sur en el otoño de 1994. INIDEP (Argentina), Technical Report N° 8. Mar del Plata. Associate Editor: Martin Thiel Received December 21, 2010; accepted August 29, 2011. HAMMER O, D HARPER & PD RYAN (2001) PAST: Paleontological statistics software package for education and data analysis. Paleontologia Electronica 4: 1-9. MAR TÍNEZ V & G MONASTERIOS DE GONZO (1991) Clave de identificación de algunos peces siluriformes en base al estudio de sus otolitos. Revista de la Asociación de Ciencias Naturales del Litoral 22: 95-118. MAUCO L, M FAVERO & MS BÓ (2001) Food and feeding biology of the Common Tern (Sterna hirundo) during the nonbreeding season in Samborombon Bay, Buenos Aires, Argentina. Waterbirds 24: 89-96. MAUCO L & M FAVERO (2004) Diet of the Common Tern (Sterna hirundo) during the nonbreeding season in Mar Chiquita Lagoon, Buenos Aires, Argentina. Ornitología Neotropical 15: 1-9. MAUCO L & M FAVERO (2005) The food and feeding biology of Common Terns wintering areas in Argentina: Influence of environmental conditions. Waterbirds 28: 450-457. MAUCO L (2006) Ecología trófica del gaviotín golondrina (Sterna hirundo) en la Provincia de Buenos Aires, Argentina. PhD. Tesis, Universidad Nacional de Mar del Plata, Mar del Plata. MONTEVECCHI WA & RA MYERS (1996) Dietar y changes of seabirds indicate shifts in pelagic food webs. Sarsia 80: 313-322. MUELLER HC (1976) Common Terns feeding on mole crabs. The Wilson Bulletin 88: 675-676. NION H & C RÍOS (1991) Los recursos pelágicos del Uruguay. Atlántica 13: 201-214. SÁNCHEZ RP & JD DE CIECHOMSKI (1995) Spawning and nurser y grounds of pelagic fish species in the sea-shelf off Argentina and adjacent areas. Scientia Marina 59: 455-478. SACCARDO SA, MC CERGOLE & C MASUMOTO (2005) Trachur us lathami. In: Cergole MC, AO Ávila-da-Silva & CL Del Bianco RossiWongtschwski (eds) Análise das principais pescarias comerciais da região Sudeste-Sul do Brasil: Dinâmica populacional das espécies em esplotação: 156-161. Instituto Oceanográfico-USP, Score Sul, São Paulo. SCHAFFNER FC (1986) Trends in Elegant Tern and Nor ther n Anchovy populations in Califor nia. Condor 88: 347-354. SHEALER DA (2002). Foraging behavior and food of seabirds. In: Schreiber EA & J Burger (eds) Biology of marine birds: 137-177. CRC Press, New York. SILVA RODRÍGUEZ MP, M FAVERO, MP BERÓN, R MARIANO-JELICICH & L MAUCO (2005) Ecología y conser vación de aves marinas que utilizan el litoral bonaerense como área de invernada. Hornero 20: 111-130. SOKAL RR & FJ ROHLF (1987) Introduction to biostatistics. W. H. Freeman, New York. TORNO AE (1970) Descripción y comparación de los otolitos de algunas familias de peces de la plataforma Argentina. Revista del Museo Argentino de Ciencias Naturales Ber nardino Rivadavia 7: 3-20. VOLPEDO AV & DD ECHEVERRÍA (1997) Catálogo y claves de otolitos para la identificación de peces del mar Argentino. 1) Peces de impor tancia económica. Editorial Dunken, Buenos Aires..
(11)
Figure


Documento similar
In the preparation of this report, the Venice Commission has relied on the comments of its rapporteurs; its recently adopted Report on Respect for Democracy, Human Rights and the Rule
On the other hand at Alalakh Level VII and at Mari, which are the sites in the Semitic world with the closest affinities to Minoan Crete, the language used was Old Babylonian,
Abstract: Transepidermal water-loss (TEWL), stratum-corneum hydration (SCH), erythema, elas- ticity, pH and melanin, are parameters of the epidermal barrier function and
The main goal of this work is to extend the Hamilton-Jacobi theory to different geometric frameworks (reduction, Poisson, almost-Poisson, presymplectic...) and obtain new ways,
The paper is structured as follows: In the next section, we briefly characterize the production technology and present the definition of the ML index as the geometric mean of
In the previous sections we have shown how astronomical alignments and solar hierophanies – with a common interest in the solstices − were substantiated in the
Díaz Soto has raised the point about banning religious garb in the ―public space.‖ He states, ―for example, in most Spanish public Universities, there is a Catholic chapel
teriza por dos factores, que vienen a determinar la especial responsabilidad que incumbe al Tribunal de Justicia en esta materia: de un lado, la inexistencia, en el
