Research Article
Open Access
Shahriar Ghamami, Sanaz Kazemzade Anari, Masome Bakhshi, Amir Lashgari,
Guillermo Salgado-Morán, Daniel Glossman-Mitnik*
Preparation and Characterization of Cerium (III)
Doped Captopril Nanoparticles and Study of their
Photoluminescence Properties
DOI: 10.1515/chem-2016-0008
received June 1, 2015; accepted January 30, 2016.
Abstract: In this research Ce3+ doped Captopril
nanoparticles (Ce3+ doped CAP-NP) were prepared by a
cold welding process and have been studied. Captopril may be applied in the treatment of hypertension and some types of congestive heart failure and for preventing kidney failure due to high blood pressure and diabetes. CAP-NP was synthesized by a cold welding process.The cerium nitrate was added at a ratio of 10% and the optical properties have been studied by photoluminescence (PL). The synthesized compounds were characterized by Fourier transform infrared spectroscopy. The size of CAP-NP was calculated by X- ray diffraction (XRD). The size of CAP-NP was in the range of 50 nm. Morphology of surface of synthesized nanoparticles was studied by scanning electron microscopy (SEM). Finally the luminescence properties of undoped and doped CAP-NP were compared. PL spectra from undoped CAP-NP show a strong pack in the range of 546 nm after doped cerium ion into the captopril appeared two bands at 680 and 357 nm, which is ascribed to the well-known 5d–4f emission band of the cerium.
Keywords: Doped,Ce3+, Photoluminescence, Caporal,
SEM, XRD
1 Introduction
Particles that have size between 1 and 100 nanometers are called nanoparticles [1]. Nanoparticles have a large surface per volume ratio. These properties lead to the use of nanoparticles in many applications such as medicine, electronics, etc. [2].
Captopril is an orally active drug and a member of a class of drugs called angiotensin converting enzyme (ACE) inhibitors. ACE inhibitors are another family of antihypertensive drugs that decrease the levels of angiotensin II in the human body. This enzyme is responsible for the conversion of angiotensin I (ATI) to angiotensin II (ATII). AT II regulates blood pressure and is a key component of the renin-angiotensin-aldosterone system (RAAS) [3,4,5]. Captopril is also the only drug that includes sulfhydryl group. Its chemical formula is following: 1-[(2S)-3-mercapto-2-methylpropionyl]-L proline [6,7].
Renin is an enzyme that is synthesized by the kidneys and is released into the blood stream wherever it stirs on a plasma globulin to supply angiotensin. Then by ACE it is converted to angiotensin II. Captopril, by inhibiting ACE, prevents the conversion of angiotensin I to angiotensin II. Therefore ACE inhibition results in reduced angiotensin II and enhanced plasma renin activity (PRA) [8-10]. Captopril is used in the management of high blood pressure (hypertension), congestive heart failure, kidney problems caused by diabetes and it improves survival after a heart attack [11].
Cerium nitrate is the cheapest and most abundant source of cerium. Cerium nitrate is an effective antibacterial substance against a range of bacteria, such as Staphylococcus aureus and Escherichia coli [12-14]. In this research, Ce3+ doped CAP-NP were synthesized by
a cold welding process and its features were investigated. The CAP-NPs were analysed by FT- IR spectroscopy and X-ray diffraction (XRD) was undertaken to determine the CAP-NP size, using the Debye-Scherrer formula. CAP-NP
*Corresponding author: Daniel Glossman-Mitnik: Laboratorio Virtual NANOCOSMOS, Departamento de Medio Ambiente y Energía, Centro de Investigación en Materiales Avanzados (CIMAV), Chihuahua, Chih 31136, México,E-mail: [email protected]
Shahriar Ghamami, Sanaz Kazemzade Anari, Masome Bakhshi: Department of Chemistry, Faculty of Science, Imam Khomeini International University, Qazvin, Iran
Amir Lashgari: Department of Chemistry, Faculty of Science, Imam Khomeini International University, Qazvin, Iran
size was calculatedfrom the full width at half maximum (FWHM) which was found to be approximately 34 nm. The morphology of CAP-NP and Ce3+ doped CAP-NP were
investigated by scanning electronic microscopy (SEM). The PL spectra from Ce3+ doped CAP-NP shows two broad
bands at 680 and 357 nm, which are assigned to the Ce3+
ion transiting from the 5d level to the 4f ground states, then compared with undoped CAP-NP and Ce(NO3)3.
2 Experimental
2.1 Materials and instruments
Captopril was received as gift samples from the Iran Drug Company. Captopril drug was produced as an active substance and without impurities. Ce (NO3)3 with a purity of 98.5% was purchased from Merck. CAP-NP was prepared by ball milling (satellite “Pulverisette 7 classic line” (Fritsch GmbH, Germany). The surface of the product was characterized by scanning electron microscopy (SEM) model AIS2100 from Soren technology and prior to analysis the sample was covered by thin layers of gold. A Philips X-pert x-ray diffractometer with Cu Kα (λ = 1.54 Å) radiation was used to study the CAP-NPs at room temperature. Emission spectra of Ce3+ doped
CAP-NP and CAP-NP were collected using a fluorescent spectrophotometer (Cary Eclipse 4000) at excitation wavelength of 274 nm.
2.2 Synthesis of Ce
3+doped CAP-NP
To prepare the nanoparticles, 5 g of captopril drug were ball-milled at 180 RPM in an iron jar for 15 hours at an optimum weight ratio of ball to powder. The CAP-NP was kept in the dark glass to avoid any decomposition reactions. Then 10% Ce(NO3)3 was added to the CAP-NP and they were ball-milled at 180 RPM for a further 5 hours.
2.3 Characterization of CAP-NP and Ce
3+doped CAP-NP
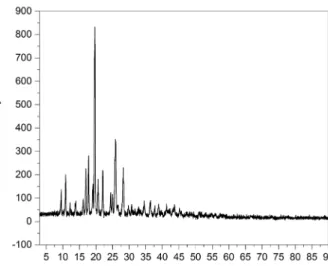
X-ray diffraction (XRD) was used to determine the CAP-NP size by using the FWHM obtained from the largest peak (Fig. 1). (Due to the low amount of cerium as the doping agent, XRD spectra showed no change after doping cerium to captopril so presence of cerium examined
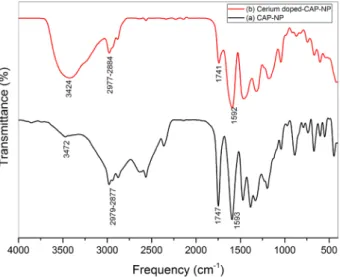
with photoluminescence spectra). FTIR has been used to investigate possible interactions of functional groups between CAP-NP and Ce3+ doped CAP-NP in the range
400 to 4000 cm-1 (Fig. 2). Morphology of CAP-NP and Ce3+
doped CAP-NP were investigated using scanning electron microscopy (SEM) – Figs. 3a and 3b. PL spectra of Ce3+
doped CAP-NP and CAP-NP shows bands at 680 and 357 nm compared to Ce(NO3)3 PL spectra, as shownin Fig. 4.
3 Results and Discussion
3.1 Powder X-ray diffraction
(XRD)
Fig. 1 shows the XRD pattern of CAP-NP prepared by the planetary high-energy ball mill process. According to the results of X-ray diffraction the size of the CAP-NP nanoparticles was calculated from the full width at half maximum (FWHM) technique using Scherer’s formula. D = K λ/(β cos θ) where K is the constant (0.99), λ is the wavelength of Cu-Kα (1.54 Å) line, β is the FWHM and θ is the diffraction angle. Size of CAP-NP obtained in the range of 34 nm.
d = K λ/(β cos θ)
FWHM = 0.2548 β = 0.00444 cos θ = 0.97
2θ = 19.6770 D = 34.68 nm
X-ray diffractionpeaks are much broader when particle size is smaller than 100 nm. CAP-NP has a crystalline structure, and exhibits additional sharper peaks around 2θ = 19.67°.
3.2 Analysis of Fourier transform infrared
spectroscope
(FTIR)
We reported the synthesis of Ce3+ doped CAP-NP and it
was confirmed by FT-IR (Fig. 2b). The Ce3+ doped CAP-NP
were studied and compared to CAP-NP in the range of
400 to 4000 cm-1, Fig. 2a. In the CAP-NP, the peaks at 2979
and 2877 cm-1 were assigned to the asymmetric CH 3 and
CH2 stretching vibration, and the peak at 2634 cm-1 was
due to the symmetric CH3 stretching mode. The peak at 2567 cm-1 corresponded to the SH stretching vibration [15].
The peaks at 1747 and 1593 cm-1 were assigned to the C=O
stretching vibration of carboxylic acid and amide band, respectively. The peaks at 1471 and 1385 cm-1 were due to
the asymmetric and symmetric CH3 bending vibrations, respectively. The peak at 1330 cm-1 was assigned to the
OH bending vibration. The peaks at 1228–1200 cm-1 also
corresponded to the C-O and/or CN stretching vibrations [16,17]. The peak at 3424−3474 cm-1 assigned to the O-H
stretching vibration. This peak was broad because of the presence OH bond of Ce(NO3) × 6H2O in Fig. 2b and compared with CAP-NP in Fig. 2a that indicated that there were some changes in the structure due to the presence of cerium.
Figure 2: FT-IR spectrum of a) CAP-NP and b) Ce3+ doped CAP-NP.
3.3 Scanning electron microscopy (SEM
)
SEM was used to investigate solid state of physical structure of the prepared NP. Fig. 3a is a SEM image of the CAP-NP that confirmed the surface morphology is similar to the spherical particles with a uniform distribution. Due to the high surface energy of the fine particles being created, particles have stuck together and formed agglomerates. The spherical morphology obtained by cold welding process is similar to the morphology obtained by the co-precipitation method [18]. Fig. 3b is a SEM image of the Ce3+ doped CAP-NP that confirmed the surface morphology
is similar to the spherical particles with some of particles showing an irregular edged shape. There is a considerable agglomeration of particles. Presence of cubic structure among the accumulated spherical particles of CAP-NP has been identified.
3.4 Photoluminescence (PL) Results
Cerium is a three valent mineral material and has a 4f 1 5d0
ground state and a 4f 0 5d 1 first excited state. The ground
state of Ce 3+ split in two sub bands of 2F
5/2 and 2F7/2.
Emission from Ce3+ is according to dipole transition of
4f-5d, which has a permitted parity and spin with a fairly strong vibration force [19-21].
PL spectra from Ce3+ doped CAP-NP were recorded
at room temperature with 274 nm excitation, shown in Fig. 4a. There are two UV and visible emissions at 357 and 680 nm, which is ascribed to the well-known
5d–4f emission band of the cerium ion. The intense peak at 680 nm can be assigned to the 5D0–7F0 transition. The PL broad band at 357 nm is due to the cerium ion transitions
2D
3/2–2F5/2 and 2D3/2–2F7/2 [22]. Also a strong peak in 547 nm
that is characterized by CAP-NP. However, these features were not able to be detected from undopped captopril (Fig. 4b). Comparison of the spectra shows that these features are related to the Ce 3+ luminescence centers
present in the doped material. Due to the presence of cerium in captopril crystalline structure the cerium emission intensity increased. The PL spectra of Ce3+ doped
CAP-NP and CAP-NP and Ce(NO3)3 are compared in Fig. 4.
4 Conclusions
In summary, the synthesis and characterization of Ce3+ doped CAP-NP has been described. The molecular
structure of the nanoparticles and their functional group was confirmed by FT-IR spectra. SEM images of the Ce3+ doped CAP-NP and CAP-NP confirmed the surface
morphology was similar to the spherical particles with agglomerates. Also the size of nanoparticles was indicated by X-ray diffraction method for CAP-NP. According to photoluminescence properties of transition metals, the presence of a small amount of cerium in CAP-NP have luminescence that shows sharp broad band’s at 357 and 680 nm, which is ascribed to the well-known 5d–4f emission band of the cerium ion.It is expected that this photoluminescence can be used in the tracking the drugs in the body or potentially used to follow release of the drug in the body and the mechanism of its effect on the body [23].
Acknowledgements: The authors of the Imam Khomeini International University, Qazvin, for financing this research are appreciated. DGM is a researcher of CIMAV and CONACYT, and acknowledges partial support from both institutions.
References
[1] Module, E.P.A., 3: Characteristics of particles-particle size categories.
[2] Roduner, E., Size matters: why nanomaterials are different. Chem. Soc. Rev., 2006, 35(7), pp. 583-592.
[3] Armayor, G.M. and Lopez, L.M., Lisinopril: a new angiotensin-converting enzyme inhibitor. Drug Intel Clin Phar, 1988, 22(5), pp. 365-372.
[4] Nelson, E.B., Pool, J.L., Taylor, A.A., Pharmacology of
angiotensin converting enzyme inhibitors: A review. Am J Med, 1986,81(4), pp. 13-18.
[5] Ng, K.K.F., Vane, J.R., Some properties of angiotensin converting enzyme in the lung in vivo. Nat, 1970, 225, pp. 1142-1144.
[6] Kitamura, K., Aihara, M., Osawa, J., Naito, S., Ikezawa, Z., Sulfhydryl drug‐induced eruption: A clinical and histological study. The Journal of Dermatology, 1990, 17(1), pp. 44-51. [7] Sako, G. and Elin, R.J., Spurious ketonuria due to captopril
and other free sulfhydryl drugs: Proposed changes in current guidelines for urine ketone testing in diabetic patients. Diabetes Care J, 1996, 19(6), pp. 673-674.
[8] Mets, B., The renin-angiotensin system and ACE inhibitors in the peri-operative period. Baillière‘s Clinical Anaesthesiology, 1997, 11(4), pp. 581-604.
[9] Brown, N, Vaughan, D, Cardiovascular drugs: angiotensin-converting enzyme inhibitors. Circulation,1998, 97, 1411–1420. [10] Ng, K.K.F., Vane, J.R., Conversion of angiotensin I to
angiotensin II. Nature 1967, 216(5117), pp. 762-766. [11] Schatz, P.L., Mesologites, D., Hyun, J., Smith, G.J., Lahiri, B.,
Captopril-induced hypersensitivity lung disease. An immune-complex-mediated phenomenon. CHEST Journal, 1989, 95(3), pp. 685-687.
[12] Sotogaku, N. R., Hirunuma, K., Endo, S., Enomoto, S., Ambe, F., Studies of the binding of various trace elements to blood components and serum proteins by means of the multitracer technique, J. Inorg. Biochem., 1997, 67(1-4), pp. 23. [13] Chen, C., Zhang, P., Chai, Z., Distribution of some rare earth
elements and their binding species with proteins in human liver studied by instrumental neutron activation analysis combined with biochemical techniques, Anal. Chim. Acta., 2001, 439(1), pp. 19.
[14] Popovici, R.F., Alexa, I.F., Novac, O., Vrinceanu, N., Popovici, E., Lupusoru, C.E., Voicu, V.A., Pharmacokinetics study on mesoporous silica-captopril controlled release systems. Digest J. Nano. 2011, 6(3), pp. 1619-1630.
[15] Huang, Y., Wei, T., Ge, Y., Preparation and characterization of novel Ce (III)‐gelatin complex, J. Appl. Polym. Sci., 2008, 108(6), pp. 3804.
[16] Jankovics, H., Pettinari, C., Marchetti, F., Kamu, E., Nagy, L., Troyanov, S., & Pellerito, L. Characterization of diorganotin (IV) complexes with captopril. The first crystallographically authenticated metal complex of this anti-hypertensive agent. J. Inorg. Biochem., 2003, 97(4), pp. 370-376.
[17] Smith, B.C. Infrared spectral interpretation: A systematic approach. CRC Press, 1998.
[18] Alexa, I.F., Popovici, R.F., Ignat, M., Popovici, E., Voicu, V.A., Non-toxic nanocomposite containing captopril intercalated into green inorganic carrier, Dig J Nanomater Biostructures, 2011, 6(3), pp. 1091-1101.
[19] Blasse, G, Grabmaier, B. C, & Grabmaier, B. C. 1994, Luminescent materials (Vol. 44). Berlin: Springer-Verlag. [20] Takahashi, H., Yonezawa, S., Kawai, M., Takashima, M.,
Preparation and optical properties of CeF3-containing oxide fluoride glasses, J. Fluorine Chem, 2008, 129(11), pp. 1114-1118. [21] Li, L., Liang, H., Tian, Z., Lin, H., Su, Q., Zhang, G.,
Luminescence of Ce3+ in different lattice sites of La2CaB10O19. J. Phys. Chem. C, 2008, 112(35), pp. 13763-13768.
[22] Patra, A. and Ganguli, D., Paramagnetic centers in unirradiated boron-doped silica gel. J. Non-Cryst. Solids, 1992,144, pp. 111-113.