The marine microalga
Chlorella stigmatophora
as a potential
source of single cell protein: Enhancement of the protein content
in response to nutrient enrichment
Jaime Fábregas, Concepción Herrero, Julio Abalde, Buenaventura Cabezas
Departamento de Microbiologia, Universidad de Santiago de Compostela, Santiago de
Compostela, Spain
Journal of Industrial Microbiology, December 1986, Volume 1, Issue 4, pp 251-257
How to cite
Fabregas, J., Herrero, C., Abalde, J., and Cabezas, B. 1986. The marine
microalga Chlorella stigmatophora as a potential source of single cell protein: Enhancement of the protein content in response to nutrient enrichment. Journal
of Industrial Microbiology 1(4):251–7
The final publication is available at Springer http://dx.doi.org/10.1007/bf01569279
Summary
Mass cultures of Chlorella stigmatophora were carried out in order to obtain maximum protein production and to study the chemical variations in function of the
nutrient concentration. Cultures reached maximum cellular densities of 2.2·108 cells/ml,
with a growth velocity between 0.49 and 0.55 doublings/day. Carbohydrate content in
the stationary phase ranged between 2.23 and 2.74 pg/cell, RNA between 0.78 and 1.36
pg/cell and DNA between 0.013 and 0.016 pg/cell. The maximum value for chlorophyll
a was 0.13 pg/cell. Maximum protein content was obtained with a nutrient concentration of 16 mM of NaNO3, giving 4.85 pg/cell and a protein concentration of
showing differences up to a 9.2-fold increase. This characteristic makes Chlorella stigmatophora a suitable source of single cell protein.
Keywords
Single cell protein; Chlorella; Microalgae; Aquaculture
INTRODUCTION
Microorganisms are useful as food for human consumption, in the production of
chemicals and in the bioconversion of solar energy [8,11]. Biomass production of
microalgae was focused largely on a few freshwater species. Currently most of the
microalgae used as food are from the eukaryotic Chlorophyta or are prokaryotic blue-green algae. Almost exclusively these include Scenedesmus, Chlorella and Spirulina
[2,10,19]. Among microalgae, the genus Chlorella includes a great number of freshwater species, while there are only a few marine species; one of these marine
species is Chlorella stigmatophora. Interest in algal biomass production has now spread to include marine and stuarine species as well [5,6,21]. C. stigmatophora has been reported as a good source of single cell protein (SCP) [3]. Mass culture of the organism
and improved knowledge of its composition, growth and chemical variability will
enable its better use and the obtention of high algal yields.
We report here the response of a mass culture of C. stigmatophora to a series of nutrient concentrations, studying its chemical composition during the logarithmic and
stationary phases. We estimate its biochemical variability, since this variability can
affect its nutritive and commercial value when this species is used as SCP.
MATERIALS AND METHODS
The marine microalga C. stigmatophora was obtained from The Culture Centre of Algae and Protozoa, Cambridge, U.K. It was cultured in 0.45 µm filtered seawater,
citrate, 20 µM; thiamine, 35 µg/l; biotin, 5 µg/l; B12, 3 µg/l; EDTA, 26.4 µM; Tris-HCI,
5 mM. Salinity of the seawater was 35‰ and the initial pH of the cultures was 7.6.
The nutrient solution with the composition given above was the first to be used.
From this we followed a geometrical progression, using concentrations corresponding to
4, 8 and 16 mM of NaNO3. Nutrient concentrations are expressed as NaNO3
concentrations, but all the other nutrients were proportionally increased.
Mass cultures were carried out in 10 l flasks containing 9 l of culture medium [5].
An inoculum of 6·106 logarithmic phase cells/ml was used. Cultures had air
continuously bubbled through them at a rate of 15 l/min.
Cellular density was determined by counting culture aliquots in a Thoma
chamber.
Cell volume was calculated by measuring the diameter of a significant number of
cells under the microscope and assuming the cell to be spherical.
Chlorophyll a was determined spectrophotometrically [7,18]. After obtaining the crude extracts [5], protein was measured by the dye-binding method [1] and
carbohydrates by the phenol-sulphuric acid method [12]. Nucleic acids were extracted
and determined as described by Kochert [13].
Stationary phases were compared by an overall multivariate one-way analysis of
variance and logarithmic phases were compared by an overall multivariate one-way
analysis of covariance.
A multiple non-linear least-squares regression of order 4 was applied to the
growth curve. The resultant equation was as follows:
f(t) = a + bt + ct2 + ct3 + et4
where f(t) is cellular density, t is time in days, and a, b, c, d and e are the coefficients of the equation.
From the growth equation we calculated doublings/day:
where tiand tnare the initial and final timeof the logarithmic phase, both expressed
in days, and tdis the duplication time.
RESULTS AND DISCUSSION
Culture conditions were established in order to produce maximum biomass to
obtain protein. Cultures were illuminated with 11 fluorescent lamps, six under the
culture vessels and five beside them, giving 6500 and 5500 lux, respectively, in order to
maintain light in saturation. In our growing system the air flow of 15 l/min maintained a
transference of CO2 to the culture medium that kept the pH below 8.4.
Plotting cellular density, protein (µg/ml), chlorophyll a (µg/ml) and carbohydrates (µg/ml) against time for each nutrient concentration, we obtained three-dimensional
figures (Figs. I, 2, 3, 4). Statistical treatment of these data is represented in Table 1.
From the equation calculated, we can establish the growth kinetics for each culture and
predict the growth of the micro algal population. The values of a, b, c, d and e are presented in Table 2. From this equation we calculated doublings/day or the inverse of
the duplication time (td-1). The initial time (ti) and final time (tn) of the logarithmic phase were established for each nutrient concentration (Table 1).
Fig. 1. Growth of C. stigmatophora at
different nutrient concentrations, expressed as
NaNO3 concentrations.
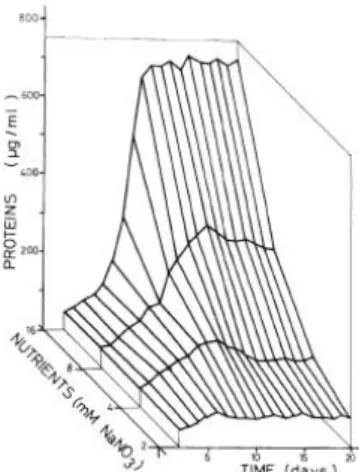
Fig. 2. Protein concentration in mass cultures
of C. stigmatophora at different nutrient
concentrations, expressed as NaNO3
Fig. 3. Chlorophyll a concentration in mass
cultures of C. stigmatophora at different
nutrient concentrations, expressed as NaNO3
concentrations.
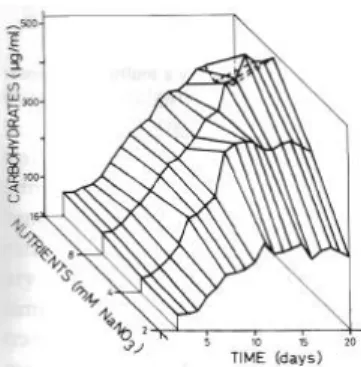
Fig. 4. Carbohydrate concentration in mass
cultures of C. stigmatophora at different
nutrient concentrations, expressed as NaNO3
concentrations.
After a lag phase of 4-5 days the cells entered into exponential growth, which
lasted between 4 and 12 days. Optimal nutrient concentration to produce a maximum
cellular density was 8 mM of NaNO3, which gave 225·106 cells/ml (Fig. 1). Statistically
this value is significantly higher (P < 0.001) than those obtained with the remaining nutrient concentrations. Cellular density increased as nutrient concentration increased to
8 mM of NaNO3; the highest nutrient concentration produced a decrease in the cellular
density. A nutrient concentration of 2 mM of NaNO3 is commonly used for culturing
marine microalgae [15].
The maximum growth velocity of C. stigmatophora cultures in the logarithmic phase was between 0.49 and 0.55 doublings/day (Table 1). The growth velocities were
very similar in all the cultures and similar to those obtained in cultures of Tetraselmis suecica and Isochrysis galbana under the same conditions [5,6].
Maximum cellular volumes were obtained at 2 and 16 mM of NaNO3 with mean
At the end of the culture period the protein content had reached maximum values
of 701 µg/ml and 4.85 pg/cell with a nutrient concentration of 16 mM NaNO3 (Tables 1
and 3). This means a protein concentration of 0.7 g/l of culture, which constitutes an
important quantity for using this marine micro alga as a SCP source. The protein
content of the cultures increased in proportion to nutrient concentration and differences
as great as a 9.2-fold increase can be observed. These differences in the protein content
are more acute than those found in other microalgae such as Dunaliella salina grown in different culture media, nitrate or glutamine [14], or T. suecica and I. galbana with different nutrient concentrations [5,6]. Maximum protein content and maximum cellular
density occurred at different nutrient concentrations, but changes in the protein content
are not necessarily related to cellular density in the culture medium because the
biochemical composition of microalgal cells may change within more or less narrow
limits depending on environmental action [5, 6, 20]. During the logarithmic phase the
protein/ cell ratio was independent of the nutrient concentration (Table 3). Differences
in the protein/cell ratio appear when the cultures entered into stationary phase. In this
phase, protein/cell content was similar for the cultures with lower nutrient
concentrations, increasing with higher concentrations, mainly with 16 mM of NaNO3.
The protein/carbohydrate ratio ranged between 0.33 and 1.77 in the stationary
phase and between 0.97 and 1.76 in the logarithmic phase (Table 3). These ratios were
similar to those found for other micro algae [9,16,17].
Protein/chlorophyll a ratios ranged between 26.65 and 37.30 in the stationary phase and between 18.00 and 34.36 in the logarithmic phase (Table 3). These ratios are
The protein/RNA ratio was practically constant during the logarithmic phase,
whereas this ratio increased with the nutrient concentration in the stationary phase.
The efficiency of nitrogen transformation was independent of the nutrient
concentration, with values between 49 and 53% (Fig. 5). We established this efficiency
as the ratio between the nitrogen added in nitrate form to the culture medium and the
protein nitrogen produced per culture. This means that the inorganic nitrogen is not
entirely transformed into protein nitrogen by the cells. Protein content per cell and per
ml increased proportionally to nutrient concentration in the stationary phase and this
may be due to the inclusion in the culture medium of a limiting factor for the growth or
for the protein synthesis. A more exact adjustment of the composition of the culture
medium would allow better cellular metabolism, providing improved nutrient
utilization. This would diminish the costs of production and produce better yields. By
altering the culture medium composition of mass cultures of C.stigmatophora it may be possible not only to obtain high algal yields, but also to transfer this food efficiently to
higher components of the food chain so as to maximize the conversion of dissolved
nutrients into biomass of commercially important marine food crops.
Fig. 5. Cellular density and chemical composition of C. stigmatophora in the stationary
phase, at different nutrient concentrations. (⋆) cells/ml; () protein/cell; (△) carbohydrates/cell; (■) chlorophyll a/cell; (▲) RNA/cell; (○ ) DNA/cell; (●) efficiency
(nitrate-N/protein-N transformation rate).
Chlorophyll aK increased with the nutrient concentration and the maximum value of 17.5 µg/ml occurred at 16 mM of NaNO3. Chlorophyll a/cell was constant in the logarithmic phase for all the nutrient concentrations and in the stationary phase for 2, 4
and 8 mM NaNO3, showing a maximum value of 0.13 pg/cell at 16 mM NaNO3 (Tables
Maximum carbohydrate concentration in the stationary phase occurred at 8 mM of
NaNO3 being 511.6 µg/ml. This nutrient concentration gave also the maximum values
of biomass (cells/ml). The carbohydrate/cell ratio was constant in both phase' and at all
nutrient concentrations, with values between 2.03 and 2.74 pg/cell (Table 3).
RNA/cell concentrations were constant in the logarithmic phase, and in the
stationary phase they ranged between 0.78 and l.36 pg/cell, tending to increase with the
nutrient concentration.
DNA/cell concentrations were constant at all the nutrient concentrations assayed
and in both growth phases. DNA contents of C. stigmatophora cells ranged from 0.013 to 0.020 pg/cell.
It has been shown that the protein content of C. stigmatophora cultures can be manipulated by changes in the nutrient concentration, showing differences of up to a
9.2-fold increase in the stationary phase. Chlorophyll a, carbohydrate and RNA content also varies, but differences are lower. C. stigmatophora has been suggested as a mineral source in fish diets [4]. The protein of C. stigmatophora is of good biological value and because of this it has been suggested as a potential source of SCP [3] . The protein
concentration obtained (0.7 g/l) and the possibility of manipulating its chemical
composition enhance these possibilities, making C. stigmatophora a potentially interesting source of SCP, including a marine species of this genus among the Chlorella
sources of protein.
ACKNOWLEDGEMENTS
Thanks are due to the technicians M. Garcia Saavedra, A. Barrero Vazquez and A.
Fernandez Jover. This work was supported by a grant of Direccion General de
Ordenacion Pesquera, Ministerio de Agricultura, Pesca y Alimentaci6n, Madrid, Spain.
REFERENCES
1. Bradford, M. 1976. A rapid and sensitive method for the quantitation of microgram
quantities of protein utilizing the principle of protein dye-binding. Anal. Biochem. 72:
248–254.
2. Ciferri, O. 1983.Spirulina, the edible microorganism. Microbiol. Rev. 47(4): 551–578.
3. Fabregas, J. and C. Herrero. 1985. Marine microalgae as a potential source of single cell
protein (SCP). Appl. Microbiol. Biotechnol. 23: 110–113.
4. Fabregas, J. and C. Herrero. 1986. Marine microalgae as a potential source of minerals
in fish diets. Aquaculture 51: 237–243.
5. Fabregas, J., C. Herrero, B. Cabezas and J. Abalde. 1985. Mass culture and biochemical
variability of the marine microalgaTetraselmis suecica(Kylin) Butch with high nutrient
concentrations. Aquaculture 49: 231–244.
6. Fabregas, J., C. Herrero, B. Cabezas and J. Abalde. 1986. Biomass production and
biochemical composition in mass cultures of the marine microalgaIsochrysis
galbana Parke at varying nutrient concentration. Aquaculture 53: 101–113.
7. Fabregas, J., C. Herrero and M. Veiga. 1984. Effect of oil and dispersant on growth and
chlorophyll a content of the marine microalgaTetraselmis suecica. Appl. Environ.
Microbiol. 47(2): 445–447.
8. Goldman, J.C. 1979. Outdoor algal mass cultures. I. Applications. Water Res. 13: 1–9.
9. Hitchcock, G.L. 1980. Diel variation in chlorophyll a , carbohydrates and protein
content of the marine diatom Skeletonema costatum. Mar. Biol. 57: 271–278.
10. Hwang, W.J., H.H. Wang and C.Y. Lii. 1980. Studies on some physicochemical
properties of commercial cultivatedChlorella powder. In: Algae Biomass. Production
and Use (Shelef, G. and C.J. Soeder, eds.), pp. 687–696, Elsevier North Holland
Biomedical Press, Amsterdam.
11. Kharatyan, S.G. 1978. Microbes as food for humans. Annu. Rev. Microbiol. 32: 301–
327.
12. Kochert, G. 1978a. Carbohydrate determination by the phenol-sulphuric acid method.
In: Handbook of Phycological Methods. Physiological and Biochemical Methods
(Hellebust, J.A. and J.S. Craigie, eds.), pp. 95–97, Cambridge University Press,
London.
13. Kochert, G. 1978b. Quantitation of the macromolecular components of microalgae. In:
Handbook of Phycological Methods. Physiological and Biochemical Methods
(Hellebust, J.A. and J.S. Craigie, eds.), pp. 189–195, Cambridge University Press,
14. Kosmakova, V.E. and L.T. Prozumenshchicova. 1983. Growth and biochemical
composition of the algaeDunaliella salina andPlatymonas viridisfed on organic and
inorganic nitrogen. Biol. Morya 1: 42–46.
15. McLachlan, J. 1964. Some considerations on the growth of marine algae in artificial
media. Can. J. Microbiol. 10: 769–782.
16. Myklestad, S. 1974. Production of carbohydrates by marine planktonic diatoms. I.
Comparison of nine different species in culture. J. Exp. Mar. Biol. Ecol. 15: 261–274.
17. Parsons, T.R., K. Stephens and J.D.H. Strickland. 1961. On the chemical composition
of eleven species of phytoplankters. J. Fish. Res. Board Can. 18: 101–116.
18. Parsons, T.R. and J.D.H. Strickland. 1965. Particulate organic matter. III.I. Pigment
analysis. III.II. Determination of phytoplankton pigments. J. Fish. Res. Board Can. 18:
117–127.
19. Payer, H.D., W. Pabst and K.H. Runkel. 1980. Review of the nutritional and
toxicological properties of the green algae Scenedesmus obliquus as a single cell
protein. In: Algae Biomass. Production and Use (Shelef, G. and C.J. Soeder, eds.), pp.
787–797, Elsevier North Holland Biomedical Press, Amsterdam.
20. Stross, R.G. and S.M. Pemrick. 1974. Nutrient uptake kinetics in phytoplankton: a basis
for niche separation. J. Phycol. 10: 164–169.
21. Ukeles, R. 1980. American experience in the mass culture of microalgae for feeding
larvae of the American oyster Crassostrea virginica. In: Algae Biomass. Production and
Use (Shelef, G. and C.J. Soeder, eds.), pp. 287–306, Elsevier North Holland Biomedical