The underluminous Type la supernova 2005bl and the class of objects similar to SN 1991bg
24
0
0
Texto completo
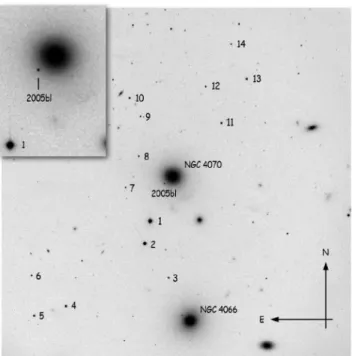
(2) 2. Taubenberger et al.. is accumulated. Usually, in the beginning there is the observation of a phenomenon, followed by a successful theoretical explanation. However, as further experiments or observations are carried out in order to confirm the newly developed theoretical ideas, often an ever higher degree of diversity and ever more exceptions from the simple rules are found the closer the subject of interest is studied. The need for refined and more complex theories to obtain a realistic description of the involved processes becomes evident. In the case of SNe Ia, first a class of cosmic explosions apparently similar in absolute luminosity (“standard candles”) and spectroscopic appearance was identified. These events were explained as the disruptions of white dwarfs which had accreted matter until they reached their stability limit close to the Chandrasekhar mass (MCh ). However, in 1991 the paradigm of SN Ia homogeneity had to be relaxed a lot. This was triggered by the observation of two peculiar SNe Ia, which thereafter served as prototypes of newly-defined SN Ia subclasses with distinct spectrophotometric properties. One of these, SN 1991T (Filippenko et al. 1992a; Phillips et al. 1992; Ruiz-Lapuente et al. 1992; Mazzali, Danziger & Turatto 1995), was up to 0.6 mag brighter than average SNe Ia, and characterised by a hot early-time spectrum with strong Fe iii features and weak or absent Si ii and S ii lines. The other one, SN 1991bg (Filippenko et al. 1992b; Leibundgut et al. 1993; Ruiz-Lapuente et al. 1993; Turatto et al. 1996; Mazzali et al. 1997) was even more deviant, with low ejecta velocities and a cool spectrum dominated by intermediate-mass-element (IME) lines and particularly strong O i and Ti ii. Moreover, it had unusually red colours at early phases, and was underluminous by about 2 mag at peak (hereafter we will refer to such appearance as 91bg-like). Hence, quasi instantaneously the luminosity range of SNe Ia had increased to a factor of ten between the brightest and the faintest objects, proving that they were no standard candles. However, two years later Phillips (1993) realised a tight correlation between peak luminosity and decline rate in the B band. This relation and revised versions of it (e.g. Phillips et al. 1999) turned SNe Ia into standardisable candles, and hence made them an extremely useful tool for precision cosmology1 . In the following years, several more 91bg-like SNe Ia were discovered, but the available data set grew much less rapidly than for ordinary SNe Ia. From the results of the Lick Observatory Supernova Search (LOSS) and the Beijing Astronomical Observatory Supernova Survey (BAOSS), Li et al. (2001) estimated that about 16 % of all SNe Ia are of the 91bg-like variety. This may still be an underestimate, as their low intrinsic luminosity makes 91bg-like SNe prone to Malmquist bias; nevertheless Li et al. (2001) estimated this effect to be negligible in their sample. Statistical studies (Hamuy et al. 1996a, 2000; Howell 2001) have shown that SNe Ia occur in all host-galaxy types, but revealed a correlation between SN decline rate and host morphology, with. 1. Several years later even more peculiar objects such as SN 2002cx (Li et al. 2003) were discovered which did not obey the Phillips relation, showing that not all SNe Ia are standardisable.. a clear tendency for 91bg-like SNe to be associated with early-type hosts and hence old stellar populations. While the single-degenerate (SD) Chandrasekhar-mass model has survived as the favoured scenario for the normal and indeed rather homogeneous SNe Ia, a number of alternative models have been suggested for the 91bg-like subclass. Ideas include double-degenerate (DD) explosions of merging white dwarfs, sub-Chandrasekhar-mass explosions triggered by detonation of the accreted helium layer (cf. Hillebrandt & Niemeyer 2000, for a review), and deflagrations in strongly rotating white dwarfs, where the turbulent propagation of the flame front is suppressed by the differential rotation (Pfannes 2006). Still, the notion that 91bg-like SNe are – in terms of the underlying explosion model – no different from ordinary SNe Ia, and that the only discriminating parameter is the mass of synthesised 56 Ni, has supporters in the SN Ia community. No conclusive evidence for any of these ideas has been found so far. In this paper we present the joint data set of SN 2005bl obtained by the European Supernova Collaboration (ESC)2 and the Carnegie Supernova Project (CSP)3 . Since these observations are among the earliest ever obtained for a 91bglike SN, they may help to better constrain possible progenitor and explosion models. The observations and techniques applied for data reduction and calibration are discussed in Section 2. In Section 3 we estimate the distance of SN 2005bl and the extinction along the line of sight. Sections 4 and 5 are devoted to the analysis of the light curves and spectra, respectively. Results of 1D spectrum synthesis calculations are presented in Section 6, and a comparison with other underluminous SNe Ia is performed in Section 7, where we also discuss the impact of SN 2005bl on our picture of SN Ia explosions. A short summary of the main results is given in Section 8.. 2. OBSERVATIONS AND DATA REDUCTION. SN 2005bl (z = 0.024) was discovered in the course of the Lick Observatory Supernova Search programme (LOSS) with the Katzman Automatic Imaging Telescope (KAIT) on UT 2005 April 14.34 and 15.36 at unfiltered magnitudes of 18.8 and 18.3, respectively (Shimasaki & Li 2005). The SN was not detected on images obtained with the same setup on UT 2005 March 11.33 to a limiting magnitude of 19.5. Based on spectra taken with the Las Campanas 2.5 m du Pont Telescope (+ WFCCD spectrograph) and the Fred Lawrence Whipple Observatory 1.5 m Telescope (+ FAST), SN 2005bl was classified as SN Ia, probably belonging to the 91bglike variety given the similarity of the spectra with those of SN 1999by a few days before maximum light (Morrell et al. 2005; Gallagher et al. 2005a). The SN is located in the elliptical galaxy NGC 4070 (de Vaucouleurs morphological type −4.9; LEDA4 ), projected on a region of steep yet smooth background variation (Fig. 1). Details on the SN and host galaxy properties are summarised in Table 1.. 2 3 4. http://www.mpa-garching.mpg.de/∼rtn/ http://www.csp1.lco.cl/∼cspuser1/PUB/CSP.html Lyon-Meudon Extragalactic Database http://leda.univ-lyon1.fr/.
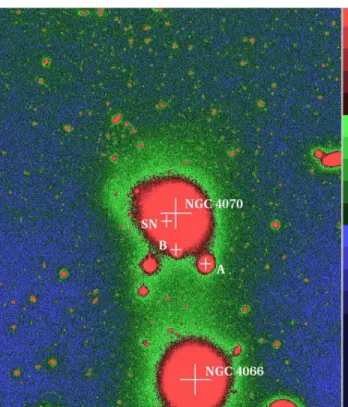
(3) SN 2005bl. 3. Table 1. Properties of SN 2005bl and its host galaxy. NGC 4059 / NGC 4070a α δ redshift recession velocity v b vVirgo c vCMB distance modulus µd apparent corr. B magnitude morphological typee Galactic reddening E(B −V ). 12h04m11.s 43 +20◦ 24′ 37.′′ 7 0.02406 ± 0.00008 7213 ± 24 km s−1 7330 ± 28 km s−1 7534 ± 33 km s−1 35.10 ± 0.09 mag 13.75 ± 0.15 E, −4.9 0.028 mag. 1 1 2 2 2 2 2 1 1 3. 12h04m12.s 32 +20◦ 24′ 24.′′ 8 13.′′ 9 E, 11.′′ 2 S 0.17 ± 0.08 mag 1.93 ± 0.10 2 453 481.4 ± 0.3 2 453 482.6 ± 0.3 2 453 484.9 ± 0.3 2 453 485.9 ± 0.3 2 453 487.0 ± 0.3 2 453 483.0 ± 0.3 2 453 487.0 ± 3.0 19.14 ± 0.18 18.68 ± 0.04 17.87 ± 0.03 17.55 ± 0.03 17.38 ± 0.04 18.20 ± 0.07 17.77 ± 0.12 −16.91 ± 0.43 −17.24 ± 0.34 −17.85 ± 0.27 −18.06 ± 0.23 −18.10 ± 0.18 −17.55 ± 0.29 −17.67 ± 0.20. 4 4 4 5 5 5 5 5 5 5 5 5 5 5 5 5 5 5 5 5 5 5 5 5 5 5. SN 2005bl. Figure 1. R-band image of the SN 2005bl field taken with the Calar Alto 2.2 m Telescope + CAFOS on UT 2005 May 14. The field of view is 9 × 9 arcmin2 , and the local sequence stars are indicated. In the upper-left corner a twice-enlarged blow-up of the SN and its host galaxy is shown.. Although SN 2005bl was too distant to fulfil the formal selection criteria of the ESC, optical follow-up observations were performed owing to the peculiarities found in our first spectrum, obtained almost at the same time as the classification spectra by other groups. However, given the dimness of the SN, an intensive coverage as for other ESC targets was out of reach. In particular, the early part of the light curves was not well sampled owing to bad weather and scheduling constraints. At the same time, the CSP collaboration started their follow-up of SN 2005bl, focussing mainly on the photometric evolution near maximum light. Hence, the two data sets were almost perfectly complementary.. α δ offset from galaxy centre host reddening E(B −V ) ∆m15 (B)true JDmax in U JDmax in B JDmax in V JDmax in R JDmax in I JDmax in g JDmax in z Umax Bmax Vmax Rmax Imax gmax zmax MU,max MB,max MV,max MR,max MI,max Mg,max Mz,max a b. 2.1. Photometric data. Optical photometry of SN 2005bl was acquired from one week before to about two months after maximum light in B. The basic data reduction (bias subtraction, overscan correction and flat-fielding) was performed using standard routines in iraf6 (Massey & Davis 1992; Massey 1997). The local sequence of stars in the SN field shown in Fig. 1 was calibrated with respect to a number of Landolt (1992, for UBVRI) and Sloan (Smith et al. 2002, for ugriz) standard fields on several photometric nights. The magnitudes of the calibrated local sequence, listed in Table 2, were used subsequently to determine the SN magnitudes in a relative measurement. 5. NASA/IPAC Extragalactic Database http://nedwww.ipac.caltech.edu/ 6 iraf is distributed by the National Optical Astronomy Observatories, which are operated by the Association of Universities for Research in Astronomy, Inc, under contract to the National Science Foundation.. The galaxy is listed twice in the NGC catalogue. v corrected for Local-Group infall onto Virgo cluster c v corrected to the CMB reference frame d from v −1 Mpc−1 CMB , using H0 = 72 km s e numerical code according to de Vaucouleurs. 1: LEDA; 2: NED5 ; 3: Schlegel, Finkbeiner & Davis 1998; 4: Puckett & Langoussis 2005; 5: this work. For the sequence-star magnitudes in the Sloan ugri bands, the reader is referred to Contreras et al. (in prep.). Although the host-galaxy background at the projected SN site seemed to be smooth, we applied the templatesubtraction technique (Filippenko et al. 1986) in order to eliminate any possible contamination from the host galaxy, a justified concern given the faintness of the SN. For this purpose we acquired templates in BVRI with CAFOS mounted on the Calar Alto 2.2 m Telescope on UT 2006 March 28, and in uBVgri with the Las Campanas 2.5 m du Pont Telescope from UT 2006 April 3 to 30, about one year after the explosion when the SN had faded from visibility. For the ESC data, the galaxy subtraction was performed using the iraf.
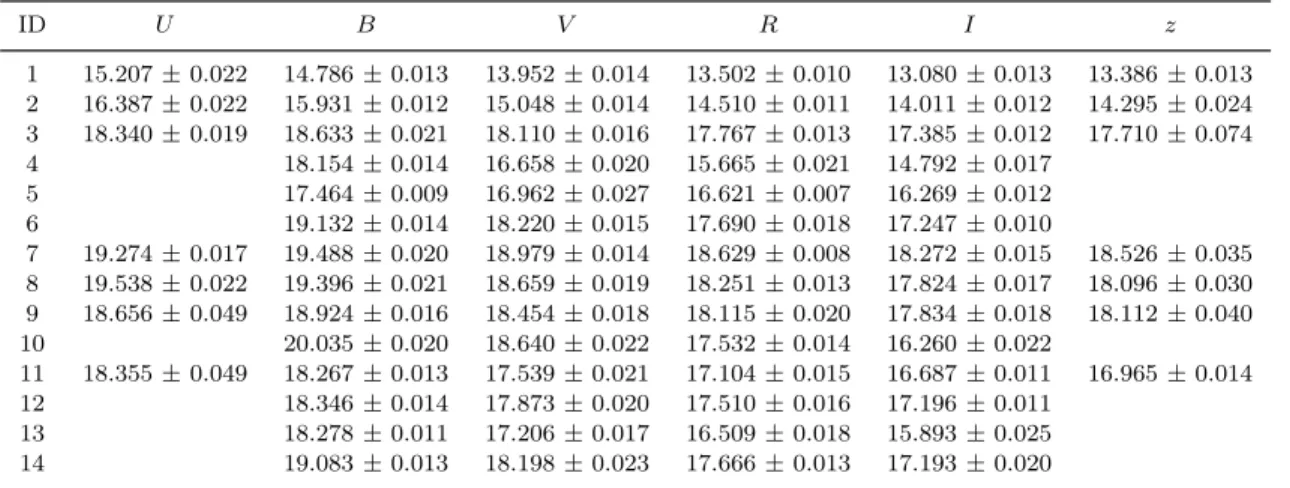
(4) 4. Taubenberger et al.. Table 2. Magnitudes of the local sequence stars in the field of SN 2005bl (Fig. 1). ID. U. 1 2 3 4 5 6 7 8 9 10 11 12 13 14. 15.207 ± 0.022 16.387 ± 0.022 18.340 ± 0.019. 19.274 ± 0.017 19.538 ± 0.022 18.656 ± 0.049 18.355 ± 0.049. B 14.786 15.931 18.633 18.154 17.464 19.132 19.488 19.396 18.924 20.035 18.267 18.346 18.278 19.083. ± ± ± ± ± ± ± ± ± ± ± ± ± ±. V 0.013 0.012 0.021 0.014 0.009 0.014 0.020 0.021 0.016 0.020 0.013 0.014 0.011 0.013. 13.952 15.048 18.110 16.658 16.962 18.220 18.979 18.659 18.454 18.640 17.539 17.873 17.206 18.198. ± ± ± ± ± ± ± ± ± ± ± ± ± ±. R 0.014 0.014 0.016 0.020 0.027 0.015 0.014 0.019 0.018 0.022 0.021 0.020 0.017 0.023. 13.502 14.510 17.767 15.665 16.621 17.690 18.629 18.251 18.115 17.532 17.104 17.510 16.509 17.666. ± ± ± ± ± ± ± ± ± ± ± ± ± ±. I 0.010 0.011 0.013 0.021 0.007 0.018 0.008 0.013 0.020 0.014 0.015 0.016 0.018 0.013. 13.080 14.011 17.385 14.792 16.269 17.247 18.272 17.824 17.834 16.260 16.687 17.196 15.893 17.193. ± ± ± ± ± ± ± ± ± ± ± ± ± ±. z 0.013 0.012 0.012 0.017 0.012 0.010 0.015 0.017 0.018 0.022 0.011 0.011 0.025 0.020. 13.386 ± 0.013 14.295 ± 0.024 17.710 ± 0.074. 18.526 ± 0.035 18.096 ± 0.030 18.112 ± 0.040 16.965 ± 0.014. plug-in svsub written by S.V. (based on isis). The instrumental SN magnitudes were determined in the backgroundsubtracted images with point-spread function (PSF) fitting photometry using the software package snoopy, specifically designed for this purpose by F. Patat and implemented in iraf by E. Cappellaro. For the z band no templates were available, and the measurements were performed with ordinary background-fitting PSF photometry in snoopy. A check in the BVRI bands showed a good agreement between the two methods. Therefore, we are confident that also our z-band photometry is sufficiently reliable. The calibration of the SN magnitudes to the desired standard photometric systems, the Johnson/Cousins system (Bessell 1990) for UBVRI and the Sloan system (Fukugita et al. 1996) for g and z, was complicated by the variety of filters mounted at the various telescopes, some of which deviated strongly from the standard. Fig. 2 shows the BVRI and ri response curves of all instruments used for the SN follow-up.. Bessell photometry In order to compensate for the differences in the transmission curves, and to report the magnitudes on the Bessell system, we made use of the “S-correction” technique based on the prescription of Stritzinger et al. (2002), Pignata et al. (2004), and references therein. S-corrections were computed for the BVRI and Sloan ri data, based on our spectra of SN 2005bl. Unfortunately, the spectra do not fully cover the U -band region, so that no U -band Scorrection could be derived. Instead, transformation formulae (Jordi, Grebel & Ammon 2006; Zhao & Newberg 2006) were employed to convert the Swope u-band data to the Bessell system. Similarly, no S-correction was applied to data later than +50 d, since our spectroscopic follow-up ends already well before. The strong deviation of the MONICA V filter (actually a Roeser BV filter) from the Bessell description (see Fig. 2), along with some lacking information required to reconstruct the response curve, makes the MONICA V -band correction less reliable. The redshift of SN 2005bl is not negligible. Therefore, in computing the S-correction the spectra were shifted in. Figure 2. Instrumental BVRI / ri passbands used for the observations of SN 2005bl. The standard Bessell (1990) curves are also displayed in the figure for comparison.. order to account also for the K-correction. Since the same restrictions as before apply also here, no K-correction was performed for the U band and for any data later than +50 d. In Table 3 the fully calibrated and – whenever possible – S- and K-corrected UBVRI Bessell magnitudes of SN 2005bl are reported, together with their uncertainties. Both the intrinsic Bessell data and the transformed Sloan photometry entered into this Table. Table 4 shows the combined S- and K-correction, i.e., the difference between the magnitudes of Table 3 and those obtained with a first-order colour-term calibration. The differences are significant, so that the lack of the S- and K-correction for U may introduce considerable uncertainties..
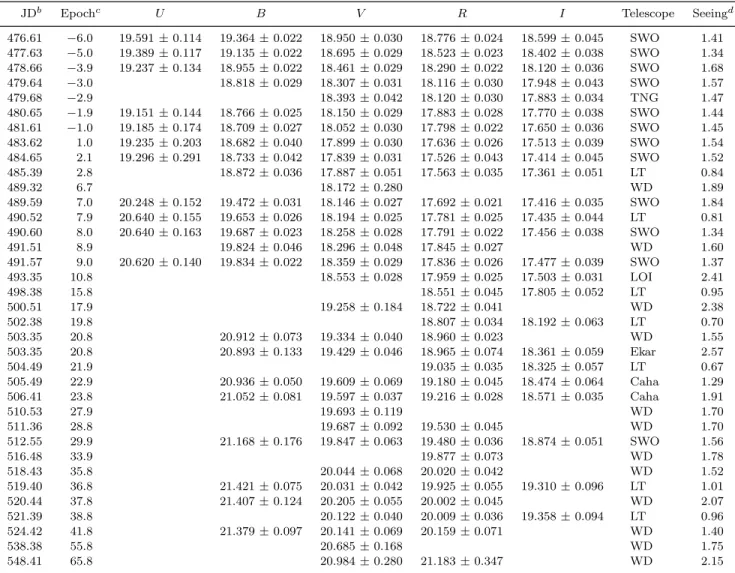
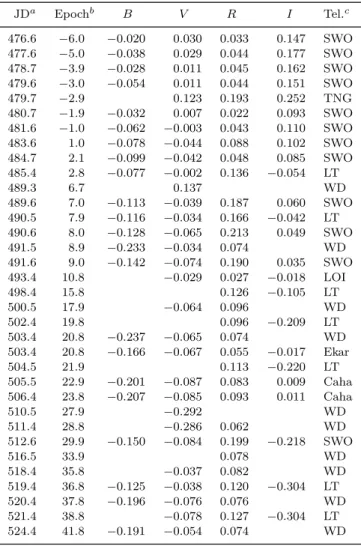
(5) SN 2005bl. 5. Table 3. S- and K-corrected Bessell magnitudes of SN 2005bl.a JDb 476.61 477.63 478.66 479.64 479.68 480.65 481.61 483.62 484.65 485.39 489.32 489.59 490.52 490.60 491.51 491.57 493.35 498.38 500.51 502.38 503.35 503.35 504.49 505.49 506.41 510.53 511.36 512.55 516.48 518.43 519.40 520.44 521.39 524.42 538.38 548.41 a. Epochc. U. −6.0 −5.0 −3.9 −3.0 −2.9 −1.9 −1.0 1.0 2.1 2.8 6.7 7.0 7.9 8.0 8.9 9.0 10.8 15.8 17.9 19.8 20.8 20.8 21.9 22.9 23.8 27.9 28.8 29.9 33.9 35.8 36.8 37.8 38.8 41.8 55.8 65.8. 19.591 ± 0.114 19.389 ± 0.117 19.237 ± 0.134. 19.364 19.135 18.955 18.818. ± ± ± ±. 0.022 0.022 0.022 0.029. 19.151 19.185 19.235 19.296. 0.144 0.174 0.203 0.291. 18.766 18.709 18.682 18.733 18.872. ± ± ± ± ±. 0.025 0.027 0.040 0.042 0.036. 20.248 ± 0.152 20.640 ± 0.155 20.640 ± 0.163. 19.472 19.653 19.687 19.824 19.834. ± ± ± ± ±. 0.031 0.026 0.023 0.046 0.022. ± ± ± ±. B. 20.620 ± 0.140. V 18.950 18.695 18.461 18.307 18.393 18.150 18.052 17.899 17.839 17.887 18.172 18.146 18.194 18.258 18.296 18.359 18.553. ± ± ± ± ± ± ± ± ± ± ± ± ± ± ± ± ±. R 0.030 0.029 0.029 0.031 0.042 0.029 0.030 0.030 0.031 0.051 0.280 0.027 0.025 0.028 0.048 0.029 0.028. 19.258 ± 0.184 20.912 ± 0.073 20.893 ± 0.133. 19.334 ± 0.040 19.429 ± 0.046. 20.936 ± 0.050 21.052 ± 0.081. 19.609 19.597 19.693 19.687 19.847. ± ± ± ± ±. 0.069 0.037 0.119 0.092 0.063. 20.044 20.031 20.205 20.122 20.141 20.685 20.984. ± ± ± ± ± ± ±. 0.068 0.042 0.055 0.040 0.069 0.168 0.280. 21.168 ± 0.176. 21.421 ± 0.075 21.407 ± 0.124 21.379 ± 0.097. I. 18.776 18.523 18.290 18.116 18.120 17.883 17.798 17.636 17.526 17.563. ± ± ± ± ± ± ± ± ± ±. 0.024 0.023 0.022 0.030 0.030 0.028 0.022 0.026 0.043 0.035. 18.599 18.402 18.120 17.948 17.883 17.770 17.650 17.513 17.414 17.361. 17.692 17.781 17.791 17.845 17.836 17.959 18.551 18.722 18.807 18.960 18.965 19.035 19.180 19.216. ± ± ± ± ± ± ± ± ± ± ± ± ± ±. 0.021 0.025 0.022 0.027 0.026 0.025 0.045 0.041 0.034 0.023 0.074 0.035 0.045 0.028. 17.416 ± 0.035 17.435 ± 0.044 17.456 ± 0.038. 19.530 19.480 19.877 20.020 19.925 20.002 20.009 20.159. ± ± ± ± ± ± ± ±. 0.045 0.036 0.073 0.042 0.055 0.045 0.036 0.071. ± ± ± ± ± ± ± ± ± ±. 0.045 0.038 0.036 0.043 0.034 0.038 0.036 0.039 0.045 0.051. 17.477 ± 0.039 17.503 ± 0.031 17.805 ± 0.052 18.192 ± 0.063 18.361 18.325 18.474 18.571. ± ± ± ±. 0.059 0.057 0.064 0.035. 18.874 ± 0.051. 19.310 ± 0.096 19.358 ± 0.094. 21.183 ± 0.347. Telescope. Seeingd. SWO SWO SWO SWO TNG SWO SWO SWO SWO LT WD SWO LT SWO WD SWO LOI LT WD LT WD Ekar LT Caha Caha WD WD SWO WD WD LT WD LT WD WD WD. 1.41 1.34 1.68 1.57 1.47 1.44 1.45 1.54 1.52 0.84 1.89 1.84 0.81 1.34 1.60 1.37 2.41 0.95 2.38 0.70 1.55 2.57 0.67 1.29 1.91 1.70 1.70 1.56 1.78 1.52 1.01 2.07 0.96 1.40 1.75 2.15. No S- and K-correction applied in the U band and to any data after +50 d. b JD − 2 453 000.00 c Epoch in days with respect to the B-band maximum JD 2 453 482.6 ± 0.5. d Average seeing in arcsec over all filter bands. SWO = Las Campanas 1.0 m Swope Telescope + CCD; http://www.lco.cl/telescopes-information/henrietta-swope/ TNG = 3.58 m Telescopio Nazionale Galileo + DOLORES; http://www.tng.iac.es/instruments/lrs/ LT = 2.0 m Liverpool Telescope + RATCAM; http://telescope.livjm.ac.uk/Info/TelInst/Inst/RATCam/ WD = 0.8 m Wendelstein Telescope + MONICA; http://www.wendelstein-observatorium.de/monica/monica en.html LOI = 1.52 m Loiano Telescope + BFOSC; http://www.bo.astro.it/loiano/152cm.html Ekar = Asiago 1.82 m Telescope + AFOSC; http://www.oapd.inaf.it/asiago/2000/2300/2310.html Caha = Calar Alto 2.2 m Telescope + CAFOS SiTe; http://www.caha.es/CAHA/Instruments/CAFOS/. Sloan photometry. 2.2. Spectroscopic data. Besides transforming the Swope and Liverpool Sloan-filter observations to the Bessell system via S-corrections, light curves in the Sloan photometric system itself were constructed. The magnitudes were calibrated through firstorder colour equations without employing S-corrections, since at both telescopes the filters are close to the standard Sloan prescription. Table 5 reports the Sloan griz photometry from the Liverpool telescope. For the original Swope photometry see Contreras et al. (in prep.).. Details of the spectroscopic observations of SN 2005bl are reported in Table 6. All two-dimensional spectroscopic frames were first debiased and flat-fielded, before an optimal, variance-weighted extraction of the spectra (Horne 1986; Massey, Valdes & Barnes 1992) was performed using the iraf routine apall. Wavelength calibration was accomplished with the help of arc-lamp exposures or, whenever this was not possible, using the night-sky lines. The instrumental response functions required for flux calibration were determined from observations of the spectrophotometric standard stars reported in Table 6. Whenever no standard had been observed, the sensitivity curve obtained on.
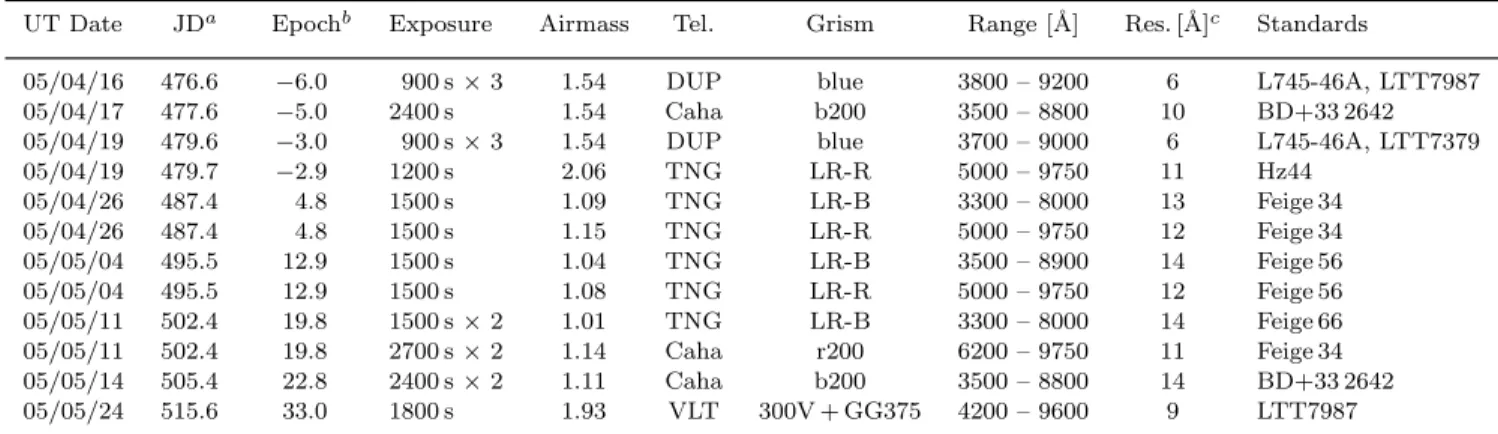
(6) 6. Taubenberger et al.. Table 5. Sloan photometry of SN 2005bl obtained with the Liverpool telescope. No S- and K-correction has been applied. For the Swope data see Contreras et al. (in prep.).. a. JDa. Epochb. g. 485.4 490.5 498.4 502.4 504.5 519.4 521.4. 2.8 7.9 15.8 19.8 21.9 36.8 38.8. 18.295 ± 0.115. JD − 2 453 000.0. b. r 17.669 17.877 18.676 18.921 19.138 19.998 20.073. ± ± ± ± ± ± ±. i 0.023 0.025 0.046 0.039 0.047 0.071 0.043. 17.866 17.870 18.308 18.760 18.878 19.982 20.081. z. ± ± ± ± ± ± ±. 0.051 0.031 0.092 0.059 0.077 0.093 0.100. 17.769 ± 0.080 17.808 ± 0.039 18.113 ± 0.080 18.548 ± 0.095 19.548 ± 0.165 19.680 ± 0.240. Epoch in days with respect to B-band maximum (JD = 2 453 482.6 ± 0.5).. Table 6. Journal of spectroscopic observations of SN 2005bl. UT Date. JDa. 05/04/16 05/04/17 05/04/19 05/04/19 05/04/26 05/04/26 05/05/04 05/05/04 05/05/11 05/05/11 05/05/14 05/05/24. 476.6 477.6 479.6 479.7 487.4 487.4 495.5 495.5 502.4 502.4 505.4 515.6. a. JD − 2 453 000.0. b. Epochb. Exposure. −6.0 −5.0 −3.0 −2.9 4.8 4.8 12.9 12.9 19.8 19.8 22.8 33.0. 900 s 2400 s 900 s 1200 s 1500 s 1500 s 1500 s 1500 s 1500 s 2700 s 2400 s 1800 s. ×3 ×3. ×2 ×2 ×2. Airmass. Tel.. Grism. 1.54 1.54 1.54 2.06 1.09 1.15 1.04 1.08 1.01 1.14 1.11 1.93. DUP Caha DUP TNG TNG TNG TNG TNG TNG Caha Caha VLT. blue b200 blue LR-R LR-B LR-R LR-B LR-R LR-B r200 b200 300V + GG375. Relative to B-band maximum (JD = 2 453 482.6 ± 0.5). unblended night-sky lines.. Range [Å]. c. 3800 3500 3700 5000 3300 5000 3500 5000 3300 6200 3500 4200. – – – – – – – – – – – –. 9200 8800 9000 9750 8000 9750 8900 9750 8000 9750 8800 9600. Res. [Å]c 6 10 6 11 13 12 14 12 14 11 14 9. Standards L745-46A, LTT7987 BD+33 2642 L745-46A, LTT7379 Hz44 Feige 34 Feige 34 Feige 56 Feige 56 Feige 66 Feige 34 BD+33 2642 LTT7987. Full-width at half maximum (FWHM) of isolated,. DUP = Las Campanas 2.5 m du Pont Telescope + WFCCD; http://www.lco.cl/telescopes-information/irenee-du-pont/ Caha = Calar Alto 2.2 m Telescope + CAFOS SiTe; http://www.caha.es/CAHA/Instruments/CAFOS/ TNG = 3.58 m Telescopio Nazionale Galileo + DOLORES; http://www.tng.iac.es/instruments/lrs/ VLT = ESO 8.2 m Very Large Telescope UT1 + FORS2; http://www.eso.org/instruments/fors2/. a different night with the same instrumental configuration was used. Atmospheric extinction correction was applied using tabulated extinction coefficients for each telescope site. Telluric features were identified in the spectra of the spectrophotometric standard stars and removed from the SN spectra. To check the calibration, the spectroscopic fluxes were transformed into magnitudes by integrating the spectra convolved with Bessell (1990) filter functions. Whenever necessary, the spectral fluxes were adjusted to match the contemporaneous photometry. Finally, spectra of similar quality obtained during the same night were combined to increase the signal-to-noise ratio (S/N); if the wavelength range of these spectra was different, they were averaged in their overlap region. As a consequence of charge-transfer-efficiency problems of the DOLORES CCD, it was not possible to remove the night-sky emission in the TNG spectra cleanly. A pattern of negative and positive residuals was left, sometimes at wavelengths coinciding with spectral features of the SN, thus limiting the reliability of line-depth measurements. To mitigate this problem, the lines affected were fitted with polynomials, excluding from the fit the regions of strongest residuals, and then the depth was determined in the polynomial curves.. 3. DISTANCE, EXTINCTION AND HOST GALAXY PROPERTIES. Like most 91bg-like SNe Ia (Gallagher et al. 2005b), SN 2005bl exploded in an early-type host, the elliptical galaxy NGC 4070. Other prominent examples are SN 1991bg itself and SN 1997cn in elliptical hosts (Filippenko et al. 1992b; Leibundgut et al. 1993; Turatto et al. 1996, 1998), and SN 1998de whose host galaxy was of type S0 (Modjaz et al. 2001).7 Since early-type galaxies are assumed to have experienced no significant star formation over long times, this behaviour might be indicative of 91bg-like SNe Ia originating from an old stellar population. Even if one allows for some more recent star formation in elliptical galaxies (e.g. triggered by mergers or interaction), the relative paucity of 91bg-like SNe in late-type, actively star-forming galaxies clearly disfavour young or intermediate-aged stellar progenitors or progenitor systems. A widely accepted paradigm for elliptical galaxies is that they have only little interstellar gas and dust (but see. 7. SN 1999by (Garnavich et al. 2004) was hosted by NGC 2841, a spiral galaxy, but with the spectral appearance of an elliptical galaxy (Gallagher et al. 2005b)..
(7) SN 2005bl Table 4. Amount of S- and K-correction contained in the magnitudes reported in Table 3. No S- and K-correction has been applied to the U -band data. JDa. Epochb. B. V. R. I. Tel.c. 476.6 477.6 478.7 479.6 479.7 480.7 481.6 483.6 484.7 485.4 489.3 489.6 490.5 490.6 491.5 491.6 493.4 498.4 500.5 502.4 503.4 503.4 504.5 505.5 506.4 510.5 511.4 512.6 516.5 518.4 519.4 520.4 521.4 524.4. −6.0 −5.0 −3.9 −3.0 −2.9 −1.9 −1.0 1.0 2.1 2.8 6.7 7.0 7.9 8.0 8.9 9.0 10.8 15.8 17.9 19.8 20.8 20.8 21.9 22.9 23.8 27.9 28.8 29.9 33.9 35.8 36.8 37.8 38.8 41.8. −0.020 −0.038 −0.028 −0.054. 0.030 0.029 0.011 0.011 0.123 0.007 −0.003 −0.044 −0.042 −0.002 0.137 −0.039 −0.034 −0.065 −0.034 −0.074 −0.029. 0.033 0.044 0.045 0.044 0.193 0.022 0.043 0.088 0.048 0.136. 0.147 0.177 0.162 0.151 0.252 0.093 0.110 0.102 0.085 −0.054. 0.187 0.166 0.213 0.074 0.190 0.027 0.126 0.096 0.096 0.074 0.055 0.113 0.083 0.093. 0.060 −0.042 0.049. SWO SWO SWO SWO TNG SWO SWO SWO SWO LT WD SWO LT SWO WD SWO LOI LT WD LT WD Ekar LT Caha Caha WD WD SWO WD WD LT WD LT WD. −0.032 −0.062 −0.078 −0.099 −0.077 −0.113 −0.116 −0.128 −0.233 −0.142. −0.064 −0.237 −0.166. −0.065 −0.067. −0.201 −0.207. −0.087 −0.085 −0.292 −0.286 −0.084. −0.150. −0.125 −0.196 −0.191. −0.037 −0.038 −0.076 −0.078 −0.054. 0.062 0.199 0.078 0.082 0.120 0.076 0.127 0.074. 0.035 −0.018 −0.105 −0.209 −0.017 −0.220 0.009 0.011. −0.218. −0.304 −0.304. a. JD − 2 453 000.0 b Epoch in days with respect to the estimated B-band maximum JD 2 453 482.6 ± 0.5. c See Table 3 for details.. Figure 3. B − R difference image of NGC 4070, constructed as described in the text. Dark shades in the figure correspond to red areas. The field of view is 2 × 2 arcmin2 ; north is up, east to the left. Crosshairs mark the explosion site of SN 2005bl and the centre of NGC 4070. ‘B’ denotes a bluish patch, probably a companion galaxy of NGC 4070 (see discussion in the text).. 7. Patil et al. 2007 for a more sophisticated picture). This is consistent with the negligible host-galaxy extinction found in SNe 1991bg, 1997cn and 1998de. However, recent mergers or interaction may alter this picture, as exemplified by the radio galaxy Centaurus A, the host of SN 1986G (Phillips et al. 1987). In this case, the SN lay behind a prominent dust lane, and consequently was strongly extinguished. In NGC 4070 no such dust lane is visible even in deep images, but SN 2005bl showed signs of extinction within its host galaxy, the most prominent being a narrow interstellar Na i D line in the spectra at the redshift of the host, with an equivalent width (EW) of 2.6 ± 0.3 Å. Since elliptical galaxies lack H ii regions with strong emission lines, their surface colours are good tracers of the internal dust distribution (Patil et al. 2007). Hence, to investigate the dust content in NGC 4070, we constructed a B − R image of the galaxy from the templates obtained with CAFOS on UT 2006 March 28, following largely the prescription of Patil et al. (2007): after the usual pre-reduction, the B- and R-band images were spatially aligned, and the sky background was subtracted. The images were then scaled to contain the same flux inside an aperture of 45 arcsec around the centre of NGC 4070, and subtracted one from the other. The difference image is shown in Fig. 3. Both the centre of the galaxy and the position of SN 2005bl are marked. Dark shades correspond to redder areas, indicative of either dust or an intrinsically redder stellar population. A red region is present to the immediate east and north-east of the nucleus, and another more extended but less opaque arc to its south-west. This asymmetric surface-colour distribution suggests that there probably is dust in NGC 4070. However, at the exact position of SN 2005bl no major blue or red structures can be discerned, so that the dust obscuring the SN is probably too locally confined to be resolved. Deep images of NGC 4070 reveal some deviation from a perfectly spherical or ellipsoidal shape (Fig. 4). This is an indication of fairly recent interaction, either with the galaxy 2MASX J12040831+2023280 about 1.3 arcmin to its south-west (labelled ‘A’ in Fig. 4), or with a small knot about 0.8 arcmin to its south (labelled ‘B’, and most easily seen as irregularly-shaped bright patch in the lower part of Fig. 3). Furthermore, in Fig. 4 a faint, broad bridge of luminous matter between NGC 4070 and its equally massive elliptical neighbour galaxy NGC 4066 can be detected.8 The two galaxies are offset by about 3.74 arcmin, which corresponds to a projected distance of 114 kpc (for H0 = 72 km s−1 Mpc−1 ). The exact amount of dust extinction towards SN 2005bl is quite difficult to determine, and it constitutes the main uncertainty in the calibration of the SN absolute magnitudes. The Galactic component is small, with a colour excess E(B−V ) ≈ 0.03 mag (Schlegel et al. 1998). However, as mentioned before, the contribution of dust in the host galaxy is significant. With EW(Na i D)= 2.6 ± 0.3 Å and applying E(B −V ) = 0.16 × EW(Na i D) , (Turatto, Benetti & Cappellaro 2003), we obtain E(B −. 8. The situation is somewhat reminiscent of SN Ia 2005cf (Pastorello et al. 2007a), with the difference that this SN was directly located in the tidal bridge..
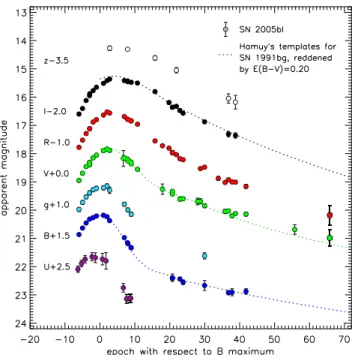
(8) 8. Taubenberger et al.. Figure 4. Deep 7.7 × 9.0 arcmin2 exposure of NGC 4070 and its neighbour NGC 4066 obtained on UT 2006 March 28 with CAFOS. North is up, east to the left; brightness increases from blue over green to red. The distorted shape of NGC 4070 and the bridge of luminous matter connecting the two galaxies are discernible. ‘A’ and ‘B’ mark companion galaxies of NGC 4070.. V )host = 0.42 ± 0.05 mag. However, the lack of knowledge of the extinguishing material’s gas-to-dust ratio makes this method very uncertain. Therefore, in the case of Type Ia SNe, alternative ways to determine the colour excess using the light and colour curves are usually preferred. Among the most well-known is the Lira (1995) relation, which assumes a uniform B − V colour evolution of SNe Ia between 30 and 90 d after maximum (but see Wang et al. 2007 for a recent warning about the use of this method). Apparently, this relation seems to hold also for underluminous SNe Ia, which are characterised by much redder B−V colours at maximum and soon thereafter. However, the decreasing quality of the SN 2005bl photometry after +30 d and the lack of B-band observations later than +42 d, result in a relatively large range of colour excesses consistent with the Lira relation, from E(B −V )host ≈ 0.12 to 0.25 mag. Since SN 2005bl is an underluminous SN Ia with ∆m15 (B)true = 1.93 (cf. Section 4.1), SNe 1991bg and 1999by (∆m15 (B)true = 1.94 and 1.90, respectively; cf. Section 7) are natural comparison objects. Despite their numerous similarities, the reddening-corrected colour curves of the two latter objects differ especially at early phases, SN 1991bg being ∼ 0.15 mag redder in B − V than SN 1999by. This intrinsic colour difference directly propagates to an uncertainty in the inferred colour excess of SN 2005bl determined on the basis of such comparison. Matching the colours of SN 2005bl to SN 1991bg, we obtain E(B−V )host ≈ 0.13 ± 0.05 mag, whereas a comparison with SN 1999by yields E(B −V )host ≈ 0.29 ± 0.05 mag. A study of the extinction law towards SN 2005bl, analo-. gous to that presented by Elias-Rosa et al. (2006) and based on extracting an extinction curve from a comparison with coeval spectra of SNe 1991bg and 1999by, yields a host-galaxy colour excess of 0.22 ± 0.02 mag. Furthermore, no deviation of the total-to-selective-extinction parameter RV from the canonical value of 3.1 as inferred from “standard” dust in the Milky Way can be discerned. For the rest of the discussion we assume E(B−V )host = 0.17±0.08 mag. This estimate is based solely on the study of the SN colours (giving the strongest weight to the comparison with SN 1991bg), and ignores the larger colour-excess estimate from the interstellar Na i D line, since the latter would result in too blue a colour and too high an absolute luminosity given SN 2005bl’s spectrophotometric similarity to SNe 1991bg and 1999by. This choice of E(B−V )host , together with the foreground reddening of 0.03 mag, yields a total colour excess E(B −V )total = 0.20 ± 0.08 mag and, adopting a standard Cardelli, Clayton & Mathis (1989) reddening law with RV = 3.1, a total B-band extinction along the line of sight of AB = 0.82 ± 0.33 mag. With a recession velocity corrected to the CMB reference frame of 7534 ± 33 km s−1 (Table 1), NGC 4070 is well within the Hubble flow. Adopting H0 = 72 km s−1 Mpc−1 (Freedman et al. 2001; Spergel et al. 2003), this corresponds to a distance of 104.6 Mpc and a kinematical distance modulus µ = 35.10 mag, similar to that of the Coma Cluster. However, the latter is about 14◦ 45′ away (which, at the given distance, corresponds to 27 Mpc), excluding any physical association. Accounting for an uncertainty of 300 km s−1 arising from a possible peculiar motion of NGC 4070, we obtain µ = 35.10 ± 0.09 mag.. 4 4.1. PHOTOMETRIC EVOLUTION Filtered light curves. The photometric observations of SN 2005bl are among the earliest ever obtained for a 91bg-like SN. In Fig. 5 we present the Bessell UBVRI and Sloan gz light curves, i.e. the data of Tables 3 and 5, and Contreras et al. (in prep.). S + K-corrections have been applied to the BVRI bands. Also shown are BVI-templates constructed from SN 1991bg (Hamuy et al. 1996c), reddened by E(B − V ) = 0.20 mag. These provide an excellent match to SN 2005bl. Compared to normal-luminosity SNe Ia the light curves of SN 2005bl are characterised by a fast rise to and decline from the light-curve peak, especially in the blue bands. Moreover, in the B band the settling to the exponential tail (corresponding to the bend parameter tb of Pskovskii 1984 and the intersection parameter tB 2 as defined by Hamuy et al. 1996c) occurs at a remarkably early epoch, only about 15 d after maximum, as compared to 25–38 d for intermediate and slow decliners (Hamuy et al. 1996c). Consequently, the decline from the peak to the onset of the radioactive tail is only ∼ 1.9 mag, less than in most SNe Ia with shallower initial decline. The exact value of the Phillips (1993) decline rate parameter ∆m15 (B) is difficult to measure directly because of a gap in the light curves around +15 d. A polynomial fit including the B-band data up to one month past maximum yields ∆m15 (B) = 1.91, and we adopt a conservative error.
(9) SN 2005bl. Figure 5. UBVRI Bessell and gz Sloan light curves of SN 2005bl. The BVRI data (Table 3) are S- and K-corrected except for the latest phases, while the U , g and z data (Tables 3, 5 and Contreras et al. in prep.) are not. Hamuy et al.’s (1996c) templates for SN 1991bg are shown for comparison (dotted lines).. of 0.10 to account for the fact that the fit around +15 d is not very well constrained. After correction for the mitigating effects of extinction (Phillips et al. 1999) this turns into an actual decline rate ∆m15 (B)true = 1.93 ± 0.10. Besides the B band, differences with respect to normalluminosity SNe Ia are most pronounced in the near-IR (I and z bands), where – like in other 91bg-like SNe – the secondary light-curve maximum is absent, and the main maximum is delayed with respect to that in B (JD 2 453 482.6 ± 0.5) by a couple of days rather than advanced. In general, the instance of peak brightness seems to be the more delayed the redder the band is. V -band maximum occurs 2.3 d after that in B, and those in R and I are delayed by 3.3 and 4.4 d, respectively (see Table 1), whereas in U the light-curve peak precedes that in B by about 1.0 d. For the z band the sparse photometric coverage does not allow for an exact determination of the time of maximum light, but it can be estimated to be similarly delayed as in R or I. The absolute peak magnitudes of SN 2005bl (Table 1), calculated adopting the distance and extinction estimates presented in Section 3, reveal that the SN is underluminous by 1 to 2 mag in all filters compared to a canonical, ∆m15 (B)true = 1.1 SN Ia, the difference being most pronounced in the blue bands.. 4.2. Bolometric light curve. The differences in luminosity can clearly be seen in Fig. 6, where the quasi-bolometric light curve of SN 2005bl is compared to those of the other underluminous SNe Ia 1991bg, 1997cn, 1998de and 1999by (Filippenko et al. 1992b; Leibundgut et al. 1993; Turatto et al. 1996, 1998; Modjaz et al. 2001; Garnavich et al. 2004), and the in-. 9. Figure 6. Quasi-bolometric light curves of SNe 2005bl, 1991bg, 1997cn, 1998de, 1999by, 2004eo and 2005cf, obtained by integrating the U -through-I-band fluxes (for the adopted distance and extinction parameters see Table 8 and Pastorello et al. 2007a,b). Error bars are shown for SN 2005bl only, and account for uncertainties in the photometric calibration, distance and extinction estimates. The ∆m15 (B)true of the SNe is given in parentheses.. termediate decliner SN Ia 2004eo (∆m15 (B)true = 1.46, Pastorello et al. 2007b), which forms a bridge to canonical, normal-luminosity SNe Ia such as 2005cf (∆m15 (B)true = 1.12, Pastorello et al. 2007a). The integrated optical light curves (see, e.g., Nomoto, Filippenko & Shigeyama 1990) were constructed in the following way: in a first step the U -through-I magnitudes were converted to monochromatic fluxes and the spectral energy distribution (SED) was interpolated linearly. The SED was then integrated over frequency, assuming zero flux at the integration limits, which are given by the blue edge of the U band and the red edge of the I band. Whenever no U -band observations were available, or the coverage of this band was incomplete, a correction derived from SN 1999by was applied to the analogously constructed B-through-I light curve. This method appeared more reliable than applying U -band corrections based on ordinary SNe Ia. As Fig. 6 shows, 91bg-like SNe form a fairly homogeneous group in terms of bolometric light-curve shape and luminosity. Both their light-curve width and their luminosities distinguish them even from intermediate decliners such as SN 2004eo. SNe Ia with ∆m15 (B)true ∼ 1.50–1.85 (which are rare, cf. Section 7.1) would probably fall in the gap between SN 2004eo and the 91bg-like SNe. In Fig. 6 they are not included because their light-curve coverage is insufficient in some of the relevant bands. Within the 91bglike group, SN 2005bl appears to be the brightest object (log Lmax = 42.31 ± 0.11), but the differences are mostly within the error bars, which for SN 2005bl are dominated by the uncertainty in the host-galaxy extinction. In the only rapidly-declining SN Ia with extended near-IR photometry, SN 1999by (Höflich et al. 2002; Garnavich et al. 2004)9 , the JHK bands contribute ∼ 25 % to the total bolometric flux around maximum, and ∼ 36 % 9. SN 1991bg has been observed in JHK by Porter et al. (1992).
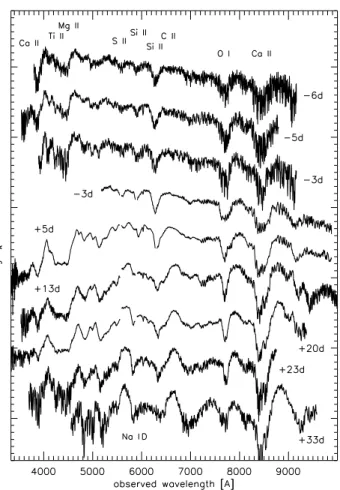
(10) 10. Taubenberger et al.. Figure 7. Time-evolution of the U − B, B − V , V − R and V − I colour indices of SN 2005bl. The curves have been reddeningcorrected adopting a Cardelli et al. (1989) extinction law with E(B − V ) = 0.20 mag and RV = 3.1.. after one month. The corresponding numbers measured for SN 2004eo are ∼ 16 % and ∼ 37 %, respectively. This means that at early phases the near IR gives a larger contribution in the fast decliners than it does in intermediate and slow decliners, but that by +30 d the difference has vanished. Wavelength regions other than the optical and near-IR appear to contribute very little to the total bolometric flux in SNe Ia (Suntzeff 1996; Contardo, Leibundgut & Vacca 2000). Therefore, neglecting these regimes should not cause a significant underestimate of the true bolometric luminosity.. 4.3. Colour evolution. Fig. 7 presents the time-evolution of the U − B, B − V , V − R and V − I colours of SN 2005bl. The good agreement with the colour curves of SN 1991bg (Hamuy et al. 1996c) also shown in the figure is evident. Except for the late V − R points, all colour indices are > 0 throughout the investigated period, indicating that SN 2005bl – like other rapidly-declining SNe Ia – was a rather red event. In particular it was much redder at early phases than ordinary SNe Ia, which are characterised by a B − V between 0.0 and −0.1 at maximum light. Remarkably, the evolution of SN 2005bl’s various colour indices with time is very similar. From our first observations at −6 d on, all colours become monotonically redder until at least ∼ 10 d after maximum, and almost simultaneously exhibit a red peak between +12 and +17 d, followed by a monotonic bluening which probably lasts beyond the end of our photometric coverage around +40 d.. (five epochs), but only the three epochs close to maximum light have been calibrated and published (Krisciunas et al. 2004). Figure 8. Time sequence of SN 2005bl spectra in the observer frame. The phases reported next to each spectrum are with respect to B-band maximum. The −3 d (blue part) and +33 d spectra have been smoothed using kernel sizes of 600 km s−1 . Gaps in the TNG spectra indicate the positions of the strongest night-sky residuals, which have been cut in order to avoid confusion with true SN or host-galaxy features (see Section 2.2 and Table 6).. Such a high degree of similarity between different colour indices is not encountered in normal-luminosity SNe Ia (cf. Section 7.1).. 5 5.1. SPECTROSCOPIC EVOLUTION Spectra of SN 2005bl. The spectra of SN 2005bl presented in Fig. 8 cover the interval from 6 d before to 33 d after B-band maximum light, i.e., the photospheric phase and the early transition stages towards the nebular phase. During this entire period, the SN follows the evolution of other SNe Ia, in particular of the 91bg-like subclass. The pre-maximum spectra have a blue continuum, with characteristic P-Cygni lines of Si ii, S ii, Ca ii and Mg ii superimposed. With respect to normalluminosity SNe Ia, additional strong Ti ii absorptions are visible, and the Si ii λ5972 and O i λ7774 absorptions are more pronounced. Shortly after maximum light the blue flux decreases significantly, and also the S ii and Si ii λ5972 lines fade rapidly, and are no longer detectable two weeks after maximum. Si ii λ6355 is, like most other photospheric lines, somewhat more persistent, and can still be discerned beyond.
(11) SN 2005bl. Figure 9. Comparison of pre-maximum spectra of underluminous SNe Ia. The spectra were reddening-corrected according to the B − V colour excesses reported in Section 7. The −6 d spectrum and the blue part of the combined −3 d spectrum of SN 2005bl were boxcar smoothed using kernel sizes of 2300 and 3400 km s−1 , respectively.. 11. Figure 10. The same as Fig. 9, but some days after maximum light in B.. +20 d. Na i D shows a trend opposite to that of Si and S, first being just visible as a shoulder in the blue wing of the Si ii λ5972 line on day +5, but evolving to a distinct absorption feature by day +20. In the same period, Fe ii emission lines start to dominate the spectrum.. 5.2. Spectroscopic comparison with other underluminous SNe Ia. In Figs. 9 to 11 the spectra of SN 2005bl are compared with those of other underluminous SNe Ia at epochs of about −5 d, +4 d and +30 d, respectively. For illustration, a comparison with the spectra of the intermediate decliner SN Ia 2004eo (∆m15 (B)true = 1.46, Pastorello et al. 2007b) is made in Fig. 12. The figures show that 91bg-like SNe form a relatively homogeneous spectroscopic subclass, distinct from SNe Ia with normal luminosity and even from those with ∆m15 (B)true close to 1.5. Already at −5 d (Fig. 9) the underluminous SNe Ia show evident Ti features between 4000 and 4400 Å, which are absent in SN 2004eo (Fig. 12) where this region is dominated by Si and Mg lines. At the same time Fig. 12 suggests that at −6 d the continuum temperatures are not too different, indicating that the strength of the Ti features in 91bg-like SNe may not be a pure temperature effect but require a truly larger Ti abundance (see also Section 6.2). In SN 1986G (Phillips et al. 1987) the Ti lines are less pronounced than in SNe 1998de (Matheson et al. 2007), 1999by (Garnavich et al. 2004) and 2005bl, emphasising its transitional character between “normal” and strictly 91bg-like SNe Ia. Also, the absolute depth of the Si ii λ6355 line in SN 1986G resembles more that of SN 2004eo than those. Figure 11. The same as Fig. 9, but 4–5 weeks after maximum light in B. The spectra of SNe 1997cn and 2005bl were smoothed using kernel sizes of 600 km s−1 .. of SNe 1999by and 2005bl. The Si ii lines and most other features of SN 1998de at day −5 are broader and at bluer wavelength than in the other SNe of the sample. The spectra of SNe 2005bl and 1999by are essentially identical, the only exception being the flux depletion in SN 2005bl redwards of the Si ii λ6355 line at −6 and −5 d, which we attribute to C ii λ6580 (see also Section 7.4). O i λ7774 is particularly pronounced in all underluminous SNe Ia for which the spectral region is covered..
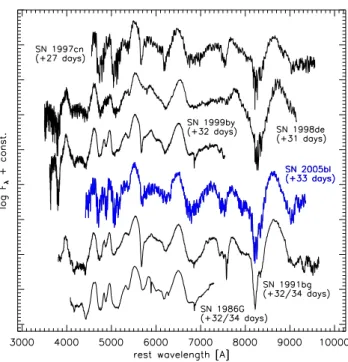
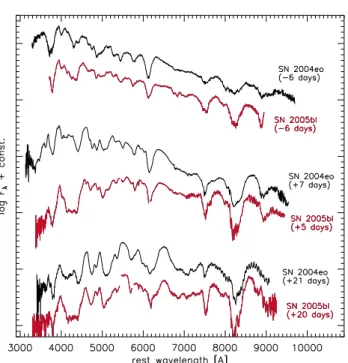
(12) 12. Taubenberger et al.. Figure 12. Spectroscopic comparison of SN 2005bl and the intermediate decliner SN 2004eo (Pastorello et al. 2007b) at three different epochs. The spectra of SN 2004eo have been dereddened for E(B − V ) = 0.109 mag; the −6 d spectrum of SN 2005bl was smoothed using a kernel of 2300 km s−1 .. Figure 13. Expansion velocities of S ii λ5640, Si ii λ6355, O i λ7774 and the Ca ii NIR-triplet as measured from the minima of the P-Cygni line profiles in SN 2005bl.. at late epochs (Filippenko et al. 1992b; Turatto et al. 1996; Mazzali et al. 1997), is also present in SN 2005bl. By a few days after maximum light (Fig. 10) the spectra have evolved significantly with the continuum being much redder now, but the degree of homogeneity is still remarkably high. The Ti troughs in the blue are now fully developed, showing the characteristic flat bottom that distinguishes 91bg-like from other SNe Ia (Fig. 12). The Wshaped S ii lines around 5500 Å are comparatively weak. Again SN 1986G takes an intermediate position, with the characteristic properties of the underluminous class being less pronounced than in the other objects shown in Fig. 10. The spectra taken 4–5 weeks past maximum (Fig. 11) reveal that at those phases the transition to the nebular phase has already started. Emission lines of Fe-group elements are visible, but the pseudo-continuum has not yet vanished. Ca ii, O i and the Ti trough are still prominent in absorption, while S ii lines cannot be identified any longer. A characteristic feature of many 91bg-like SNe Ia at those epochs is the remarkably narrow Na i D absortion near 5700 Å. Especially in SNe 1991bg (Filippenko et al. 1992b; Leibundgut et al. 1993; Turatto et al. 1996), 1997cn (Turatto et al. 1998) and 1999by this line is very deep and distinct, while it is less pronounced in SNe 2005bl and, in particular, 1986G and 1998de (Modjaz et al. 2001), where also the narrow core is absent. As already noted by Modjaz et al. (2001), SN 1998de deviates significantly from other 91bg-like SNe between 6800 and 7700 Å, exhibiting a relatively smooth continuum without strong O i λ7774 feature. Unfortunately, no late-time spectra of SN 2005bl were obtained, so that it cannot be verified whether the distinct, broad nebular emission feature near 7300 Å, which characterises SN 1991bg and distinguishes it from ordinary SNe Ia. 5.3. Ejecta velocities. Although ejecta velocities inferred from the blueshift of the absorption minima of P-Cygni lines suffer from a number of uncertainties (such as the typically strong line blending in SN Ia spectra), they do provide important information about the kinetic energy of the ejecta, and can be used as an observationally accessible parameter for comparison studies between different SNe. Furthermore, the range of velocities encompassed by different elements provides insight into the chemical stratification of the ejecta, and hence into nucleosynthesis conditions. This fact has recently been made use of in the Zorro diagnostics (Mazzali et al. 2007). In SNe Ia, especially the Si ii λ6355 has proved to be a suitable velocity indicator, since the line is usually well pronounced, fairly unblended and well visible over a relatively long period. The Si line velocity in SN 2005bl (Fig. 13) evolves from ∼ 11 000 km s−1 at −6 d to ∼ 6600 km s−1 at +33 d. At maximum light, it is about 10 000 km s−1 , which is low for a SN Ia. The velocity evolution of S ii λ5640 resembles that of Si ii, but the temporal decrease is steeper, and the absolute values are systematically lower by 500–2500 km s−1 , meaning that the line predominantly forms in deeper layers of the ejecta (note that the line is visible only until +5 d). The Ca ii IR triplet, on the other hand, has higher velocities than Si ii, and the difference increases from about 1000 km s−1 at −6 d to 3500 km s−1 at +33 d. This relatively shallow decrease in velocity means that Ca ii lines mainly form well above the photosphere. Finally, O i λ7774 also exhibits a fairly constant velocity of 9000–10 000 km s−1 during the entire period of our observations, but this result is not very robust as the feature may be substantially blended with Mg ii λ7890..
(13) SN 2005bl 6. 13. SPECTRAL MODELLING. A 1D Monte-Carlo spectrum synthesis code (Mazzali 2000) was used to simulate the radiation-transport processes in the expanding ejecta of SN 2005bl. Basic assumptions include spherical symmetry, a Chandrasekhar-mass explosion, and an underlying density profile adopted from the W7 explosion model of Nomoto, Thielemann & Yokoi (1984). No attempt was made to obtain better results altering these ingredients. Synthetic fits to four early-time spectra of SN 2005bl were obtained and are presented here, after a short introduction to the concept of the code and the underlying model.. 6.1. Concept of the radiative transfer code. Only a brief outline is given here; for detailed descriptions of the code see Abbott & Lucy (1985), Mazzali & Lucy (1993), Lucy (1999) and Mazzali (2000), where the basic developments are documented. The radiative transfer is performed above the photosphere, which is located at an adjustable radius rph . Energy deposition from radioactivity is assumed to occur below the photosphere, from which a blackbody continuum is thought to be emitted. In the “atmosphere” above, radiative equilibrium is supposed to hold. Photons interact with lines and scatter on free electrons, but no continuum formation is assumed (Schuster-Schwarzschild approximation). The underlying W7 density profile is scaled to match the epoch of each spectrum, assuming homologous expansion, i.e. r = v t for each particle.10 Element abundances are assumed to be homogeneous inside the envelope. They can be freely adjusted in order to match a given observed spectrum. In our Monte Carlo calculation, radiation packets are followed from their emission at the photosphere through their interaction history, until they either escape or are reabsorbed at the photosphere. The code takes into account scattering processes (on atoms / ions and electrons) as well as photon branching (absorption in an atomic line and subsequent reemission in another). Line optical depths are calculated in the Sobolev approximation, applicable for fastexpanding atmospheres. Ionisation and excitation conditions are calculated from the radiation-field statistics. This is done using approximate NLTE formulae (see references above), which in principle employ LTE radiative rates, but additionally take into account the dilution of the radiation field. Collision processes are neglected. A radiation temperature TR , determining radiative rates, is calculated in each zone of the envelope. As in Mazzali & Lucy (1993) it is chosen such that the mean frequency of the radiation field inside the zone matches that of a blackbody at TR . The matter state and the radiation field are iterated until sufficient convergence is achieved. Within this process, the temperature of the inner-boundary blackbody spectrum is adjusted in order to match the bolometric SN luminosity. Finally, the emitted spectrum is recalculated solving the formal integral, employing source functions obtained from. 10. This is almost exact for our purposes, as the expansion is homologous already ∼ 10 s after explosion onset (see e.g. Röpke 2005).. Figure 14. Synthetic fits to the SN 2005bl spectra at days −6.0, −5.0, −3.0 and +4.8. The observed spectra were smoothed with kernel sizes of 2300 km s−1 (−6.0 d) and 3400 km s−1 (−5.0 d and −3.0 d–blue part) for presentation. The values of relevant fitparameters are summarised in Table 7. Atop the −6 d spectrum an identification of the most important lines is given.. the packet statistics. This yields smooth spectra at relatively low packet numbers.. 6.2. Physical parameters and the chemical composition of the models. The basic parameters and composition inferred from the best-fitting synthetic spectra are reported in Table 7. In Fig. 14 these models are compared to the observed spectra, and line identifications for the −6 d spectrum are shown. A rise time to the B-band maximum of 17.0 d is assumed, slightly less than the fiducial value of ∼ 19.5 d for normalluminosity SNe Ia (Riess et al. 1999; Conley et al. 2006). This choice is discussed in Section 7.2. While the overall shape of the continua is nicely matched and most features are well reproduced, the main shortcomings of the models are a flux excess in the emission component of Si ii λ6355 at early times, and, more worrysome, a mismatch in the position of some lines. Additionally, many synthetic features are too broad and strongly blended, as they were in models for SN 1991bg (Mazzali et al. 1997). No substantial improvement is ob-.
(14) 14. Taubenberger et al.. Table 7. Physical parameters of SN 2005bl inferred from synthetic spectra, assuming a rise time of 17 d in B. The mass fractions of selected elements are also recorded, and solar photospheric abundances (Asplund, Grevesse & Sauval 2005) are shown for comparison. −6.0 d. −5.0 d. −3.0 d. +4.8 d. time from explosion bolometric luminosity [erg s−1 ] photospheric velocity [km s−1 ] photospheric blackbody temperature [K]. 11.0 d 1.24 × 1042 7500 10 620. 12.0 d 1.56 × 1042 7350 10 790. 14.0 d 2.06 × 1042 7100 10 670. 21.8 d 2.56 × 1042 6000 9230. X(C) X(O) X(Mg) X(Si) X(S) X(Ti) X(Cr) X(stable Fe) X(56 Ni + decay products). 0.045 0.905 0.015 0.025 0.006 3.7 × 10⁻⁴ 3.7 × 10⁻⁴ 1.0 × 10⁻⁴ –. 0.030 0.878 0.040 0.037 0.009 7.3 × 10⁻⁴ 7.3 × 10⁻⁴ 1.2 × 10⁻⁴ –. 0.010 0.847 0.060 0.060 0.013 1.4 × 10⁻³ 1.4 × 10⁻³ 4.0 × 10⁻⁴ 2.0 × 10⁻⁴. 0.000 0.788 0.080 0.090 0.020 4.5 × 10⁻³ 4.5 × 10⁻³ 1.4 × 10⁻³ 2.5 × 10⁻³. tained reducing the photospheric velocity vph , which indicates that the W7 density profile may not be perfectly suitable for 91bg-like SNe, and that a steeper density gradient may be required. With vph = 7500 km s−1 6 d prior to maximum light, the inferred photospheric velocity is significantly lower than in normal SNe Ia (∼ 10 000 to 11 000 km s−1 at comparable epochs). By day +5, vph further decreases by about 1500 km s−1 . Singly and doubly ionised species dominate the ejecta. Especially the singly ionised species leave strong imprints on the spectra, as can be seen from the line identification in Fig. 14. In all spectra modelled here the heavy-element content is comparatively low, but Table 7 shows that it increases with time, indicating composition stratification in the ejecta.11 At the higher velocities the ejecta are almost entirely made up of unburned material, whereas NSE elements are essentially absent. In particular, no Ni and Co, and only very little Fe are included in the −6 and −5 d models. After maximum light, IMEs and Fe-group elements become more abundant, but still less so than in normal-luminosity SNe Ia (cf., e.g., Stehle et al. 2005). Interestingly, Ti and Cr, whose abundances can be well constrained from the depth of the characteristic trough between 4000 and 4400 Å, appear to be more abundant than Ni, Co and Fe, yet another indication for explosion conditions which disfavour burning to NSE.. 7. solar. 2.16 × 10⁻³ 5.36 × 10⁻³ 6.04 × 10⁻⁴ 6.66 × 10⁻⁴ 3.24 × 10⁻⁴ 2.79 × 10⁻⁶ 1.66 × 10⁻⁵ 1.15 × 10⁻³. the near-IR, cooler spectra with significant Ti ii absorption troughs, low ejecta velocities and large values of the R(Si) parameter (Nugent et al. 1995). Nevertheless, the lightcurve width and peak luminosity of underluminous SNe Ia seem to obey a correlation (Garnavich et al. 2004), but not the same one as more ordinary SNe Ia. Also, 91bg-like SNe seem to fit smoothly into the Zorro plot (Mazzali et al. 2007), where they represent the extremely 56 Ni-poor, IME-rich end of the SN Ia distribution (but see Section 7.4 for a revised picture). With the increasing number of well-observed objects of this class, it is interesting to revisit some of the aspects mentioned above and to investigate in more detail the degree of homogeneity, or rather diversity, that these SNe exhibit. In Table 8 elementary information on our comparison sample of rapidly-declining SNe Ia is collected; selection criteria were a reasonably dense light-curve coverage starting at least around maximum light, and ∆m15 (B)true > 1.5.. 7.1. Photometric behaviour of underluminous SNe Ia. Here we focus on the photometric properties of underluminous SNe Ia, compare their light-curve shapes and colour indices, determine their peak absolute magnitudes, and investigate their decline-rate vs. luminosity relationship.. DISCUSSION. In a number of works (e.g. Filippenko et al. 1992b; Leibundgut et al. 1993; Ruiz-Lapuente et al. 1993; Turatto et al. 1996; Mazzali et al. 1997; Turatto et al. 1998; Modjaz et al. 2001; Garnavich et al. 2004) 91bg-like SNe Ia have been studied and found to be different from normally luminous SNe Ia in several respects. Besides their lower luminosity, they have rapidly declining light curves which do not show the characteristic secondary maximum in. Light- and colour-curve morphology Fig. 15 compares the B, V and I light curves of all the objects in Table 8, rescaled to coincide at maximum light. The SNe with ∆m15 (B)true ∼ 1.9 (red symbols in Fig. 15), including SN 2005bl, show a single-peaked broad I-band light curve, whose maximum is delayed by a few days with respect to that in B. In contrast, the SNe with ∆m15 (B)true ∼ 1.5 to 1.75 (green symbols) clearly. 11. For this reason it would be necessary to work with the stratified version of the code (Stehle et al. 2005) if accurate abundances were required. This reaches beyond the scope of this paper. Therefore, the composition reported in Table 7 reflects the overall trend, but the absolute numbers should be taken with caution.. 12. For SN 1986G the Cepheid measurement does not refer to the actual host galaxy Centaurus A, but to NGC 5253, which is a member of the same group (Ferrarese et al. 2000). It was adopted here for the lack of more reliable distance estimates..
(15) SN 2005bl. 15. Table 8. Comparison sample of SNe Ia with ∆m15 (B)true > 1.5, ordered by increasing ∆m15 (B)true . v̇a. E(B −V )b. µc. morph.d. references. 0.50(0.05) 0.60(0.04). 73(8) 68(4). 36.59(0.05) 34.18(0.13) 32.82(0.25) 34.34(0.12) 35.07(0.09) 27.61(0.11). SB0 E E2 SB0pec SBab(rs) S0pec. −18.08(0.24) −17.79(0.19) −17.65(0.25). 0.68(0.07) 0.69(0.05). 75(9) 97(4). 0.07(0.06) 0.07(0.03) 0.06(0.03) 0.03(0.03) 0.12(0.06) 0.78(0.07) RV = 2.4e 0.08(0.03) 0.03(0.03) 0.02(0.03). 33.13(0.22) 34.25(0.13) 30.75(0.23). E E Sb. −17.24(0.34) −16.85(0.34). −17.85(0.27) −17.56(0.29). 0.63(0.06) 0.66(0.05). 99(9) 106(5). 0.20(0.08) 0.08(0.06). 35.10(0.09) 31.28(0.20). E E1. −16.98(0.22) −16.74(0.19). −17.65(0.20) −17.43(0.17). 0.69(0.04). 146(3). 0.06(0.03) 0.06(0.03). 33.58(0.17) 34.06(0.14). SA0 S0. H96a, H96b, P99 J06, VSNET J06, VSNET H96a, H96b, P99 H96a, H96b, P99 H87, P87, P99, F00, B05 G04, J06 T98, B05, J06 T00, H01, V01, G04, VSNET this work F92, L93, T96, P99, F00, T01 K01 M01, J06. SN. ∆m15 (B)true. MB,max. MV,max. 1990af 2000dk 1999gh 1992bo 1993H 1986G. 1.57(0.05) 1.57(0.09) 1.69(0.05) 1.69(0.05) 1.70(0.10) 1.81(0.07). −18.96(0.25) −18.84(0.18) −18.60(0.30) −18.61(0.17) −18.57(0.25) −17.76(0.32). −18.98(0.19) −18.83(0.17) −18.73(0.28) −18.59(0.15) −18.73(0.20) −18.03(0.26). 1998bp 1997cn 1999by. 1.83(0.06) 1.88(0.10) 1.90(0.05). −17.73(0.25) −17.17(0.20) −17.17(0.26). 2005bl 1991bg. 1.93(0.10) 1.94(0.10). 1999da 1998de. 1.95(0.10) 1.95(0.09). R(Si)max. a. Post-maximum decrease of the Si ii λ6355 velocity in km s−1 d−1 , see Benetti et al. (2005) ans Section 7.3. b Total (Galactic + host galaxy) colour excess. c Distance modulus from Cepheids (SNe 1986G and 1999by)12 , SBF and PNLF (SN 1991bg) or the host galaxy recession velocity with respect to the CMB rest frame (NED) assuming H0 = 72 km s−1 Mpc−1 (other SNe). For the latter, an uncertainty of 300 km s−1 has been adopted to account for the galaxies’ peculiar motions. d Host-galaxy morphology (from LEDA). e Spectropolarimetry (Hough et al. 1987) indicates R = 2.4 ± 0.13 for the dust in Centaurus A, the host of SN 1986G. We adopted V this value and propagated the assigned error to the uncertainty in the absolute magnitudes. H96a = Hamuy et al. (1996a); H96b = Hamuy et al. (1996b); P99 = Phillips et al. (1999); J06 = Jha et al. (2006); H87 = Hough et al. (1987); P87 = Phillips et al. (1987); F00 = Ferrarese et al. (2000); B05 = Benetti et al. (2005); G04 = Garnavich et al. (2004); T98 = Turatto et al. (1998); T00 = Toth & Szabo (2000); H01 = Howell et al. (2001); V01 = Vinkó et al. (2001); F92 = Filippenko et al. (1992b); L93 = Leibundgut et al. (1993); T96 = Turatto et al. (1996); T01 = Tonry et al. (2001); K01 = Krisciunas et al. (2001); M01 = Modjaz et al. (2001); VSNET = Variable Star Network. have double-peaked I-band light curves, and, as in normalluminosity SNe Ia, the first I-band peak precedes that of the B band (e.g. Hamuy et al. 1996c; Leibundgut 2000). These observations are in agreement with the results of Kasen (2006), who computed synthetic light curves with the sedona code, varying the mass of 56 Ni. His prediction is an ever smaller temporal offset of the first and secondary Iband maxima with decreasing SN luminosity, and the merging to a single broad peak for the most underluminous objects. The B-band light curves of the two groups (red and green symbols in Fig. 15) also exhibit noticeable differences in shape, probably influenced by the evolution of the Ti trough. 91bg-like SNe settle to the radioactive tail earlier, only ∼ 15 d after maximum light. Consequently, the drop in magnitude from the peak to the tail is smaller for these, although their initial decline is steeper. Thus, the B light curves of 91bg-like and “normal” SNe Ia cannot be transformed into each other by employing a simple strech factor. The only objects in the sample with 1.75 6 ∆m15 (B)true < 1.85 are SNe 1986G and 1998bp (yellow symbols). The light-curve morphology of these SNe seems to provide a link between the formerly defined groups. While the I band is still single-peaked with maybe a hint of a double peak, the luminosity drop from maximum to the radioactive tail in the B band resembles that of SNe with ∆m15 (B)true < 1.75. The existence of objects with such intermediate properties might support the idea of a common progenitor and explosion scenario for all SNe Ia. However, SN statistics tell us that objects with ∆m15 (B)true ≈ 1.8 are intrinsically rare.. Fig. 16 shows the reddening-corrected B − V and V − I colour curves of the same SNe as above. The differences in B − V after +30 d are marginal, and all SNe obey the Lira (1995) relation within the uncertainties (note, however, that for the more strongly-reddened SNe 1986G and 2005bl the Lira relation was directly or indirectly used to infer the true extinction along the line of sight, making this a circular argument). On the contrary, the B −V colour evolution around maximum light shows remarkable differences, the 91bg-like SNe Ia having a much redder colour at maximum (0.4 to 0.7 mag, compared to ∼ 0.0 mag for SNe Ia with ∆m15 (B)true < 1.75). Also, the peak B − V colour is reached earlier in underluminous SNe, and is redder by ∼ 0.3 mag.. In V − I the differences among the objects of Table 8 are even more pronounced.The V − I colour index of SNe Ia with 1.50 < ∆m15 (B)true < 1.75 decreases from about 10 d before to 5–10 d after B-band maximum just like in all intermediate or slow decliners, then increases steeply, levelling off at ∼ 20 d and again decreasing slowly thereafter. 91bglike SNe, in contrast, do not show the initial bluening, but become redder from the very first available observations onwards. This behaviour continues until ∼ 15 d past maximum, when the curves flatten and subsequently a soft bluening sets in. Evidently, the origin of the different V − I evolution lies in the different delay of the main maximum and the presence or absence of the secondary maximum in the I band..
(16) 16. Taubenberger et al.. Figure 16. Evolution of the B − V (top panel) and V − I (bottom panel) colour indices of the rapidly-declining SN Ia sample of Table 8 plus SN 1992al. The symbols and colour coding are the same as in Fig. 15. The dash-dotted line in the lower panel represents the Lira (1995) relation, i.e. the uniform B − V colour that all SNe Ia are supposed to exhibit between day +30 and +90.. Figure 15. BVI light curves of the rapidly-declining SNe Ia of Table 8, normalised to their peak magnitudes. The ∆m15 (B)true of each SN is given in parentheses. Different symbol colours represent different decline rates (green: 1.50 < ∆m15 (B)true < 1.75; yellow: 1.75 6 ∆m15 (B)true < 1.85); red: ∆m15 (B)true > 1.85). Light-curve templates of SN 1992al (∆m15 (B)true = 1.11, Hamuy et al. 1996c) are shown for comparison.. Absolute magnitudes & Phillips relation Table 8 shows that the peak absolute magnitudes of the SNe with ∆m15 (B)true > 1.5 span a wide range, from −16.74 to −18.96 in the B band. As Hamuy et al. (1996a), Phillips et al. (1999) and Garnavich et al. (2004) pointed out, also for these SNe the peak magnitudes correlate with ∆m15 (B)true , but the dependence is steeper than for more slowly declining SNe Ia. Based only on SNe with ∆m15 (B)true > 1.69, our best linear fits (Fig. 17) are given by MB,peak = −18.54 + 5 log(H0 /72) + 6.83 (∆m15 (B)true − 1.7) MV,peak = −18.61 + 5 log(H0 /72) + 4.33 (∆m15 (B)true − 1.7).. The slopes of 6.83 ± 0.32 and 4.33 ± 0.31 for the B and V bands are in excellent agreement with the results of Garnavich et al. (2004), and much steeper than what Hamuy et al. (1996a) find for SNe with ∆m15 (B)true 6 1.69 (0.78 ± 0.17 and 0.71 ± 0.14 for B and V , respectively). Also the quadratic relation derived by Phillips et al. (1999) for SNe with ∆m15 (B)true < 1.70 provides a poor fit to the peak magnitudes of fast decliners.. Figure 17. Peak absolute B- and V -band magnitudes of the SN sample of Table 8. The dotted lines are the best linear fits to the data with ∆m15 (B)true > 1.69, characterised by slopes of 6.83 ± 0.32 and 4.33 ± 0.31 for B and V , respectively. The solid lines show the quadratic relation obtained by Phillips et al. (1999) for SNe Ia with ∆m15 (B)true < 1.70..
Figure
+7
Documento similar